. 2020 Oct 1;2(2):fcaa162.
doi: 10.1093/braincomms/fcaa162. eCollection 2020.

Gain-of-function GABRB3 variants identified in vigabatrin-hypersensitive epileptic encephalopathies

Affiliations

Gain-of-function GABRB3 variants identified in vigabatrin-hypersensitive epileptic encephalopathies

Nathan L Absalom et al. Brain Commun. .

Abstract

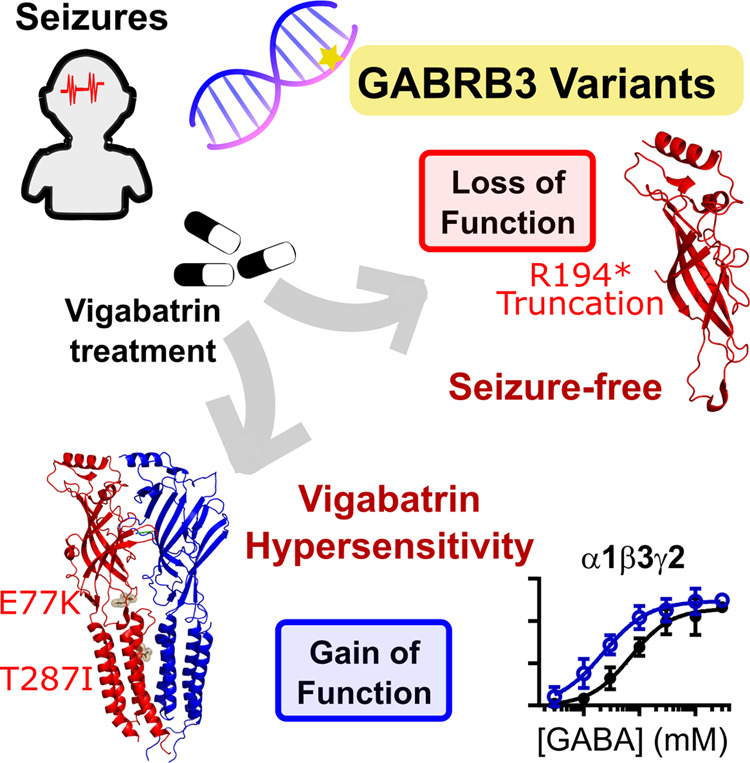
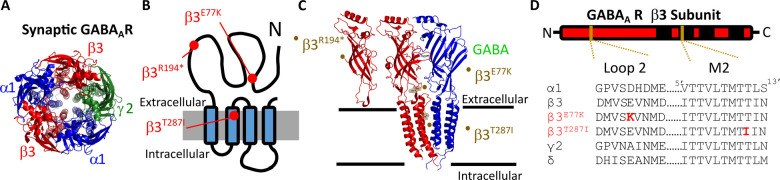
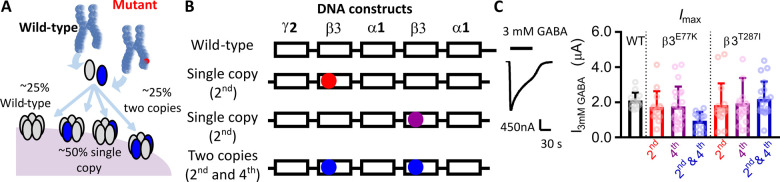
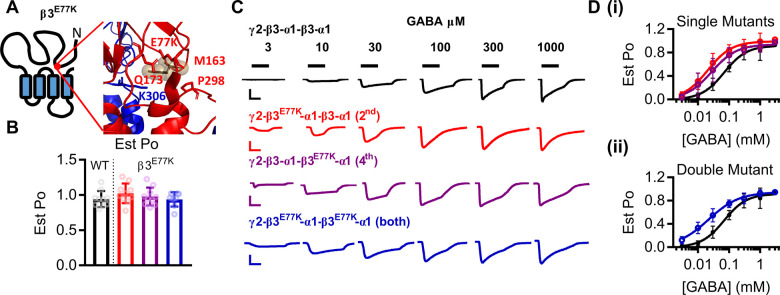
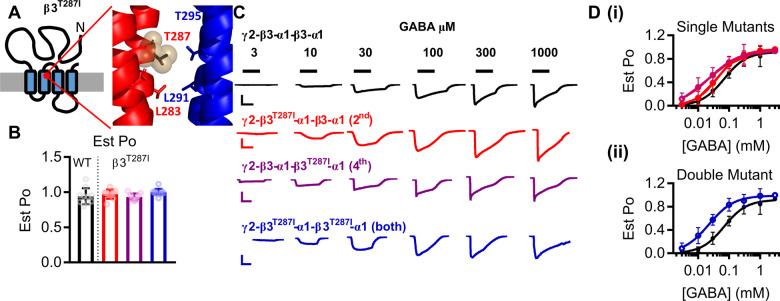
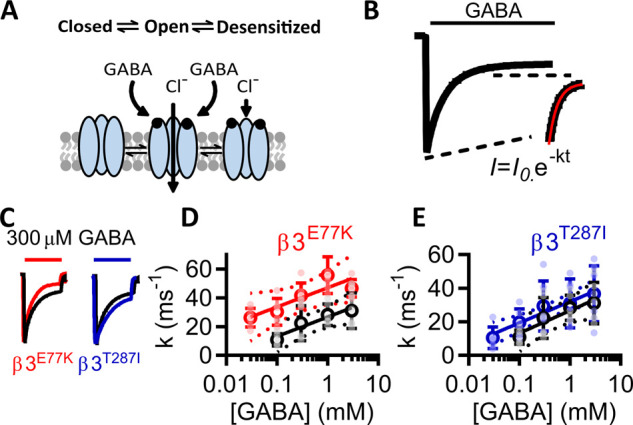
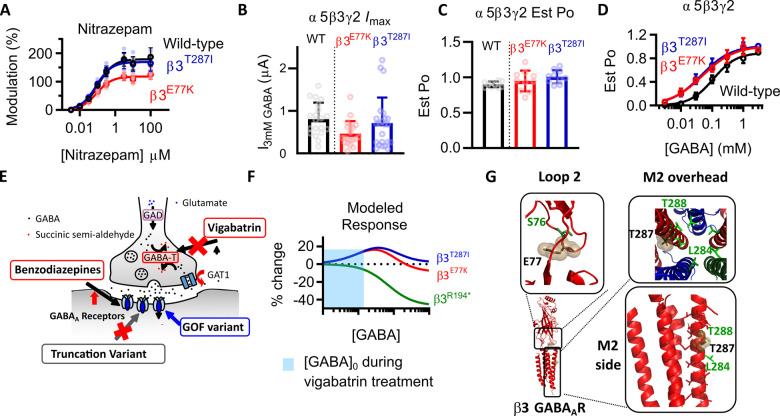
Variants in the GABRB3 gene encoding the β3-subunit of the γ-aminobutyric acid type A ( receptor are associated with various developmental and epileptic encephalopathies. Typically, these variants cause a loss-of-function molecular phenotype whereby γ-aminobutyric acid has reduced inhibitory effectiveness leading to seizures. Drugs that potentiate inhibitory GABAergic activity, such as nitrazepam, phenobarbital or vigabatrin, are expected to compensate for this and thereby reduce seizure frequency. However, vigabatrin, a drug that inhibits γ-aminobutyric acid transaminase to increase tonic γ-aminobutyric acid currents, has mixed success in treating seizures in patients with GABRB3 variants: some patients experience seizure cessation, but there is hypersensitivity in some patients associated with hypotonia, sedation and respiratory suppression. A GABRB3 variant that responds well to vigabatrin involves a truncation variant (p.Arg194*) resulting in a clear loss-of-function. We hypothesized that patients with a hypersensitive response to vigabatrin may exhibit a different γ-aminobutyric acid A receptor phenotype. To test this hypothesis, we evaluated the phenotype of de novo variants in GABRB3 (p.Glu77Lys and p.Thr287Ile) associated with patients who are clinically hypersensitive to vigabatrin. We introduced the GABRB3 p.Glu77Lys and p.Thr287Ile variants into a concatenated synaptic and extrasynaptic γ-aminobutyric acid A receptor construct, to resemble the γ-aminobutyric acid A receptor expression by a patient heterozygous for the GABRB3 variant. The mRNA of these constructs was injected into Xenopus oocytes and activation properties of each receptor measured by two-electrode voltage clamp electrophysiology. Results showed an atypical gain-of-function molecular phenotype in the GABRB3 p.Glu77Lys and p.Thr287Ile variants characterized by increased potency of γ-aminobutyric acid A without change to the estimated maximum open channel probability, deactivation kinetics or absolute currents. Modelling of the activation properties of the receptors indicated that either variant caused increased chloride flux in response to low concentrations of γ-aminobutyric acid that mediate tonic currents. We therefore propose that the hypersensitivity reaction to vigabatrin is a result of GABRB3 variants that exacerbate GABAergic tonic currents and caution is required when prescribing vigabatrin. In contrast, drug strategies increasing tonic currents in loss-of-function variants are likely to be a safe and effective therapy. This study demonstrates that functional genomics can explain beneficial and adverse anti-epileptic drug effects, and propose that vigabatrin should be considered in patients with clear loss-of-function GABRB3 variants.

Keywords: GABAA receptor; benzodiazepines; developmental and epileptic encephalopathies; gain-of-function variants; vigabatrin.


Figures

Graphical Abstract
Graphical Abstract
Figure 1
Figure 1
Structural location of GABAA receptor variants. (A) Pentameric structure from the extracellular side of the membrane of the α1β3γ2 synaptic GABAA receptor (Masiulis et al., 2019). α1 subunits are in blue, β3 in red and γ2 in green. (B) Schematic of a single β3 GABAA receptor showing the location of the β3E77, β3R194 and β3T287 residues (red) in the extracellular and the four transmembrane domains M1–M4 (black). (C) Also shown is the structure of the interface between β3 and α1 subunits from side-on showing the truncation of the β3R194* subunit, the structure displaying the β3E77 residue (black sticks and spheres) in the coupling region connecting the extracellular domain and the transmembrane domains, and the β3T287 residue (black sticks and spheres) at the top of the pore lining M2 region. (D) The sequence alignment for selected subunits is shown below in the loop 2 and M2 regions that contain the β3E77K and β3T287I variants, respectively (red).
Figure 2
Figure 2
Design and expression levels of synaptic receptor constructs. (A) Diagram depicting the mixture of receptors formed on the cell surface from a de novo variant. Assuming equivalent expression and random assembly, four different receptors will be expressed at equal ratios. (B) Concatenated DNA constructs used to determine the functional effect of each variant at all expressed receptors. Five subunits were linked in the order γ2-β3-α1-β3-α1 such that cRNA injected into Xenopus oocytes resulted in pentameric receptors of the same orientation as synaptic receptors. Three separate constructs were created for the β3E77K and β3T287I variants where the variant was introduced into the 2nd subunit (red), the 4th subunit (purple) or both the 2nd and 4th subunits (blue) of the construct. This replicated the effect of the variant in vivo, where a WT receptor, two receptors containing a single copy of the variant and a receptor containing two copies of the variant are expressed. (C) Representative trace from two-electrode voltage recordings of a response to 3 mM GABA (black bars) of Xenopus oocytes injected with the WT concatenated receptor construct. (D) Bar graph of maximum currents elicited by 3 mM GABA at receptors (black) and at receptors containing β3E77K or β3T287I variants with one copy of the variant in the 2nd subunit (red), one copy in the 4th subunit (purple) and two copies in the 2nd and 4th subunit (blue). Dots represent individual experiments and bars represent mean ± SD.
Figure 3
Figure 3
Gain-of-function molecular phenotype of β3E77K variant. (A) The location of the β3E77K variant in a schematic of the β3 subunit and in the protein structure displaying a close-up of the coupling interface between the extracellular and transmembrane regions. (B) Bar graphs representing individual experiments (dots) and the mean ± SD for the estimated open probability of WT (black) and β3E77K constructs containing one copy of the variant in the 2nd subunit (red), one copy in the 4th subunit (purple) and two copies in the 2nd and 4th subunit (blue). The estimated open probability was calculated by comparing the response at 3 mM GABA to the response at 10 mM GABA, 3 μM etomidate and 1 μM diazepam. (C) Representative traces of currents recorded from Xenopus oocytes injected with WT (black) and β3E77K constructs containing one copy of the variant in the 2nd subunit (red), one copy in the 4th subunit (purple) and two copies in the 2nd and 4th subunit (blue). GABA concentrations were applied as indicated by the black bars to construct the concentration–response curves. Scale bars indicate 200 nA and 30 s, except for the blue bar that represents 50 nA and 30 s. (D) Concentration–response curves of WT and (i) concatenated constructs containing the β3E77K variant in the 2nd (red) or 4th subunit and (ii) the concatenated construct containing a β3E77K variant in the 2nd and 4th subunits. Symbols represent mean ± SD and data were fitted to the Hill equation.
Figure 4
Figure 4
Gain-of-function molecular phenotype of β3T287I variant. (A) The location of the β3T287I variant in a schematic of the β3 subunit and in the protein structure displaying a close-up of the M2 domains of the β3 (red) and α1 (blue) subunits. (B) Bar graphs representing individual experiments (dots) and the mean ± SD for the estimated open probability of WT (black) and β3T287I constructs containing one copy of the variant in the 2nd subunit (red), one copy in the 4th subunit (purple) and two copies in the 2nd and 4th subunit (blue). The estimated open probability was calculated by comparing the response at 3 mM GABA to the response at 10 mM GABA, 3 μM etomidate and 1 μM diazepam. (C) Representative traces of currents recorded from Xenopus oocytes injected with WT (black) and β3T287I constructs containing one copy of the variant in the 2nd subunit (red), one copy in the 4th subunit (purple) and two copies in the 2nd and 4th subunit (blue). GABA concentrations were applied as indicated by the black bars to construct the concentration–response curves. Scale bars indicate 200 nA and 30 s, except for the purple bar that represents 2 000 nA and 30 s. (D) Concentration–response curves of WT and (i) concatenated constructs containing the β3T287I variant in the 2nd (red) or 4th subunit and (ii) the concatenated construct containing a β3T287I variant in the 2nd and 4th subunits. Symbols represent mean ± SD and data were fitted to the Hill equation.
Figure 5
Figure 5
Desensitization properties of β3E77K and β3T287I variants. (A) Schematic displaying desensitization of the receptor, whereby subsequent to GABA binding, GABAA receptors shift between open and closed desensitizing states. (B) To measure the rate of desensitization, the recording apparatus was configured to remove dead volume and GABA was applied for 120 s, and the deactivation rates in the presence of GABA were fitted to an exponential decay function, with the deactivation constant determined for different GABA concentrations against WT and double mutant receptors. (C) Comparison of the WT and double mutant β3E77K and β3T287I receptors. Traces normalized to the peak current are shown for responses to 300 µM GABA at WT (black), β3E77K (red) and β3T287I receptors (blue) receptors, with the scale bar indicating 50 s. (D) and (E) Deactivation constants were plotted against the log of GABA concentrations and fitted to a linear function (95% confidence interval in dotted line) for the WT (black) and (D) β3E77K (red) and (E) β3T287I receptors (blue) receptors.
Figure 6
Figure 6
Vigabatrin and GABAA receptor variants at receptors mediating tonic currents. (A) Concentration–response curves of the positive modulation of EC10 GABA currents by nitrazepam at WT (black), β3E77K (red) and β3T287I (blue) receptors The maximum modulation was significantly reduced at β3E77K receptors compared to WT (P < 0.01, one-way ANOVA with Dunnett’s post hoc test). (B) Bar graph of maximum currents elicited by 3 mM GABA at WT γ2-β3-α5-β3-α5 receptors (black) and receptors containing two copies of the β3E77K (red) or β3T287I (blue). Dots represent individual experiments and bars represent mean ± SD. (C) Bar graphs representing individual experiments (dots) and the mean ± SD for the estimated open probability of WT γ2-β3-α5-β3-α5 (black) β3E77K (red) or β3T287I (blue) receptors. The estimated open probability was calculated by comparing the response of 3 mM GABA was compared to the response to 10 mM GABA and 10 μM etomidate. (D) Concentration–response curves of WT γ2-β3-α5-β3-α5 (black) β3E77K (red) or β3T287I (blue) receptors to GABA. Symbols represent mean ± SD and data were fitted to the Hill equation. (E) Depiction of an inhibitory synapse describing the mechanism of action of vigabatrin. GABA transaminase catalyses the breakdown of GABA into succinic semi-aldehyde, which is inhibited by vigabatrin. This reverses the transport gradient of GAT-1, leading to non-vesicular release of GABA into the synapse to increases the tonic current of the post-synaptic neuron. In two patients with hypersensitivity to vigabatrin, a variant was identified in the β3 subunit of the GABAA receptor that increased the response of the receptor to vigabatrin, while the patients with a truncation of the GABRB3 gene that causes a loss-of-function variant, responded to vigabatrin without hypersensitivity. (F) Modelled change in response compared to the WT of β3E77K (red) and β3T287I receptors (blue) compared to the WT, showing the predicted difference in current levels at different GABA concentrations. The x-axis indicates no change. The shaded region is the expected [GABA]0 concentration elicited by vigabatrin. (G) Structure of the α1β3γ2 GABAA receptor (Masiulis et al., 2019) showing the location of the β3E77 residue within loop 2 (black sticks and spheres) and the β3S76 residue that is homologous to the A52 residue of the GlyR that is associated with hyperekplexia (Plested et al., 2007). The β3T287 residue is shown in a side and overhead view of the M2 region (black sticks and spheres). Also shown is the central β3L284 and β3T288 residue that is also associated with DEE (Hernandez et al., 2017).

References

    1. Absalom NL, Ahring PK, Liao VW, Balle T, Jiang T, Anderson LL, et al. Functional genomics of epilepsy-associated mutations in the GABAA receptor subunits reveal that one mutation impairs function and two are catastrophic. J Biol Chem 2019; 294: 6157–71. - PMC - PubMed
    1. Anstee QM, Knapp S, Maguire EP, Hosie AM, Thomas P, Mortensen M, et al. Mutations in the Gabrb1 gene promote alcohol consumption through increased tonic inhibition. Nat Commun 2013; 4: 2816. - PMC - PubMed
    1. Butler KM, Moody OA, Schuler E, Coryell J, Alexander JJ, Jenkins A, et al. De novo variants in GABRA2 and GABRA5 alter receptor function and contribute to early-onset epilepsy. Brain 2018; 141: 2392–405. - PMC - PubMed
    1. Chiron C, Dulac O. The pharmacologic treatment of Dravet syndrome. Epilepsia 2011; 52: 72–5. - PubMed
    1. Delahanty RJ, Kang JQ, Brune CW, Kistner EO, Courchesne E, Cox NJ, et al. Maternal transmission of a rare GABRB3 signal peptide variant is associated with autism. Mol Psychiatry 2011; 16: 86–96. - PMC - PubMed

LinkOut - more resources