. 2021 Feb 9;11(2):jkaa002.
doi: 10.1093/g3journal/jkaa002.

Rates of gene conversions between Escherichia coli ribosomal operons

Affiliations

Rates of gene conversions between Escherichia coli ribosomal operons

Isaac Gifford et al. G3 (Bethesda). .

Abstract

Due to their universal presence and high sequence conservation, ribosomal RNA (rRNA) sequences are used widely in phylogenetics for inferring evolutionary relationships between microbes and in metagenomics for analyzing the composition of microbial communities. Most microbial genomes encode multiple copies of rRNA genes to supply cells with sufficient capacity for protein synthesis. These copies typically undergo concerted evolution that keeps their sequences identical, or nearly so, due to gene conversion, a type of intragenomic recombination that changes one copy of a homologous sequence to exactly match another. Widely varying rates of rRNA gene conversion have previously been estimated by comparative genomics methods and using genetic reporter assays. To more directly measure rates of rRNA intragenomic recombination, we sequenced the seven Escherichia coli rRNA operons in 15 lineages that were evolved for ∼13,750 generations with frequent single-cell bottlenecks that reduce the effects of selection. We identified 38 gene conversion events and estimated an overall rate of intragenomic recombination within the 16S and 23S genes between rRNA copies of 3.6 × 10⁻⁴ per genome per generation or 8.6 × 10⁻⁶ per rRNA operon per homologous donor operon per generation. This rate varied only slightly from random expectations at different sites within the rRNA genes and between rRNA operons located at different positions in the genome. Our accurate estimate of the rate of rRNA gene conversions fills a gap in our quantitative understanding of how ribosomal sequences and other multicopy elements diversify and homogenize during microbial genome evolution.

Keywords: 16S sequencing; concerted evolution; gene conversion; mutation accumulation experiment; mutation rate; ribosomal RNA.


Figures

Figure 1
Figure 1
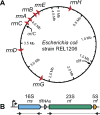
Ribosomal RNA operons in E. coli. (A) Escherichia coli B strain REL606 chromosome showing the locations and orientations of the seven rRNA operons. (B) Organization of a typical rRNA operon showing the two PCR amplicons that were sequenced at heterologous sites in evolved genomes isolated at the end of a 550-day mutation accumulation experiment.
Figure 2
Figure 2
Example of a 16S rRNA gene conversion. In the sequenced endpoint clone from line 4 of the mutation accumulation experiment, a change of a C to an A was observed at position 210 of the 16S subunit alignment in the rrnD operon. Either the rrnC, the rrnE, or the rrnG operon 16S sequence could have acted as a donor to cause this change through a gene conversion. Because the sequence of rrnD already matched all three of these donors at other alignment positions from 1 to 1001, the actual gene conversion could have been as large as 1001 base pairs.
Figure 3
Figure 3
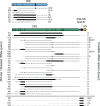
Gene conversions observed in rRNA operons during a mutation accumulation experiment. Bars in the genetic map indicate the locations of sequence differences between rRNA operons in the ancestral E. coli strain. In the remainder of the figure, boxes show the minimum possible extent of each conversion, and thick dotted lines show the maximum possible extent of each conversion. Thin dashed lines are used to indicate possible maximal extents that cross into or out of the 23S–5S spacer because conversions in this region were analyzed separately from conversions that could be localized within the 23S gene. Possible donors are listed for the largest gene conversion events that could have resulted in only the observed sequence changes; other donors may have been possible for smaller conversions.
Figure 4
Figure 4
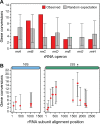
Distributions of conversion events changing the sequences of (A) rRNA operons and (B) heterologous sites within 16S and 23S rRNA genes. The random expectation values in A and error bars representing 95% confidence intervals in both A and B were estimated from 10,000 bootstrap resamplings of simulated gene conversions resembling those that were observed (see Materials and methods). The location of the Chi-like site in the 23S subunit in rrnA is starred.
Figure 5
Figure 5
Evolution of average pairwise sequence identity in 23S and 16S rRNA subunits during the mutation accumulation experiment. The final value in each evolved lineage is depicted as a bar indicating the change from the 99.578% rRNA identity present in the ancestral E. coli strain.

References

    1. Abdulkarim F, Hughes D.. 1996. Homologous recombination between the tuf genes of Salmonella typhimurium. J Mol Biol. 260:506–522. - PubMed
    1. Asai T, Condon C, Voulgaris J, Zaporojets D, Shen B, et al.1999. Construction and initial characterization of Escherichia coli strains with few or no intact chromosomal rRNA operons. J Bacteriol. 181:3803–3809. - PMC - PubMed
    1. Ceroni F, Algar R, Stan G-B, Ellis T.. 2015. Quantifying cellular capacity identifies gene expression designs with reduced burden. Nat Methods. 12:415–418. - PubMed
    1. Dahllöf I, Baillie H, Kjelleberg S.. 2000. rpoB-based microbial community analysis avoids limitations inherent in 16S rRNA gene intraspecies heterogeneity. Appl Environ Microbiol. 66:3376–3380. - PMC - PubMed
    1. Edgar RC. 2004. MUSCLE: multiple sequence alignment with high accuracy and high throughput. Nucleic Acids Res. 32:1792–1797. - PMC - PubMed

Publication types

LinkOut - more resources