. 2021 May 31;33(4):1042-1057.
doi: 10.1093/plcell/koab025.

Single-cell RNA sequencing of batch Chlamydomonas cultures reveals heterogeneity in their diurnal cycle phase

Affiliations

Single-cell RNA sequencing of batch Chlamydomonas cultures reveals heterogeneity in their diurnal cycle phase

Feiyang Ma et al. Plant Cell. .

Abstract

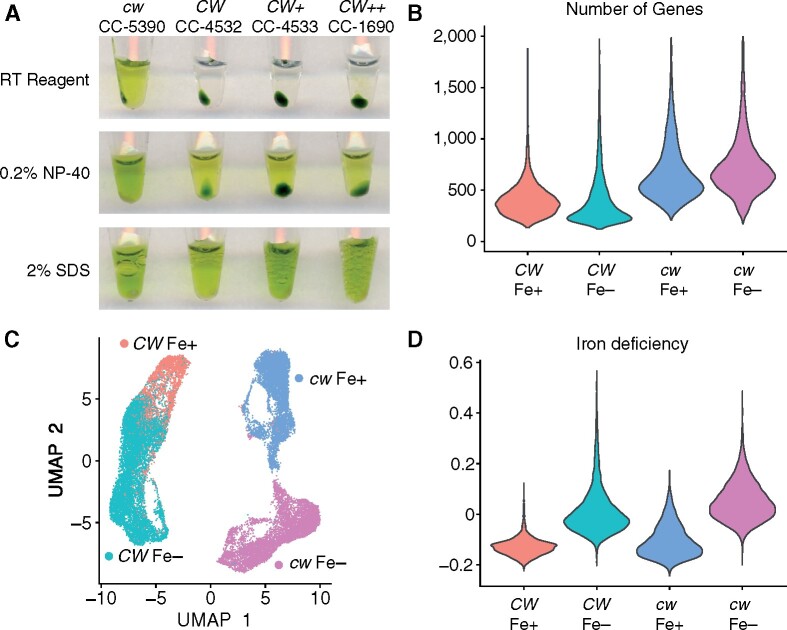
The photosynthetic unicellular alga Chlamydomonas (Chlamydomonas reinhardtii) is a versatile reference for algal biology because of its ease of culture in the laboratory. Genomic and systems biology approaches have previously described transcriptome responses to environmental changes using bulk data, thus representing the average behavior from pools of cells. Here, we apply single-cell RNA sequencing (scRNA-seq) to probe the heterogeneity of Chlamydomonas cell populations under three environments and in two genotypes differing by the presence of a cell wall. First, we determined that RNA can be extracted from single algal cells with or without a cell wall, offering the possibility to sample natural algal communities. Second, scRNA-seq successfully separated single cells into nonoverlapping cell clusters according to their growth conditions. Cells exposed to iron or nitrogen deficiency were easily distinguished despite a shared tendency to arrest photosynthesis and cell division to economize resources. Notably, these groups of cells not only recapitulated known patterns observed with bulk RNA-seq but also revealed their inherent heterogeneity. A substantial source of variation between cells originated from their endogenous diurnal phase, although cultures were grown in constant light. We exploited this result to show that circadian iron responses may be conserved from algae to land plants. We document experimentally that bulk RNA-seq data represent an average of typically hidden heterogeneity in the population.


Figures

Figure 1
Figure 1
scRNA-seq properly separates chlamydomonas cells according to their iron nutritional status. In a first experiment, we grew Chlamydomonas strain CC-5390 in Fe-replete (Fe+) conditions before being transferred to Fe+ or Fe-limited conditions (Fe−) for 23 h. Cells were then processed for scRNA-seq, starting with GEMs formation in the 10X Genomics pipeline. See also Supplemental Tables 1 and 2. (A) Characteristics of sequencing results from Chromium Single Cell 3′ gene expression libraries (first experiment). Violin plots report the number of genes, number of UMIs, and the percentage of gene expression estimates coming from the mitochondrial and chloroplast organelles in Fe+ (pink), Fe− (teal), and an equal mix of cells from Fe+ and Fe− cultures (Mix, purple). (B, C) t-SNE (B) and UMAP (C) plot for the 28,690 sequenced cells, colored by sample: Fe+, pink; Fe−, teal; Mix: purple. Each dot represents one cell. (D) UMAP plot of the iron deficiency module score, which includes genes highly induced by Fe deficiency (Urzica et al., 2012). Dark red indicates individual cells with a high iron deficiency module score and thus in a Fe-limited nutritional state. (E) Iron deficiency module score for each sample, shown as violin plots. Fe+, pink; Fe−, teal; Mix: purple. Note the bimodal distribution of the Mix sample. Wilcoxon Rank Sum Test was performed between the Fe+ and Fe− cells, the p value was below 2.2 × 10⁻¹⁶. (F) Heatmap representation of normalized gene expression estimates for of genes induced under Fe deficiency in Fe+ and Fe− cells. Each horizontal line indicates the expression of the listed gene in one cell.
Figure 2.
Figure 2.
scRNA-seq captures bulk RNA sequencing signatures of nitrogen deficiency. We grew Chlamydomonas strain CC-5390 in nitrogen (N) and Fe-replete conditions before exposing cells to N deficiency (but full Fe supply) and Fe limitation (with full N supply) for 23 h. (A) UMAP plot for 19,140 sequenced cells, colored by sample: Fe+ and N+, red; Fe− and N+, teal; N− and Fe+, purple and magenta (two technical replicates: N− R1 and N− R2). (B) UMAP plot of the N sufficiency module score, which includes genes strongly repressed by N deficiency and/or induced by N sufficiency (Schmollinger et al., 2014). Dark red indicates individual cells with a high N sufficiency module score and are thus N-replete. (C) UMAP plot of the N deficiency module score, which includes genes highly induced by N deficiency (Schmollinger et al., 2014). Dark red indicates individual cells with a high N deficiency module score and thus in an N-limited nutritional state. (D) UMAP plot showing of iron deficiency module score, using the same gene list as in Figure 1. (E) UMAP plot showing of cell division module score, based on a list of genes involved in DNA replication and chromosome segregation with a mean diurnal phase of 12–14 h (using dawn as time 0). (F) Percentage of cells with a high cell division score across the Fe+, Fe−, and N− samples. We included cells with a positive cell division module score. (G–I), Module score across all samples for chloroplast RPGs (G), cytosolic ribosomes (H), and photosynthesis-related genes (I). The chloroplast and cytosolic RPG module score includes all nucleus-encoded plastid-localized or cytosolic RPG subunits, respectively. The photosynthesis module score is derived from all nucleus-encoded photosystem I and II components, as well as chlorophyll biosynthetic genes and M factors.
Figure 3.
Figure 3.
The endogenous diurnal phase of individual cells explains the heterogeneity of batch cell cultures. (A) UMAP plot for the 9,517 sequenced cells grown in Fe+ conditions from Experiment 1. The cells were separated into clusters by Seurat (Stuart et al., 2019) and are indicated by the color gradient, with the color key on the right side of the plot. (B) Same as (A), but with 9,748 sequenced cells grown in Fe− conditions from Experiment 1. (C, D), Trajectory plot of Fe+ (C) and Fe− (D) cells from Experiment 1, colored according to their constituent clusters, as determined by Monocle. (E, F), Heatmap representation of the average diurnal module scores associated with all clusters identified for Fe+ (E) and Fe− (F) cultures. We calculated a diurnal module score for each cluster in 1-h phase bins based on diurnal phase data reported by Zones et al. (2015) of high-confidence rhythmic genes, defined as the overlap of rhythmic genes from two recent studies (Zones et al., 2015; Strenkert et al., 2019).
Figure 4.
Figure 4.
Pseudo-time construction aligns Fe+ cells along the diurnal cycle. (A) UMAP plots of representative diurnal module scores for Fe+ cells from the first experiment. (B) UMAP plots of representative diurnal module scores for Fe− cells from the first experiment. (C) Heatmap representation of the diurnal module score in individual cells, ordered by their pseudo-time, as determined by Monocle. Each vertical bar corresponds to one individual cell.
Figure 5.
Figure 5.
The chlamydomonas cell wall does not block RNA extraction for scRNA-seq analysis. (A) Testing cell lysis with the RNA extraction buffer included in the 10X Chromium pipeline. We grew strains without (CC-5390, cw) or with (CC-4532, CC-4533, CC-1690, CW) a cell wall for 3 d in TAP medium before taking a 100-µL aliquot. After collection by centrifugation, cells were incubated with RT reagent (10X Genomics), 0.2% NP-40 or 2% SDS and incubated for 15 min before spinning cells again and taking the photograph. Strain CC-1690 has a thicker cell wall than CC-4532, as indicated by “++.” (B) Number of genes from which UMIs were detected in each sample. Strain CC-4532 was grown alongside strain CC-5390 during Experiment 2 and treated in an identical manner. (C) UMAP plot of 24,795 sequenced cells from Experiment 2, using Fe status and the presence of the cell wall as variables. (D) Iron deficiency module score associated with the cells shown in (C). For (B-D) Red: CC-4532 (CW) Fe+; teal: CC-4532 (CW) Fe−; blue: CC-5390 (cw) Fe+; magenta: CC-5390 (cw) Fe−.

Comment in

  • Single-cell genomics goes greener.
    Nobori T. Nobori T. Plant Cell. 2021 May 31;33(4):792-793. doi: 10.1093/plcell/koab036. Plant Cell. 2021. PMID: 35234972 Free PMC article. No abstract available.

Similar articles

Cited by

References

    1. Abe J, Kubo T, Takagi Y, Saito T, Miura K, Fukuzawa H, Matsuda Y (2004) The transcriptional program of synchronous gametogenesis in Chlamydomonas reinhardtii. Curr Genet 46: 304–315 - PubMed
    1. Allen MD, Del Campo JA, Kropat J, Merchant SS (2007) FEA1, FEA2, and FRE1, encoding two homologous secreted proteins and a candidate ferrireductase, are expressed coordinately with FOX1 and FTR1 in iron-deficient Chlamydomonas reinhardtii. Eukaryot Cell 6: 1841–1852 - PMC - PubMed
    1. Bajhaiya AK, Dean AP, Zeef LAH, Webster RE, Pittman JK (2016) PSR1 is a global transcriptional regulator of phosphorus deficiency responses and carbon storage metabolism in Chlamydomonas reinhardtii. Plant Physiol 170: 1216–1234 - PMC - PubMed
    1. Balsalobre A, Damiola F, Schibler U (1998) A serum shock induces circadian gene expression in mammalian tissue culture cells. Cell 93: 929–937 - PubMed
    1. Becht E, McInnes L, Healy J, Dutertre CA, Kwok IWH, Ng LG, Ginhoux F, Newell EW (2019) Dimensionality reduction for visualizing single-cell data using UMAP. Nat Biotechnol 37: 38–47 - PubMed

Publication types

MeSH terms