

Nbs1-mediated DNA damage repair pathway regulates haematopoietic stem cell development and embryonic haematopoiesis
- PMID: 33586242
- PMCID: PMC7941224
- DOI: 10.1111/cpr.12972
Nbs1-mediated DNA damage repair pathway regulates haematopoietic stem cell development and embryonic haematopoiesis
Abstract
Objectives: DNA damages pose threats to haematopoietic stem cells (HSC) maintenance and haematopoietic system homeostasis. Quiescent HSCs in adult mouse bone marrow are resistant to DNA damage, while human umbilical cord blood-derived proliferative HSCs are prone to cell death upon ionizing radiation. Murine embryonic HSCs proliferate in foetal livers and divide symmetrically to generate HSC pool. How murine embryonic HSCs respond to DNA damages is not well-defined.
Materials and methods: Mice models with DNA repair molecule Nbs1 or Nbs1/p53 specifically deleted in embryonic HSCs were generated. FACS analysis, in vitro and in vivo HSC differentiation assays, qPCR, immunofluorescence and Western blotting were used to delineate roles of Nbs1-p53 signaling in HSCs and haematopoietic progenitors.
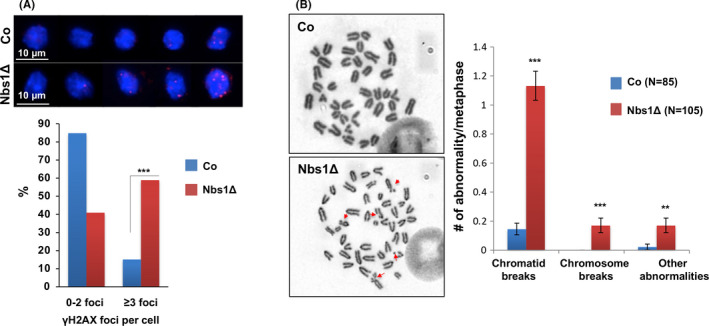
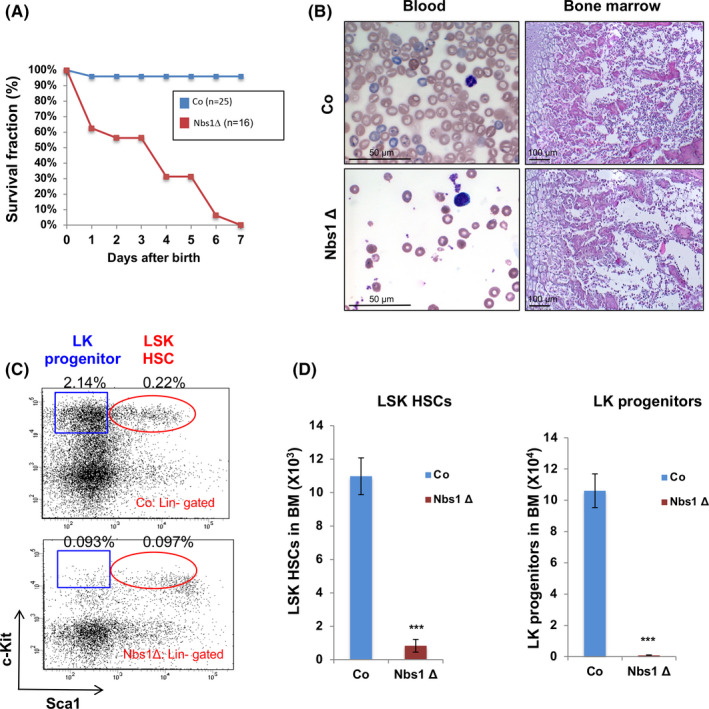
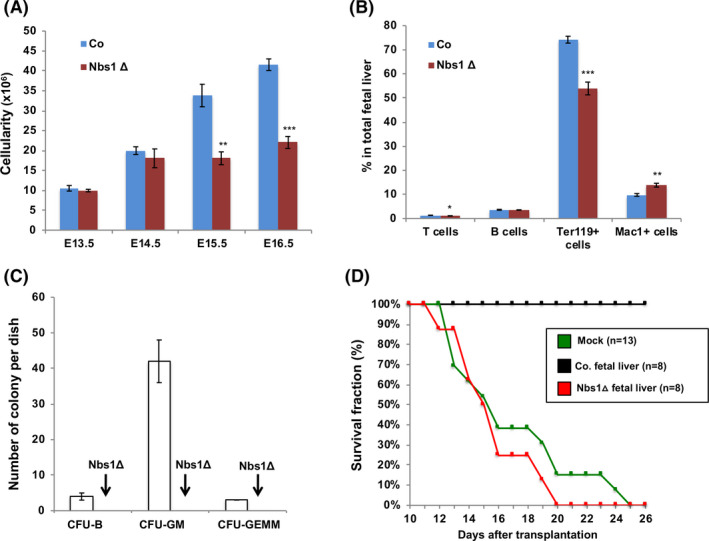
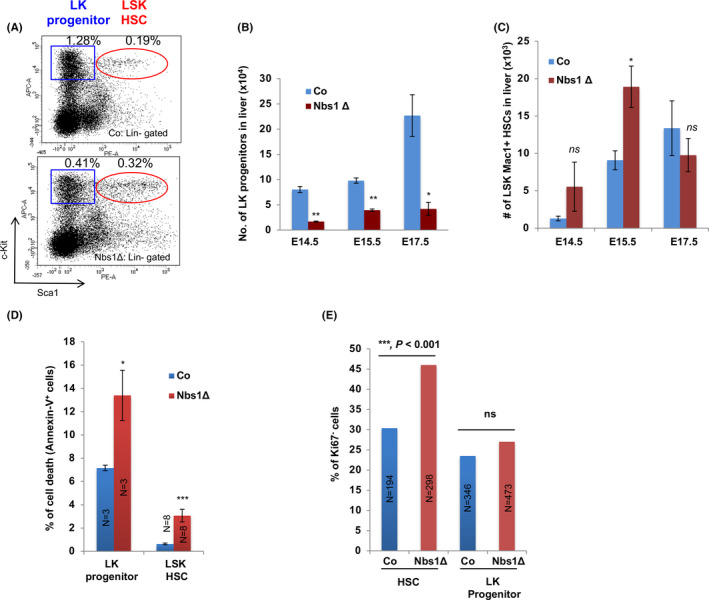
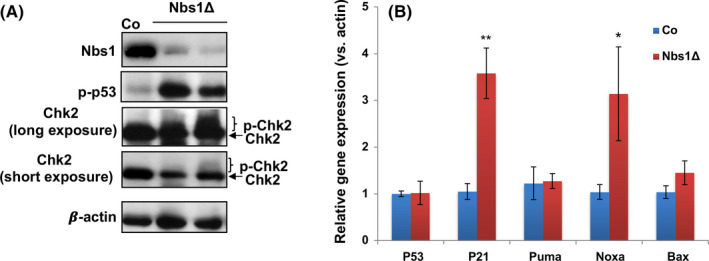
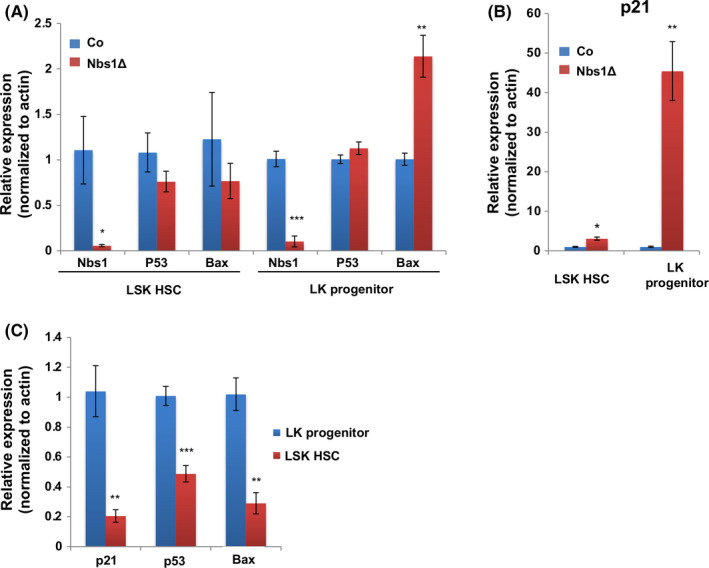
Results: Nbs1 deficiency results in persistent DNA breaks in embryonic HSCs, compromises embryonic HSC development and finally results in mouse perinatal lethality. The persistent DNA breaks in Nbs1 deficient embryonic HSCs render cell cycle arrest, while driving a higher rate of cell death in haematopoietic progenitors. Although Nbs1 deficiency promotes Atm-Chk2-p53 axis activation in HSCs and their progenies, ablation of p53 in Nbs1 deficient HSCs accelerates embryonic lethality.
Conclusions: Our study discloses that DNA double-strand repair molecule Nbs1 is essential in embryonic HSC development and haematopoiesis. Persistent DNA damages result in distinct cell fate in HSCs and haematopoietic progenitors. Nbs1 null HSCs tend to be maintained through cell cycle arrest, while Nbs1 null haematopoietic progenitors commit cell death. The discrepancies are mediated possibly by different magnitude of p53 signaling.
Keywords: Cell fate; DNA damage response; Haematopoietic stem cells; Nbs1; p53.
© 2021 The Authors. Cell Proliferation Published by John Wiley & Sons Ltd.
Conflict of interest statement
The authors have declared no competing interests.
Figures
Similar articles
-
Transcriptional regulation of haematopoietic stem cells.Adv Exp Med Biol. 2013;786:187-212. doi: 10.1007/978-94-007-6621-1_11. Adv Exp Med Biol. 2013. PMID: 23696358 Review.
-
DNA-damage response gene GADD45A induces differentiation in hematopoietic stem cells without inhibiting cell cycle or survival.Stem Cells. 2016 Mar;34(3):699-710. doi: 10.1002/stem.2282. Epub 2016 Jan 26. Stem Cells. 2016. PMID: 26731607 Free PMC article.
-
DNA Damage Response in Hematopoietic Stem Cell Ageing.Genomics Proteomics Bioinformatics. 2016 Jun;14(3):147-154. doi: 10.1016/j.gpb.2016.04.002. Epub 2016 May 21. Genomics Proteomics Bioinformatics. 2016. PMID: 27221660 Free PMC article. Review.
-
Fundamental properties of unperturbed haematopoiesis from stem cells in vivo.Nature. 2015 Feb 26;518(7540):542-6. doi: 10.1038/nature14242. Epub 2015 Feb 11. Nature. 2015. PMID: 25686605
-
Functional interaction of H2AX, NBS1, and p53 in ATM-dependent DNA damage responses and tumor suppression.Mol Cell Biol. 2005 Jan;25(2):661-70. doi: 10.1128/MCB.25.2.661-670.2005. Mol Cell Biol. 2005. PMID: 15632067 Free PMC article.
Cited by
-
Quercetin and L-Arginine Ameliorated the Deleterious Effects of Copper Oxide Nanoparticles on the Liver of Mice Through Anti-inflammatory and Anti-apoptotic Pathways.Biol Trace Elem Res. 2024 Jul;202(7):3128-3140. doi: 10.1007/s12011-023-03884-w. Epub 2023 Sep 30. Biol Trace Elem Res. 2024. PMID: 37775700 Free PMC article.
-
Hematopoietic Stem Cells and the Immune System in Development and Aging.Int J Mol Sci. 2023 Mar 20;24(6):5862. doi: 10.3390/ijms24065862. Int J Mol Sci. 2023. PMID: 36982935 Free PMC article. Review.
-
DNA Damage Responses, the Trump Card of Stem Cells in the Survival Game.Adv Exp Med Biol. 2024;1470:165-188. doi: 10.1007/5584_2023_791. Adv Exp Med Biol. 2024. PMID: 37923882 Review.
-
Germ line genetic NBN variation and predisposition to B-cell acute lymphoblastic leukemia in children.Blood. 2024 May 30;143(22):2270-2283. doi: 10.1182/blood.2023023336. Blood. 2024. PMID: 38446568 Free PMC article. Clinical Trial.
-
Impaired p53-Mediated DNA Damage Response Contributes to Microcephaly in Nijmegen Breakage Syndrome Patient-Derived Cerebral Organoids.Cells. 2022 Feb 25;11(5):802. doi: 10.3390/cells11050802. Cells. 2022. PMID: 35269426 Free PMC article.
References
-
- Blackford AN, Jackson SP. ATM, ATR, and DNA‐PK: The Trinity at the Heart of the DNA Damage Response. Mol Cell. 2017;66(6):801‐817. - PubMed
MeSH terms
Substances
Grants and funding
- 2016YFA0100603/National Key Research and Development Program of China, Stem Cell and Translational Research
- 31770871/National Natural Science Foundation of China
- 81571380/National Natural Science Foundation of China
- LY16H080009/Natural Science Foundation of Zhejiang Province
- KF2020005/NHC Key Laboratory of Birth Defect for Research and Prevention (Hunan Provincial Maternal and Child Health Care Hospital, Changsha, China)
LinkOut - more resources
Full Text Sources
Other Literature Sources
Medical
Molecular Biology Databases
Research Materials
Miscellaneous
