. 2021 Feb 15;131(4):e143137.
doi: 10.1172/JCI143137.

Ovariectomy induces bone loss via microbial-dependent trafficking of intestinal TNF+ T cells and Th17 cells

Affiliations

Ovariectomy induces bone loss via microbial-dependent trafficking of intestinal TNF+ T cells and Th17 cells

Mingcan Yu et al. J Clin Invest. .

Abstract

Estrogen deficiency causes a gut microbiome-dependent expansion of BM Th17 cells and TNF-α-producing T cells. The resulting increased BM levels of IL-17a (IL-17) and TNF stimulate RANKL expression and activity, causing bone loss. However, the origin of BM Th17 cells and TNF+ T cells is unknown. Here, we show that ovariectomy (ovx) expanded intestinal Th17 cells and TNF+ T cells, increased their S1P receptor 1-mediated (S1PR1-mediated) egress from the intestine, and enhanced their subsequent influx into the BM through CXCR3- and CCL20-mediated mechanisms. Demonstrating the functional relevance of T cell trafficking, blockade of Th17 cell and TNF+ T cell egress from the gut or their influx into the BM prevented ovx-induced bone loss. Therefore, intestinal T cells are a proximal target of sex steroid deficiency relevant for bone loss. Blockade of intestinal T cell migration may represent a therapeutic strategy for the treatment of postmenopausal bone loss.

Keywords: Bone Biology; Bone disease; Bone marrow; T cells.


Conflict of interest statement

Conflict of interest: The authors have declared that no conflict of interest exists.

Figures

Figure 1
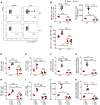
Figure 1. Ovx increases the trafficking of T cells from the gut to the BM.
(A) Image of the intestine of Kaede mice before and after ex vivo photoconversion of the dissected organ by exposure to a 390 nm wavelength light for 2 minutes. (B) Representative flow cytometric analysis of T cells harvested from photoactivated (PA) PPs and BM of Kaede mice subjected or not subjected to in vivo photoconversion. Plots show the relative frequency of KaedeR total T cells, TNF+ T cells, and Th17 cells. Ten-week-old female SFB+ Kaede mice were subjected to surgical laparotomy to access the PPs in the distal SI. PP cells were photoconverted by exposing them to a 390 nm light for 2 minutes. Mice were sacrificed immediately after the photoconversion. (CE) Relative frequency of KaedeR total T cells, TNF+ T cells, and Th17 cells in PPs from sham-operated mice and mice that had undergone ovx 24 hours and 48 hours after photoconversion. (F and G) Relative and absolute frequency of KaedeR total T cells in the BM of sham-operated mice and mice that had undergone ovx 24 hours and 48 hours after photoconversion. (H and I) Relative and absolute frequency of KaedeR total TNF+ T cells in the BM of sham-operated mice and mice that had undergone ovx 24 hours and 48 hours after photoconversion. (J and K) Relative and absolute frequency of KaedeR total Th17 cells in the BM of sham-operated mice and mice that had undergone ovx 24 hours and 48 hours after photoconversion. For panels CK, 10-week-old Kaede mice were subjected to either ovx or sham surgery. After 2 weeks, mice underwent surgical laparotomy and PP cells were photoconverted. Mice were sacrificed 24 or 48 hours later and the number of KaedeR T cells in PPs and BM measured by flow cytometry. n = 6–14 mice per group. Data are expressed as mean ± SEM. All data were normally distributed according to the Shapiro-Wilk normality test and analyzed by 2-way ANOVA and post hoc tests applying Bonferroni’s correction for multiple comparisons. *P < 0.05; **P < 0.01; ***P < 0.001; ****P< 0.0001, compared with the indicated group.
Figure 2
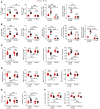
Figure 2. Ovx increases the trophism of BM Th17 cells for the BM via a TNF-dependent mechanism.
(A) Representative flow cytometry plot and frequency of EGFP+ Th17 cells in the BM of WT and Tnf–/– sham-operated mice and mice that had undergone ovx. (B) Relative and absolute frequency of EGFP+ Th17 cells in the BM of WT and Tnf–/– mice subjected to sham surgery or ovx 2 weeks before adoptive transfer of IL-17A-EGFP+ cells. (C) BM CD4+ T cell EGFP MFI. In these experiments, EGFP+CD4+ Th17 cells were injected i.v. into WT and Tnf–/– mice that had been subjected to sham operation or ovx 14 days before the T cell transfer. Twenty-four hours after transfer, EGFP+CD4+ T cells (EGFP+ Th17 cells) were enumerated by flow cytometry in BM of recipient mice. (D) Relative frequency of BM Vβ14+ Th17 cells in WT and Tnf–/– mice. (E and F) Relative and absolute frequency of BM of total Th17 cells in WT and Tnf–/– mice. (G) BM Ccl20 transcript levels in Tnf–/– mice. (H) Relative frequency of BM Vβ14+ Th17 cells in Tcrβ–/– mice reconstituted with WT T cells or Tnf–/– T cells. (I and J) Relative and absolute frequency of BM of total Th17 cells in Tcrβ–/– mice reconstituted with WT T cells or Tnf–/– T cells. (K) BM Ccl20 transcript levels in Tcrβ–/– mice reconstituted with WT T cells or Tnf–/– T cells. n = 5–6 mice per group. Data are expressed as mean ± SEM. All data were normally distributed according to the Shapiro-Wilk normality test and analyzed by 2-way ANOVA and post hoc tests applying Bonferroni’s correction for multiple comparisons. *P < 0.05; **P < 0.01; ***P < 0.001; ****P < 0.0001, compared with the indicated group.
Figure 3
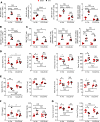
Figure 3. Blockade of T cell egress from the intestine prevents the expansion of TNF+ T cells and Th17 cells and bone loss induced by ovx.
(A) Effects of ovx on the number of PP and BM TNF+ T cells and on the level of Tnf transcripts in mice treated with FTY720. (B) Effects of ovx on the number of PP and BM Th17 cells and on the level of Il17a transcripts in mice treated with FTY720. (C) Effects of ovx on BV/TV, Tb.Th, Tb.N, and Tb.Sp in mice treated with FTY720. (D) Effects of ovx on spinal BV/TV, Tb.Th, Tb.N, and Tb.Sp in mice treated with FTY720. (E) Effects of ovx on serum CTX levels and serum osteocalcin levels in mice treated with FTY720. (F) Effects of ovx on femoral Ct.Ar and Ct.Th in mice treated with FTY720. n = 10 mice per group. Data are expressed as mean ± SEM. All data were normally distributed according to the Shapiro-Wilk normality test and analyzed by 2-way ANOVA and post hoc tests applying Bonferroni’s correction for multiple comparisons. *P < 0.05; **P < 0.01; ***P < 0.001; ****P < 0.0001, compared with the indicated group.
Figure 4
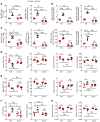
Figure 4. Blockade of Th17 cell influx into BM by treatment with anti-CCL20 Ab prevents expansion of Th17 cells and bone loss induced by ovx.
(A) Effects of ovx on the frequency of BM Th17 cells and Vβ14+ Th17 cells and on the level of Il17a transcripts. (B) Effects of ovx on the frequency of BM TNF+IL-17+ T cells. (C) Effects of ovx on the number of BM TNF+ T cells and on the level of Tnf transcripts. (D) Effects of ovx on femoral BV/TV, Tb.Th, Tb.N, and Tb.Sp. (E) Effects of ovx on spinal BV/TV, Tb.Th, Tb.N, and Tb.Sp. (F) Effects of ovx on serum CTX levels and serum osteocalcin levels. (G) Effects of ovx on femoral Ct.Ar and Ct.Th. Mice were treated with anti-CCL20 Ab or irrelevant (Irr.) Ab. n = 5 mice per group. Data are expressed as mean ± SEM. All data were normally distributed according to the Shapiro-Wilk normality test and analyzed by 2-way ANOVA and post hoc tests applying Bonferroni’s correction for multiple comparisons. *P < 0.05; **P < 0.01; ***P < 0.001; ****P < 0.0001, compared with the indicated group.
Figure 5
Figure 5. Blockade of T cell influx into BM by silencing of CXCR3 prevents expansion of TNF+ T cells and Th17 cells and bone loss induced by ovx.
(A) Effects of ovx on the number of BM TNF+ T cells and on the level of Tnf transcripts in WT mice and Cxcr3–/– mice. (B) Effects of ovx on the BM cell transcript levels of Ccl20 in WT mice and Cxcr3–/– mice. (C) Effects of ovx on the number of BM Th17 cells and on the levels of Il17a transcripts in WT mice and Cxcr3–/– mice. (D) Effects of ovx on femoral BV/TV, Tb.Th, Tb.N, and Tb.Sp in WT mice and Cxcr3–/– mice. (E) Effects of ovx on spinal BV/TV, Tb.Th, Tb.N, and Tb.Sp in WT mice and Cxcr3–/– mice. (F) Effects of ovx on serum CTX levels and serum osteocalcin levels in WT mice and Cxcr3–/– mice. (G) Effects of ovx on femoral Ct.Ar and Ct.Th in WT mice and Cxcr3–/– mice. n = 5 mice per group. Data are expressed as mean ± SEM. All data were normally distributed according to the Shapiro-Wilk normality test and analyzed by 2-way ANOVA and post hoc tests applying Bonferroni’s correction for multiple comparisons. *P < 0.05; **P < 0.01; ***P < 0.001; ****P < 0.0001, compared with the indicated group.

Comment in

References

    1. Khosla S, Pacifici R. In: Marcus R, Feldman D, Dempster DW, Luckey M, Cauley JA eds. Osteoporosis. Amsterdam: Elsvierer; 2013:1113–1138.
    1. Weitzmann MN, Pacifici R. Estrogen deficiency and bone loss: an inflammatory tale. J Clin Invest. 2006;116(5):1186–1194. doi: 10.1172/JCI28550. - DOI - PMC - PubMed
    1. Nakamura T, et al. Estrogen prevents bone loss via estrogen receptor alpha and induction of Fas ligand in osteoclasts. Cell. 2007;130(5):811–823. doi: 10.1016/j.cell.2007.07.025. - DOI - PubMed
    1. Krum SA, et al. Estrogen protects bone by inducing Fas ligand in osteoblasts to regulate osteoclast survival. EMBO J. 2008;27(3):535–545. doi: 10.1038/sj.emboj.7601984. - DOI - PMC - PubMed
    1. Pacifici R. Role of T cells in ovariectomy induced bone loss-revisited. J Bone Miner Res. 2012;27(2):231–239. doi: 10.1002/jbmr.1500. - DOI - PubMed

Publication types