. 2021 Feb 15;131(4):e135197.
doi: 10.1172/JCI135197.

TREM2 sustains macrophage-hepatocyte metabolic coordination in nonalcoholic fatty liver disease and sepsis

Affiliations

TREM2 sustains macrophage-hepatocyte metabolic coordination in nonalcoholic fatty liver disease and sepsis

Jinchao Hou et al. J Clin Invest. .

Abstract

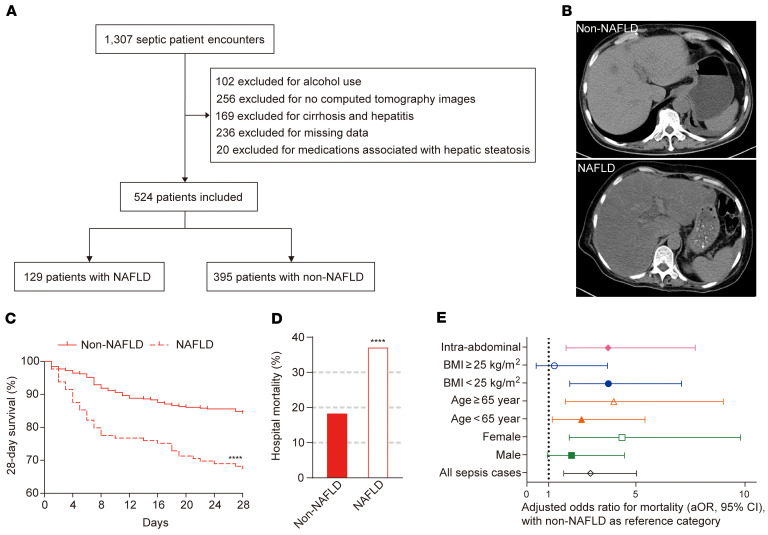
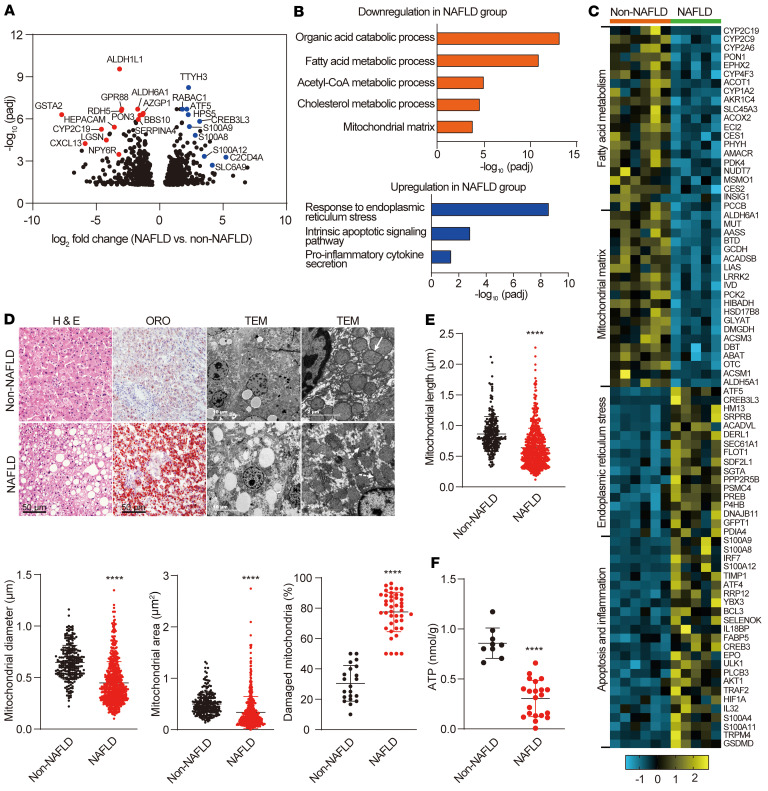
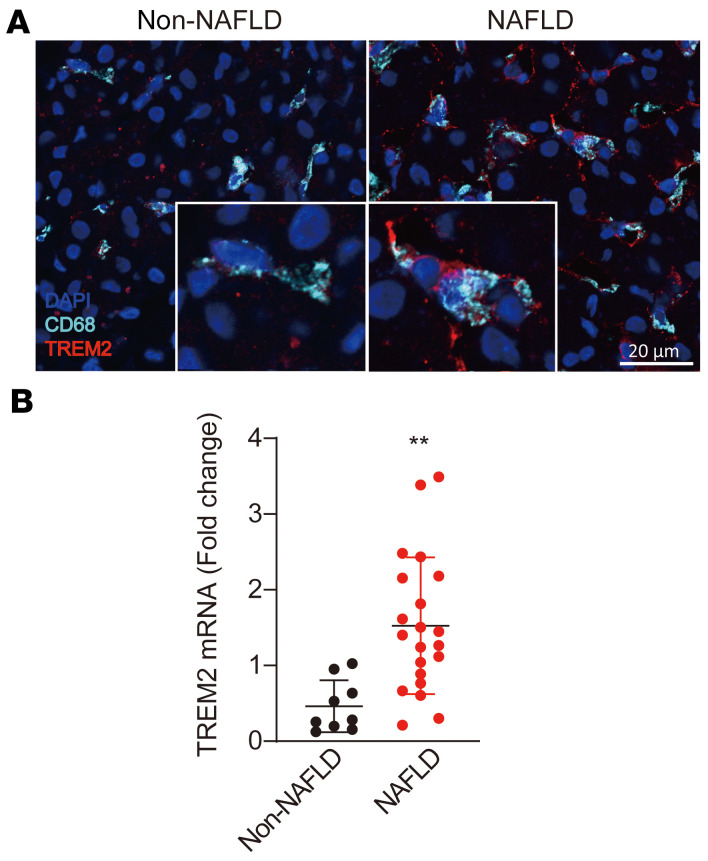
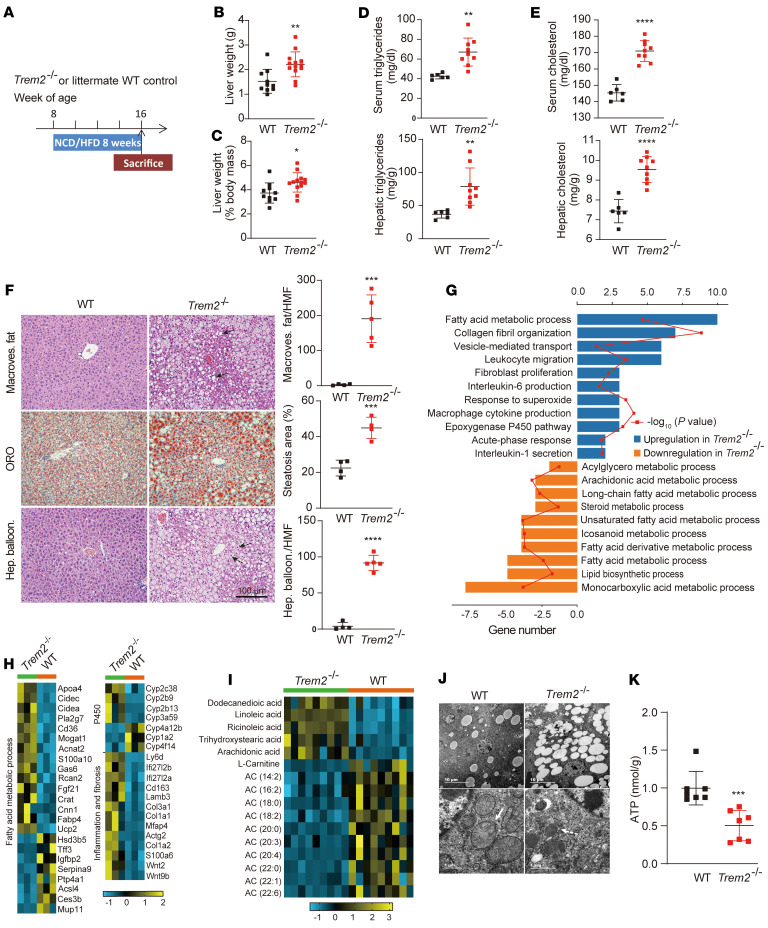
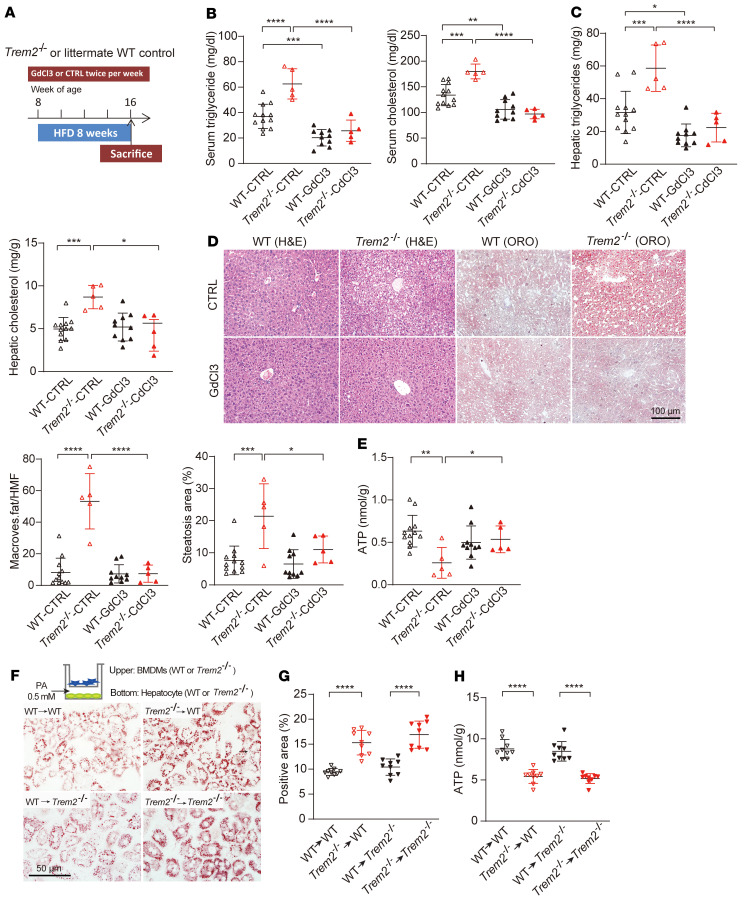
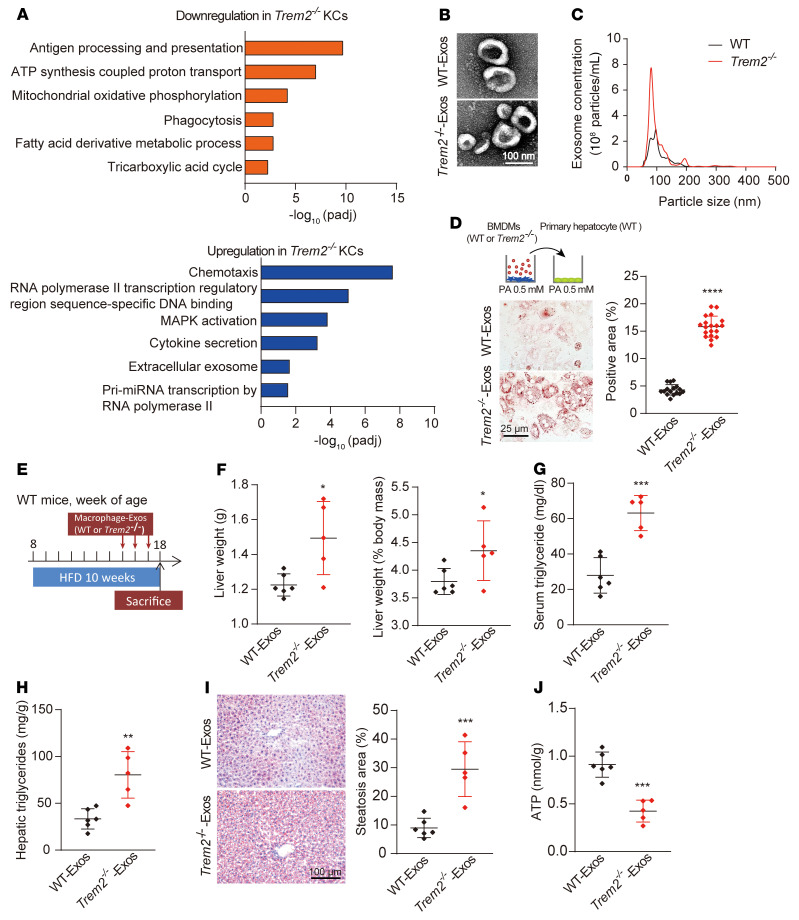
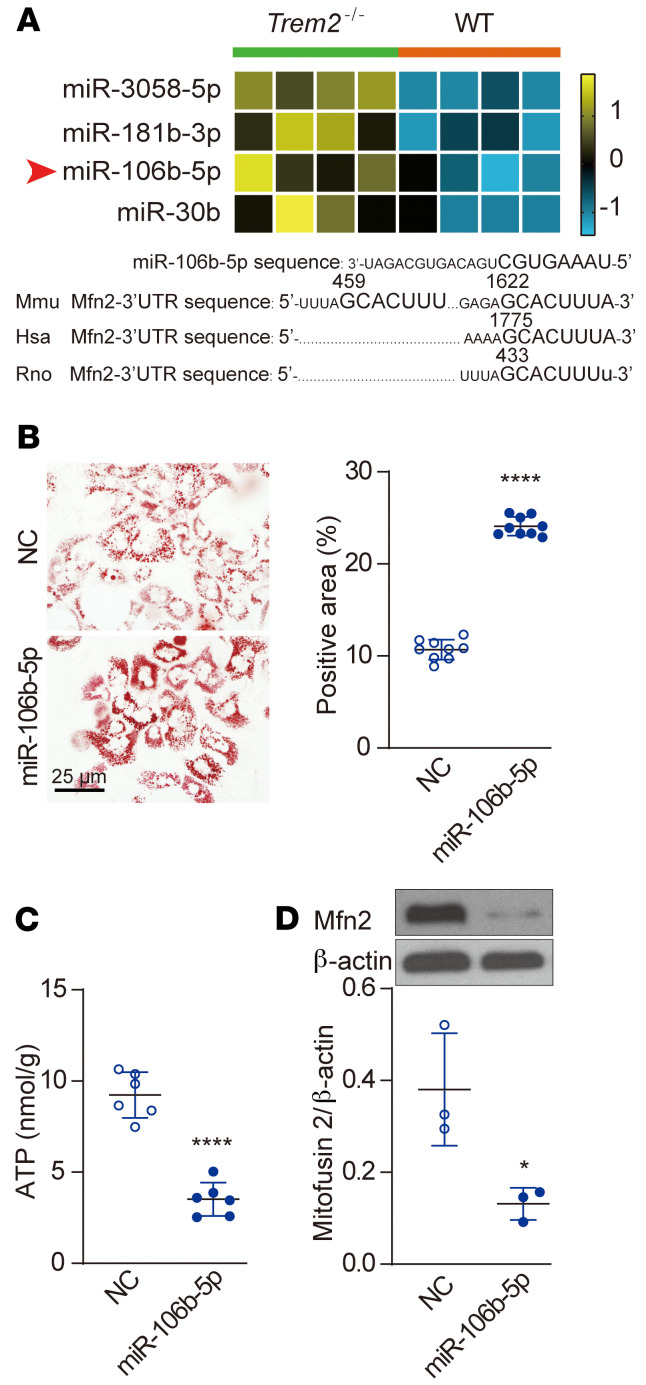
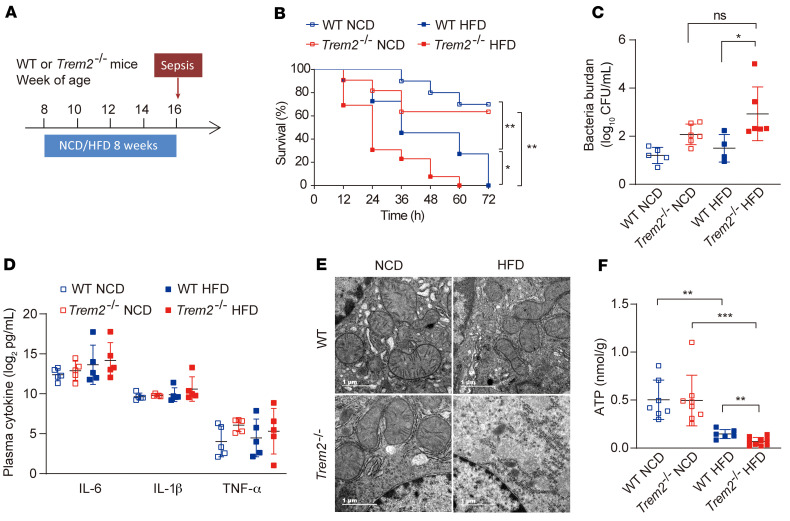
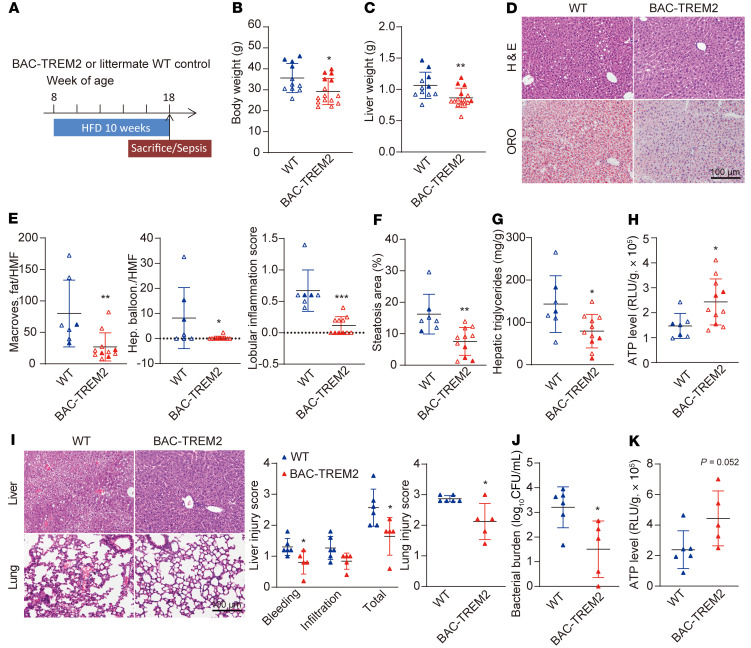
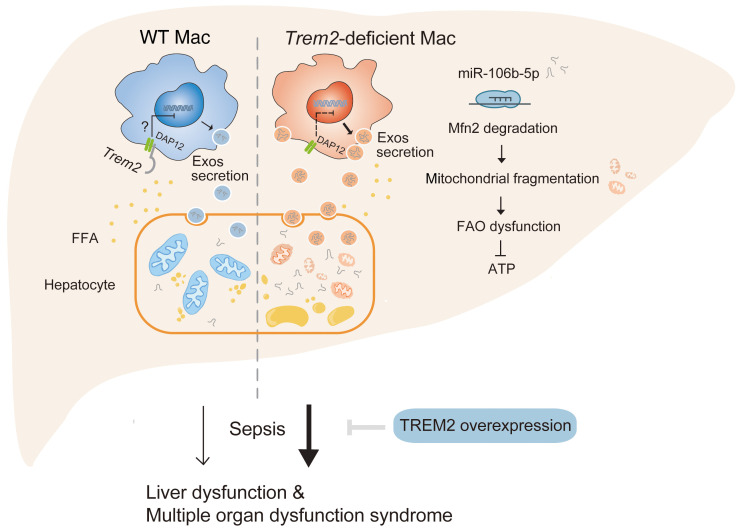
Sepsis is a leading cause of death in critical illness, and its pathophysiology varies depending on preexisting medical conditions. Here we identified nonalcoholic fatty liver disease (NAFLD) as an independent risk factor for sepsis in a large clinical cohort and showed a link between mortality in NAFLD-associated sepsis and hepatic mitochondrial and energetic metabolism dysfunction. Using in vivo and in vitro models of liver lipid overload, we discovered a metabolic coordination between hepatocyte mitochondria and liver macrophages that express triggering receptor expressed on myeloid cells-2 (TREM2). Trem2-deficient macrophages released exosomes that impaired hepatocytic mitochondrial structure and energy supply because of their high content of miR-106b-5p, which blocks Mitofusin 2 (Mfn2). In a mouse model of NAFLD-associated sepsis, TREM2 deficiency accelerated the initial progression of NAFLD and subsequent susceptibility to sepsis. Conversely, overexpression of TREM2 in liver macrophages improved hepatic energy supply and sepsis outcome. This study demonstrates that NAFLD is a risk factor for sepsis, providing a basis for precision treatment, and identifies hepatocyte-macrophage metabolic coordination and TREM2 as potential targets for future clinical trials.

Keywords: Fatty acid oxidation; Hepatology; Macrophages; Metabolism; Mitochondria.


Conflict of interest statement

Conflict of interest: MC received research support from Alector, Amgen, Ono, and Pfizer. He is a scientific advisory board member for Vigil, Cell Signaling Technologies, and NGMBio, and has a patent pending for TREM2 (“Compositions and methods for reducing resistance to or enhancing immunotherapy,” no. 62/981,827).

Figures

Figure 1
Figure 1. NAFLD is an independent risk factor for hospital mortality in critically ill patients with sepsis.
(A) Study flow diagram for identification of septic patients with or without NAFLD. n = 395 in non-NAFLD group, n = 129 in NAFLD group. (B) Representative CT scan illustrating measurement of patients with NAFLD or not. (C and D) Kaplan-Meier survival curves (28-day) (C) and hospital mortality (D) across NAFLD category. Significant difference compared with the non-NAFLD control was determined. n = 395 in non-NAFLD group, n = 129 in NAFLD group. (E) Adjusted hospital mortality according to age, sex, BMI, and site of infection. The values shown are the adjusted odds ratio (aOR, 95% confidence interval). All sepsis cases: aOR = 2.918 (1.693–5.031, P < 0.001); male: aOR = 2.048 (0.937–4.476, P = 0.072); female: aOR = 4.366 (1.945–9.798, P < 0.001); age <65: aOR = 2.510 (1.163–5.414, P = 0.019); Age ≥65: aOR = 3.988 (1.766–9.006, P = 0.001); BMI <25: aOR = 3.738 (1.969–7.093, P < 0.001); BMI ≥25: aOR = 1.261 (0.431–3.696, P = 0.672); intra-abdominal: aOR = 3.725 (1.797–7.721, P < 0.001). The data were analyzed by log-rank test (C), or Fisher’s exact test (D), or multivariate logistic regression (E). ****P < 0.0001.
Figure 2
Figure 2. NAFLD patients exhibit liver mitochondria dysfunction.
(A) Volcano plot showing significant DEGs (red, downregulated genes; blue, upregulated genes, Padj < 0.05) in NAFLD versus non-NAFLD livers. n = 6 in non-NAFLD group; n =5 in NAFLD group. (B) GO analysis of the identified DEGs between non-NAFLD and NAFLD livers. Orange (top panel) and blue (bottom panel) indicate downregulated and upregulated GO biological processes or cellular component in NAFLD livers, respectively. (C) Heatmap showing the expression pattern of the identified DEGs that were found to be involved in fatty acid metabolism, mitochondrial matrix, endoplasmic reticulum stress, apoptosis, and inflammation. The color key indicates the expression levels. (D) Representative images of H&E-stained and ORO-stained liver sections and TEM images from non-NAFLD and NAFLD livers. H&E-stained and ORO-stained liver sections: n = 9 in non-NAFLD group; n = 21 in NAFLD group. TEM images: n = 7 in non-NAFLD group; n = 14 in NAFLD group. Solid and dashed white arrows refer to complete and fragmented mitochondria, respectively. Scale bars: 50 μm, 10 μm, and 2 μm. (E) Quantification of mitochondrial parameters from liver electron microscopy images from NAFLD and non-NAFLD patients. n = 601 mitochondria from 14 NAFLD patients or 238 mitochondria from 7 controls (3 fields/patient). (F) ATP levels in livers from non-NAFLD and NAFLD patients. n = 9 for non-NAFLD patients; n = 21 for NAFLD patients. All data are shown as the mean ± SD. Significance was determined by an unpaired, 2-tailed Student’s t test. ****P < 0.0001.
Figure 3
Figure 3. TREM2+ macrophages are characteristic of livers from NAFLD patients.
(A) Confocal images of liver sections from non-NAFLD and NAFLD donors show CD68 (cyan), TREM2 (red) and DAPI staining. Individual CD68+ TREM2+ macrophages are depicted at a higher magnification in the inserts. Confocal images at ×40 were taken with a Nikon A1 inverted fluorescent microscope. n = 6 in non-NAFLD group; n = 7 in NAFLD group. Scale bar: 20 μm. (B) qPCR analysis for liver TREM2 expression normalized to β-actin mRNA levels. n = 9 in non-NAFLD group; n = 21 in NAFLD group. All data are shown as the mean ± SD. Significance was determined by an unpaired, 2-tailed Student’s t test. **P < 0.01.
Figure 4
Figure 4. Trem2 deficiency exacerbates hepatocyte mitochondrial dysfunction and accelerates NAFLD progression in a mouse model.
(A) Experimental design used to evaluate the role of Trem2 in NAFLD progression. Liver weights (B) and liver weight/body weight ratios (C) of WT and Trem2–/– mice after being fed HFD for 8 weeks. n = 10 in WT group; n = 13 in Trem2–/– group. Levels of TG (D) and cholesterol (E) in serum and livers from mice after being fed HFD for 8 weeks. n = 6 in WT group; n = 9 in Trem2–/– group. (F) Representative images of H&E- and ORO-stained liver sections. n = 4 in WT group; n = 4-5 in Trem2–/– group. Solid and dashed black arrows indicate hepatocytes with macrovesicular fat (Macroves. fat) or hepatocyte ballooning (Hep. balloon.), respectively. Number of hepatocytes with Macroves. fat or Hep. balloon. and percentage of ORO-positive area per high magnification field (HMF) was determined by ImageJ from 6 fields per section. Scale bar: 100 μm. (G) GO analysis of the identified DEGs between WT and Trem2–/– groups (n = 3 per group). (H) Heatmap showing the expression pattern of the identified DEGs (n = 3 per group). The color key indicates the expression levels. (I) Heatmap displays the upregulated and downregulated lipid species in livers (n = 9 mice per group), P < 0.05. The color key indicates the lipid levels. (J) Representative TEM images of mouse hepatocytes (upper) and hepatocellular mitochondria (bottom). n = 4 in WT group; n = 5 in Trem2–/– group. Solid and dashed white arrows refer to complete and fragmented mitochondria, respectively. Scale bars: 10 μm and 1 μm, respectively. (K) ATP levels in WT and Trem2–/– livers. n = 7 per group. All data are shown as the mean ± SD. The data were analyzed by an unpaired, 2-tailed Student’s t test. *P < 0.05, **P < 0.01, ***P < 0.001, ****P < 0.0001.
Figure 5
Figure 5. Macrophage Trem2 deficiency exacerbates hepatocyte lipid accumulation both in vivo and in vitro.
(A) Schematic representation of the timing strategy used to evaluate the role of KCs in NAFLD progression. n = 12 in WT CTRL group; n =5 in Trem2–/– CTRL group; n =10 in WT GdCl3 group; n =5 in Trem2–/– GdCl3 group. (B and C) Serum and liver triglyceride or cholesterol levels in response to KCs depletion. (D) Representative images of H&E- and ORO-stained liver sections. H&E reveals tissue composition and macrovesicular fat, and ORO visualizes lipid droplets. Number of hepatocytes with macrovesicular fat and percentage of ORO-positive area per HMF was determined by ImageJ from 6 fields per section. Scale bar: 100 μm. (E) ATP contents in the liver. (F and G) Representative image of ORO-stained hepatocytes after coculture with BMDMs (F). BMDMs from WT or Trem2–/– mice were cocultured with primary hepatocytes isolated from WT or Trem2–/– mice in transwell plates. Cultures were added with PA (0.5 mM) for 24 hours in serum-free conditions. Lipid accumulation in hepatocytes was determined by quantification of ORO-positive area as a percentage of whole image area by ImageJ (G). n = 9 per group. Scale bar: 50 μm. (H) ATP content in hepatocytes was quantified by luciferase assay. n = 9 per group. The data were analyzed by 1-way analysis of variance with Bonferroni corrections for multiple comparisons. All data are shown as the mean ± SD. *P < 0.05, **P < 0.01, ***P < 0.001, ****P < 0.0001.
Figure 6
Figure 6. Trem2 deletion changes macrophage-Exos numbers and contents.
(A) GO analysis of DEGs in KCs from WT or Trem2–/– mice fed HFD for 8 weeks. n = 3 per group. (B) Representative TEM images of Exos from WT and Trem2–/– BMDMs incubated with PA (0.5 mM) for 12 hours. Scale bar: 100 nm. (C) Representative results of nanoparticle tracking analysis demonstrate size distribution of Exos derived from WT and Trem2–/– BMDMs. n = 5 per group. (D) WT primary hepatocytes were incubated with WT or Trem2–/– BMDM-derived Exos (20 μg/mL) and PA (0.5 mM) for 12 hours. Lipid accumulation in hepatocytes was determined by quantification of ORO-positive area as a percentage of whole image area by ImageJ. n = 16 in WT group; n = 19 in Trem2–/– group. Scale bar: 25 μm. (E) Experimental design used to evaluate BMDM-Exos in NAFLD progression. n = 6 in WT-Exos group; n = 5 in Trem2–/–-Exos group. (F) Liver weights and liver weight/body weight ratios of mice with Exos treatment. (G and H) Serum and liver triglyceride levels in response to Exos treatment. (I) Representative images of ORO-stained liver sections from mice treated with Exos from WT or Trem2–/– BMDMs. Scale bar: 100 μm. Percentage of ORO-positive area per HMF were determined by ImageJ from 6 fields per section. (J) ATP content in hepatocytes was quantified by luciferase assay. Data are presented as the mean ± SD. The data were analyzed by an unpaired, 2-tailed Student’s t test. *P < 0.05, **P < 0.01, ***P < 0.001, ****P < 0.0001.
Figure 7
Figure 7. Trem2 deletion impacts macrophage-Exos miRNA profiles.
(A) Heatmap of small RNA transcripts in WT and Trem2–/– KCs after 8-week HFD and sequence alignment of miR-106b-5p with 3′ UTRs of mouse (Mmu), human (Hsa), and rat (Rno) Mfn2. n = 4 for each group. The color key indicates the expression levels. (B and C) WT BMDMs were transfected with either NC or miR-106b-5p mimic and then cocultured with primary WT hepatocytes in a transwell plate for 12 hours with 0.5 mM PA stimulation. Lipid accumulation in hepatocytes was determined by quantification of ORO-positive area as a percentage of whole image area by ImageJ (B), n = 9 per group. Scale bar: 25 μm. ATP content in hepatocytes was quantified by luciferase assay (C), n = 6 per group. (D) Representative Western blot images of Mfn2 expression in BNL CL.2 cells, which were transfected with either NC or miR-106b-5p mimic and then stimulated with 0.5 mM PA for 6 hours. The integrated density of the blots was analyzed by ImageJ. n = 3 per group. Data are presented as the mean ± SD. Data were analyzed by an unpaired, 2-tailed Student’s t test. *P < 0.05, ****P < 0.0001.
Figure 8
Figure 8. Trem2 deficiency increases susceptibility to NAFLD-associated sepsis.
(A) Experimental design used to set up NAFLD and sepsis. (B) WT and Trem2–/– mice fed NCD or HFD for 8 weeks were subjected to lethal CLP with an 18-gauge needle, and mice survival was monitored every 12 hours. n = 10 for NCD WT mice; n = 11 for NCD Trem2–/– mice; n = 11 for HFD WT mice; n = 13 for HFD Trem2–/– mice. (C) Blood bacterial burden at 24 hours post-CLP. n = 5 for NCD WT mice; n = 6 for NCD Trem2–/– mice; n = 4 for HFD WT mice; n = 6 for HFD Trem2–/– mice. (D) Plasma cytokine markers were quantified 24 hours after CLP. n = 5 per group. (E) Representative TEM images of mouse hepatocellular mitochondria obtained from WT or Trem2–/– mice livers 24 hours after CLP. n = 2–6 for each group. Scale bar: 1 μm. (F) Levels of ATP contents in livers from WT or Trem2–/– mice at 24 hours after CLP. n = 7 in WT NCD group; n = 8 in Trem2–/– NCD group; n = 6 in WT HFD group; n = 9 in Trem2–/– HFD group. Data are presented as the mean ± SD. Data were analyzed by 1-way analysis of variance with Bonferroni corrections for multiple comparisons (C, D, and F). The survival rates were analyzed by log-rank test (B). *P < 0.05, **P < 0.01, ***P < 0.001.
Figure 9
Figure 9. Increase in TREM2 gene dosage reduces steatohepatitis and sepsis-induced liver injury.
(A) Experimental design used to evaluate the role of elevated TREM2 gene dosage in NAFLD progression and sepsis. (B and C) Body weight (B) and liver weight (C) of BAC-TREM2 and littermate WT control mice after a 10-week HFD. n = 11 in WT group; n = 15 in BAC-TREM2 group. Filled and open symbols refer to male and female, respectively. (DF) Representative images of H&E-stained and ORO-stained liver sections (D). H&E revealed tissue composition, macrovesicular fat, hepatocyte ballooning, and lobular inflammation. ORO visualized lipid droplets. Number of hepatocytes with macrovesicular fat or hepatocyte ballooning, lobular inflammation score, and percentage of ORO-positive area per HMF was determined by ImageJ from 5 fields per section (E and F). n = 7 in WT group; n = 11 in BAC-TREM2 group. Scale bar: 100 μm. (G and H) Levels of hepatic triglyceride (G) and ATP (H) from BAC-TREM2 and littermate WT mice after a 10-week HFD. n = 7 in WT group; n = 11 in BAC-TREM2 group. (I and J) Organ injury and bacteria burden at 24 hours after CLP. Male BAC-TREM2 and WT mice were fed with HFD for 10 weeks. After dietary intervention, mild polymicrobial sepsis was induced by CLP (24-gauge needle). At 24 hours after CLP, livers, lungs, and blood were collected for H&E staining (I) and bacterial burden test (J), respectively. n = 6 in WT group; n = 5 in BAC-TREM2 group. Scale bar: 100 μm. (K) Hepatic ATP levels were quantified by luciferase assay. n = 6 in WT group; n = 5 in BAC-TREM2 group. Data are represented as the mean ± SD. Significance was determined by an unpaired, 2-tailed Student’s t test. *P < 0.05, **P < 0.01, ***P < 0.001.
Figure 10
Figure 10. Schematic illustration of a mechanism through which macrophage TREM2 protects against NAFLD associated sepsis.
Under a free fatty acid–enriched (FFA-enriched) environment, macrophage TREM2 restrains the release of exosomes containing miR-106b-5p that targets to Mfn2 and leads to mitochondrial fragmentation in liver cells. The severely impaired energy supply in the Trem2–/– liver enhances susceptibility to sepsis. Strategies that target macrophage TREM2 may be an effective way to suppress steatohepatitis and relieve sepsis-induced liver dysfunction and multiple organ dysfunction syndrome.

References

    1. Singer M, et al. The third international consensus definitions for sepsis and septic shock (Sepsis-3) JAMA. 2016;315(8):801–810. doi: 10.1001/jama.2016.0287. - DOI - PMC - PubMed
    1. Iskander KN, et al. Sepsis: multiple abnormalities, heterogeneous responses, and evolving understanding. Physiol Rev. 2013;93(3):1247–1288. doi: 10.1152/physrev.00037.2012. - DOI - PMC - PubMed
    1. Cecconi M, et al. Sepsis and septic shock. The Lancet. 2018;392(10141):75–87. doi: 10.1016/S0140-6736(18)30696-2. - DOI - PubMed
    1. Musso G, et al. Non-alcoholic steatohepatitis: emerging molecular targets and therapeutic strategies. Nat Rev Drug Discov. 2016;15(4):249–274. doi: 10.1038/nrd.2015.3. - DOI - PubMed
    1. Leslie M. The liver’s weighty problem. Science. 2015;349(6243):18–20. doi: 10.1126/science.349.6243.18. - DOI - PubMed

Publication types

MeSH terms