. 2021 Feb 15;131(4):e135296.
doi: 10.1172/JCI135296.

Endothelium-derived semaphorin 3G attenuates ischemic retinopathy by coordinating β-catenin-dependent vascular remodeling

Affiliations

Endothelium-derived semaphorin 3G attenuates ischemic retinopathy by coordinating β-catenin-dependent vascular remodeling

Dan-Yang Chen et al. J Clin Invest. .

Abstract

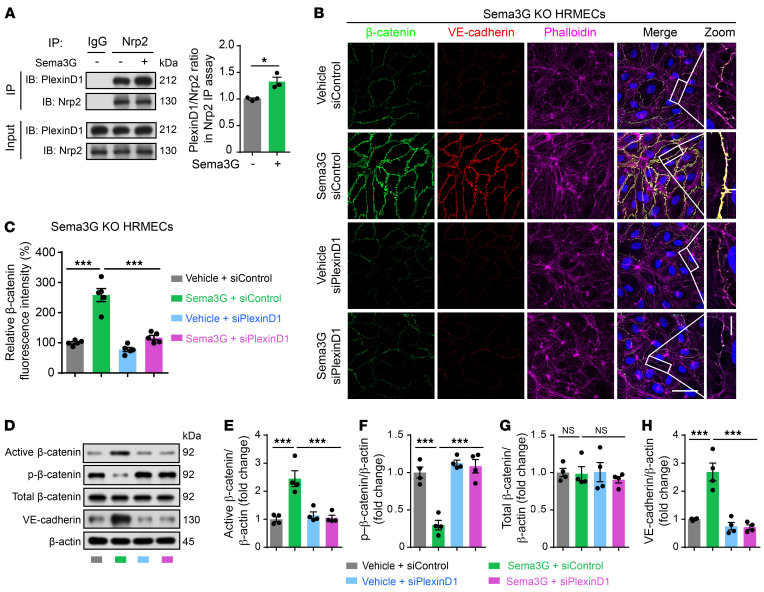
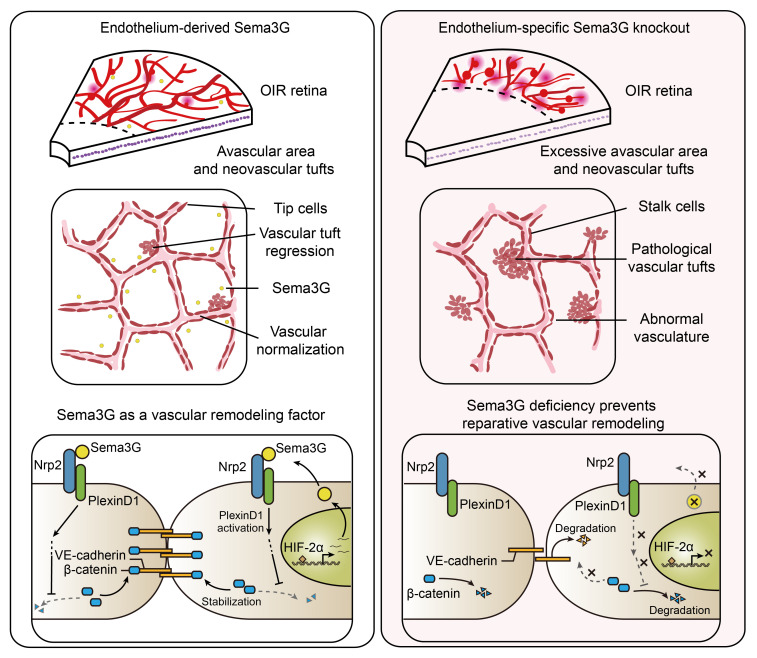
Abnormal angiogenesis and regression of the diseased retinal vasculature are key processes associated with ischemic retinopathies, but the underlying mechanisms that regulate vascular remodeling remain poorly understood. Here, we confirmed the specific expression of semaphorin 3G (Sema3G) in retinal endothelial cells (ECs), which was required for vascular remodeling and the amelioration of ischemic retinopathy. We found that Sema3G was elevated in the vitreous fluid of patients with proliferative diabetic retinopathy (PDR) and in the neovascularization regression phase of oxygen-induced retinopathy (OIR). Endothelial-specific Sema3G knockout mice exhibited decreased vessel density and excessive matrix deposition in the retinal vasculature. Moreover, loss of Sema3G aggravated pathological angiogenesis in mice with OIR. Mechanistically, we demonstrated that HIF-2α directly regulated Sema3G transcription in ECs under hypoxia. Sema3G coordinated the functional interaction between β-catenin and VE-cadherin by increasing β-catenin stability in the endothelium through the neuropilin-2 (Nrp2)/PlexinD1 receptor. Furthermore, Sema3G supplementation enhanced healthy vascular network formation and promoted diseased vasculature regression during blood vessel remodeling. Overall, we deciphered the endothelium-derived Sema3G-dependent events involved in modulating physiological vascular remodeling and regression of pathological blood vessels for reparative vascular regeneration. Our findings shed light on the protective effect of Sema3G in ischemic retinopathies.

Trial registration: ClinicalTrials.gov NCT03506750.

Keywords: Endothelial cells; Retinopathy; Vascular Biology.


Conflict of interest statement

Conflict of interest: The authors have declared that no conflict of interest exists.

Figures

Figure 1
Figure 1. Sema3G is elevated in the retinas of mice in the OIR model.
(A) Schematic illustration of the mouse oxygen-induced retinopathy (OIR) model. (B) RT-qPCR analysis of Sema3s mRNA in normoxic or OIR retinas at P17 and P19. Data were normalized to gene mRNA expression upon normoxia (n = 3–5 mice). (C) The evolutionary relationship of Sema3s among human or mouse species. (D) RT-qPCR analysis of Sema3G and Vegfa mRNA in the retina at the times indicated. Data were normalized to gene mRNA expression upon normoxia (n = 3–4 mice for each group). (E and F) Localization and quantification of Sema3G mRNA in whole-mount retinas upon normoxia and OIR at P19 (n = 5 mice for each group). Error bars represent mean ± SEM, *P < 0.05; **P < 0.01; 2-tailed Student’s t tests. Scale bar: 50 μm (E). NV, neovascularization.
Figure 2
Figure 2. Sema3G is elevated in the vitreous of patients suffering from PDR.
(A) Angiography and SD-OCT were obtained from patients. Nonvascular ocular pathologies patients served as controls. Scale bars: 2000 μm (top), 500 μm (center). (B) ELISA assessment of vitreous fluid shows induction in Sema3G, IL-8, and VEGFA. The results are expressed as the absolute concentrations compared with control patients (n = 10 samples). (C and D) Immunoblot analysis and quantification of Sema3G protein levels in equal volumes of vitreous fluid from patients (n = 3 samples for each group). (E and F) Immunoblot analysis and quantification of Sema3G protein levels in equal volumes of aqueous humor from patients with PDR without DME, PDR with DME, and DME only (n = 3 samples for each group). Nondiabetic patients undergoing cataract surgery served as controls. (G) RNA in situ hybridization for Sema3G mRNA and immunofluorescence for lectin (an EC marker) in fibrovascular membranes (FVMs) of patients suffering from PDR. Error bars represent mean ± SEM, *P < 0.05; **P < 0.01; 2-tailed Student’s t tests (B and D), 1-way ANOVA with Tukey’s multiple comparisons test (F). Scale bar: 50 μm (G).
Figure 3
Figure 3. Sema3G is expressed exclusively in ECs in the mouse retina.
(A) Schematic illustration of retinal preparations for RT-qPCR and RNA in situ hybridization. (B) Sema3G mRNA expression in the retina at different time points after birth (n = 3–5 mice). (C) Representative images of RNA in situ hybridization for Sema3G mRNA on retinal sections at P6, P10, P14, and P20 of WT mice. Sema3G is expressed by blood vessels in the superficial, intermediate, and deep layers (white arrowheads). (D) Representative images of double fluorescence RNA in situ hybridization for Sema3G mRNA (red) and CD31 mRNA (green) in combination with immunofluorescence for lectin in P20 WT retinas. (E) Schematic illustration of the structure of retinal layers and the distribution of vessels in retinal sections. (F) Immunoblot analysis of Sema3G protein levels in lysates of primary human retinal microvascular ECs (HRMECs), mouse brain microvascular ECs (bEnd.3 cells), immortalized vascular ECs (EA.hy926), and primary human umbilical vein ECs (HUVECs). (G) Schematic illustration of the vascular network in flat-mounted retinas. (H) Representative images of RNA in situ hybridization for Sema3G mRNA and immunofluorescence for isolectin B4 (IB4) in whole-mounted retinas of WT mice at P20. Sema3G colocalizes with IB4 in microvessels (left panel) and large blood vessels (right panel). (I) Representative images of RNA in situ hybridization for Sema3G mRNA, in combination with immunofluorescence for Iba-1 (a microglial marker) and GFAP (an astroglial marker) in whole-mount retinas of WT mice at P20. Error bars represent mean ± SEM. **P < 0.01; ***P < 0.001; 2-tailed Student’s t tests. Scale bars: 100 μm (C and D) and 50 μm (H and I); magnified images: 50 μm (D). GCL, ganglion cell layer; NBL, neuroblast layer; IPL, inner plexiform layer; INL, inner nuclear layer; OPL, outer plexiform layer; ONL, outer nuclear layer.
Figure 4
Figure 4. Endothelial Sema3G deletion causes a hyperpruned vascular network in growing retinal vessels.
(A and B) Schematic illustration of the developmental stages during retinal angiogenesis and the quantitative indicators. (C) Confocal images showing one-quarter of P5 and P10 flat-mount retinas. Higher magnification images are displayed in the right panel. (D) Comparisons of percentage of vessel area and average vessel length of the blood vessels in retinas at P5 or P10 (n = 6 mice for each group). Error bars represent mean ± SEM. **P < 0.01; ***P < 0.001; 2-tailed Student’s t tests. Scale bars: 500 μm (C); magnified images: 100 μm (C).
Figure 5
Figure 5. Endothelial Sema3G contributes to the coordination of vascular remodeling.
(A) Representative images showing increased empty collagen IV–positive (green) but IB4-negative (magenta) matrix sleeves (yellow arrowheads) at the angiogenic front and in remodeling plexus of P6 Cdh5-Cre Sema3Gfl/fl mice. (B) Quantification of the ratio of IB4-positive vessels to collagen IV–positive vessels at the P6 angiogenic front (left, Sema3Gfl/fl, n = 7 mice; Cdh5-Cre Sema3Gfl/fl, n = 6 mice) and in remodeling plexus (right, n = 6 mice for each group). (C) Confocal images of anti–VE-cadherin–stained (green) and IB4-stained (red) (upper panel) or anti-desmin–stained (green) and IB4-stained (red) (lower panel) vascular plexus in P6 retinas. Arrowheads indicate EC-EC contacts with absent VE-cadherin signals. (D) Quantitation of vessel segments without a continuous junctional VE-cadherin signal (left, normalized to total IB4-labeled segments, n = 5 mice) and desmin-positive pericyte coverage in remodeling plexus (right, n = 4 mice). (E) Schematic illustration of the postnatal retinal angiogenesis model in Sema3Gfl/fl and Cdh5-Cre Sema3Gfl/fl mice. The postnatal retinal angiogenesis model could proceed as an overshooting reaction followed by the pruning of excessive vessels. Endothelial Sema3G deletion causes a hyperpruned vascular network in growing retinal vessels. Error bars represent mean ± SEM. *P < 0.05; **P < 0.01; 2-tailed Student’s t tests. Scale bars: 100 μm (A and C); magnified images: 50 μm (A and C).
Figure 6
Figure 6. Endothelial Sema3G deficiency significantly delays the regression of pathological vasculature and inhibits vascular normalization in OIR retinas.
(AH) IB4 staining of whole-mount retinas from Sema3Gfl/fl and Cdh5-Cre Sema3Gfl/fl OIR mice at P13 (A and E, n = 10 mice for each group), P15 (B and F, n = 8 mice for each group), P17 (C and G, n = 8 mice for each group), and P19 (D and H, n = 8 mice for each group) with quantification of the avascular area and neovascular tuft (NVT) area. The white dotted line indicates the edge of the retina, and the white area indicates NVTs. In the insets, the red line indicates the edge of the retina, the blue area indicates the avascular area, and the red area indicates NVTs. (I and J) TER119-positive RBC leakage and F4/80-positive macrophage infiltration in superficial and deep retinal layers of Sema3Gfl/fl OIR and Cdh5-Cre Sema3Gfl/fl OIR mice are shown. Error bars represent mean ± SEM. **P < 0.01; ***P < 0.001; 2-tailed Student’s t tests. Scale bars: 1000 μm (AD) and 100 μm (I and J).
Figure 7
Figure 7. HIF-2α upregulates Sema3G expression upon hypoxia in ECs.
(A and B) Sema3G and Vegfa mRNA levels in bEnd.3 cells exposed to normoxia (21% O2) or hypoxia (1% O2) for the indicated times. Data were normalized to gene expression in cells upon normoxia (n = 3 independent experiments). (C) Immunoblot analysis of Sema3G, HIF-1α, and HIF-2α protein in bEnd.3 cells exposed to hypoxia (1% O2) for the indicated times. (D and E) RT-qPCR analysis of Sema3G mRNA in bEnd.3 cells, which were transfected with siHIF-1α (D), siHIF-2α (E), or siControl for 48 hours and then exposed to hypoxia (1% O2) or normoxia (21% O2) for an additional 12 hours (n = 3 independent experiments). (F) Schematic diagram depicting the mouse Sema3G promoter with the presence of hypoxia response element (HRE) sequences. HRE sequences from the JASPAR database. ChIP-qPCR primers of the indicated HRE regions are shown. (G) ChIP-qPCR assays were performed with the antibodies against HIFs or IgG as control in bEnd.3 cells exposed to 1% O2 for 12 h (n = 3 independent experiments). (H) Diagrammatic representation of mutated HRE (mHRE) introduced into the mouse Sema3G promoter to test HREs in regulating Sema3G transcription. (I) Luciferase reporter assay for Sema3G promoter activity in HEK293 cells following transfection of different mHRE vectors (n = 3 independent experiments). Error bars represent mean ± SEM. *P < 0.05; **P < 0.01; ***P < 0.001; 2-tailed Student’s t tests (A, B, D, E, G), 1-way ANOVA with Dunnett’s multiple comparisons test (I). TSS, transcription start site.
Figure 8
Figure 8. Sema3G deficiency increases the instability of β-catenin.
(A and B) GO terms and KEGG pathway analysis of the differentially expressed genes between control and Sema3G-silenced HRMECs. (C) Schematic of the Cas9-sgRNA–targeting sites in the human Sema3G gene. The gray shaded region labels the sgRNA-targeting sequences. (D) β-catenin (green), VE-cadherin (red), phalloidin (magenta), and DAPI (blue) staining of control and Sema3G knockout (Sema3G-KO) HRMECs with or without lentivirus-mediated β-catenin overexpression (β-catenin OE). (E) Fluorescence signal intensities of β-catenin staining quantified from D (n = 5 independent experiments). (FJ) Immunoblot analysis and quantification of β-catenin and VE-cadherin protein levels in control and Sema3G-KO HRMECs with or without lentivirus-mediated β-catenin OE (n = 4 independent experiments). Error bars represent mean ± SEM. *P < 0.05; **P < 0.01; ***P < 0.001; 1-way ANOVA with Tukey’s multiple comparisons test. Scale bars: 50 μm (D); magnified images: 10 μm (D). PAM, protospacer adjacent motif; p-β-catenin, phosphorylated β-catenin.
Figure 9
Figure 9. Reduction in the expression of β-catenin as a result of Sema3G deficiency in OIR mice.
(A) Representative images of β-catenin (red) and VE-cadherin (green) expression in IB4-positive (blue) vessels at the vascular front (revascularization) and vascular plexus in Sema3Gfl/fl OIR and Cdh5-Cre Sema3Gfl/fl OIR mice at P19. (B) Fluorescence signal intensities of β-catenin and VE-cadherin staining quantified from A (n = 5 mice for each group). (C) Representative β-catenin staining in control and Sema3G-KO HRMECs following hypoxia (1% O2) treatment. (D) Fluorescence signal intensities of β-catenin staining quantified from C (n = 4 independent experiments). (E and F) Immunoblot analysis and quantification of β-catenin protein levels in control and Sema3G-KO HRMECs following hypoxia (1% O2) treatment (n = 4 independent experiments). Error bars represent mean ± SEM. ***P < 0.001; 2-tailed Student’s t tests. Scale bars: 100 μm (A) and 50 μm (C); magnified images, 10 μm (C).
Figure 10
Figure 10. Sema3G regulates vascular regeneration and decreases hemorrhage by stabilizing β-catenin expression in OIR.
(A and B) Lithium chloride (LiCl) or sodium chloride (NaCl, as control) was administered to the OIR mice by intraperitoneal injection. At P17 and P18, OIR mouse pups were intraperitoneally injected with NaCl or LiCl. Then, retinas were analyzed at P19. (C) Expression of β-catenin at the vascular front (revascularization) and vascular plexus in IB4-stained P19 retinas of Sema3Gfl/fl OIR and Cdh5-Cre Sema3Gfl/fl OIR mice treated with NaCl or LiCl. (D) Fluorescence signal intensities of β-catenin staining quantified from C (n = 6 mice for each group). (E) Representative images showing TER119-positive RBC leakage in superficial and deep retinal layers of Sema3Gfl/fl OIR and Cdh5-Cre Sema3Gfl/fl OIR mice treated with NaCl or LiCl. (F) Quantification of RBC leakage in Sema3Gfl/fl OIR and Cdh5-Cre Sema3Gfl/fl OIR mice as shown in E (n = 5 mice for each group). Error bars represent mean ± SEM. **P < 0.01; ***P < 0.001; 1-way ANOVA with Tukey’s multiple comparisons test. Scale bars: 100 μm (C and E).
Figure 11
Figure 11. Sema3G modulates β-catenin stability in an Nrp2/PlexinD1-dependent manner.
(A) Immunoprecipitated (IP) Nrp2 was immunoblotted (IB) with Nrp2 or PlexinD1 antibody in HRMECs (n = 3 independent experiments). (B) Representative β-catenin and VE-cadherin staining in Sema3G-KO HRMECs treated with siControl or siPlexinD1 and then incubated with or without recombinant Sema3G protein. (C) Fluorescence signal intensities of β-catenin quantified from B (n = 5 independent experiments). (DH) Immunoblot analysis and quantification of β-catenin and VE-cadherin protein levels in Sema3G-KO HRMECs treated with siControl or siPlexinD1 and then incubated with or without recombinant Sema3G protein (n = 4 independent experiments). Error bars represent mean ± SEM. *P < 0.05; ***P < 0.001; 2-tailed Student’s t tests (A) and 1-way ANOVA with Tukey’s multiple comparisons test (C, EH). Scale bars: 50 μm (B); magnified images: 10 μm (B).
Figure 12
Figure 12. PlexinD1 is necessary for the functional performance of endothelial Sema3G against pathological neovascularization.
(A) Schematic diagram of the AAV used for PlexinD1 knockdown in vivo. (B) Transduction of ECs with AAV in Cdh5-Cre Sema3Gfl/fl OIR mice. Neonatal mice were injected through the retro-orbital sinus with AAV at P7 and P12. At P17, mouse pups were intravitreally injected with 1 μg IgG or recombinant Sema3G. Retinas were analyzed at P19. (C) Representative images of RNA in situ hybridization for PlexinD1 mRNA in whole-mounted retinas of OIR mice. (D) Quantification of PlexinD1 mRNA in OIR retinas in C (n = 4 mice for each group). (E) IB4 staining of retinas from Cdh5-Cre Sema3Gfl/fl OIR mice transduced with AAV-shControl or AAV-shPlexinD1 and treated with or without recombinant Sema3G protein. (F and G) Quantification of the avascular area and NVT area at P19 in OIR, related to E (n = 9, 10, 8, and 10 mice for Cdh5-Cre Sema3Gfl/fl + AAV-shControl + IgG, Cdh5-Cre Sema3Gfl/fl + AAV-shControl + Sema3G, Cdh5-Cre Sema3Gfl/fl + AAV-shPlexinD1+ IgG and Cdh5-Cre Sema3Gfl/fl + AAV-shPlexinD1 + Sema3G groups, respectively). Error bars represent mean ± SEM. **P < 0.01; ***P < 0.001; 2-tailed Student’s t tests (D) and 1-way ANOVA with Tukey’s multiple comparisons test (F and G). Scale bars: 50 μm (C) and 1000 μm (E).
Figure 13
Figure 13. Supplementation of Sema3G ameliorates ischemic retinopathy in the OIR model.
(A and B) Transduction of ECs with AAV in Sema3Gfl/fl and Cdh5-Cre Sema3Gfl/fl OIR mice. Neonatal mice were injected through the retro-orbital sinus with AAV-Control or AAV-Sema3G at P7 and P12. The retinas were analyzed at P19. (C and D) Immunoblots and quantification analysis showed overexpression of Sema3G in the retinas of AAV-Sema3G–injected mice compared with AAV-Control–injected mice (n = 3 independent experiments). (E) IB4 staining of whole-mount retinas from OIR mice infected with AAV-Control or AAV-Sema3G. (F and G) Quantification of the avascular areas and the NVT area at P19 in OIR, related to E (n = 8, 10, 9, and 9 mice for Sema3Gfl/fl + AAV-Control, Sema3Gfl/fl + AAV-Sema3G, Cdh5-Cre Sema3Gfl/fl + AAV-Control and Cdh5-Cre Sema3Gfl/fl + AAV-Sema3G groups, respectively). (H and I) Schematic illustration of the OIR mice treated with intravitreal injections of recombinant Sema3G. At P15, mouse pups were intravitreally injected with 1 μg IgG or recombinant Sema3G. Retinas were analyzed at P17. (J) Entire eye samples of mice were harvested and homogenized, then prepared for immunoblot analysis of total Sema3G protein abundance. (K) IB4 staining of whole-mount retinas from Sema3Gfl/fl and Cdh5-Cre Sema3Gfl/fl OIR mice injected with IgG or recombinant Sema3G. (L and M) Quantification of the avascular area and NVT area at P17 in OIR, related to K (n = 10, 10, 10, and 10 mice for Sema3Gfl/fl + IgG, Sema3Gfl/fl + Sema3G, Cdh5-Cre Sema3Gfl/fl + IgG and Cdh5-Cre Sema3Gfl/fl + Sema3G groups, respectively). Error bars represent mean ± SEM. **P < 0.01; ***P < 0.001; 1-way ANOVA with Tukey’s multiple comparisons test. Scale bars: 1000 μm (E and K).
Figure 14
Figure 14. Schematic illustration of the mechanism by which endothelium-derived Sema3G attenuates ischemic retinopathy.
Loss of Sema3G in endothelial cells aggravated pathological angiogenesis in OIR mice. Sema3G functions as an essential defense mechanism deployed by the vasculature to promote pathological blood vessel regression and to promote vascular normalization during vessel remodeling. Mechanistically, we demonstrated that HIF-2α directly regulated Sema3G transcription in ECs under hypoxia. Sema3G coordinated the functional interaction between β-catenin and VE-cadherin by increasing β-catenin stability in the endothelium through the Nrp2/PlexinD1 receptor. Furthermore, Sema3G supplementation enhanced healthy vascular network formation and promoted diseased vasculature regression.

References

    1. Korn C, Augustin HG. Mechanisms of vessel pruning and regression. Dev Cell. 2015;34(1):5–17. doi: 10.1016/j.devcel.2015.06.004. - DOI - PubMed
    1. Mazzoni J, et al. The Wnt inhibitor Apcdd1 coordinates vascular remodeling and barrier maturation of retinal blood vessels. Neuron. 2017;96(5):1055–1069. doi: 10.1016/j.neuron.2017.10.025. - DOI - PMC - PubMed
    1. Antonetti DA, et al. Diabetic retinopathy. N Engl J Med. 2012;366(13):1227–1239. doi: 10.1056/NEJMra1005073. - DOI - PubMed
    1. Hellstrom A, et al. Retinopathy of prematurity. Lancet. 2013;382(9902):1445–1457. doi: 10.1016/S0140-6736(13)60178-6. - DOI - PMC - PubMed
    1. Kim LA, D’Amore PA. A brief history of anti-VEGF for the treatment of ocular angiogenesis. Am J Pathol. 2012;181(2):376–379. doi: 10.1016/j.ajpath.2012.06.006. - DOI - PMC - PubMed

Publication types

MeSH terms

Associated data