. 2021 Feb 15;131(4):e140299.
doi: 10.1172/JCI140299.

The lung microenvironment shapes a dysfunctional response of alveolar macrophages in aging

Affiliations

The lung microenvironment shapes a dysfunctional response of alveolar macrophages in aging

Alexandra C McQuattie-Pimentel et al. J Clin Invest. .

Abstract

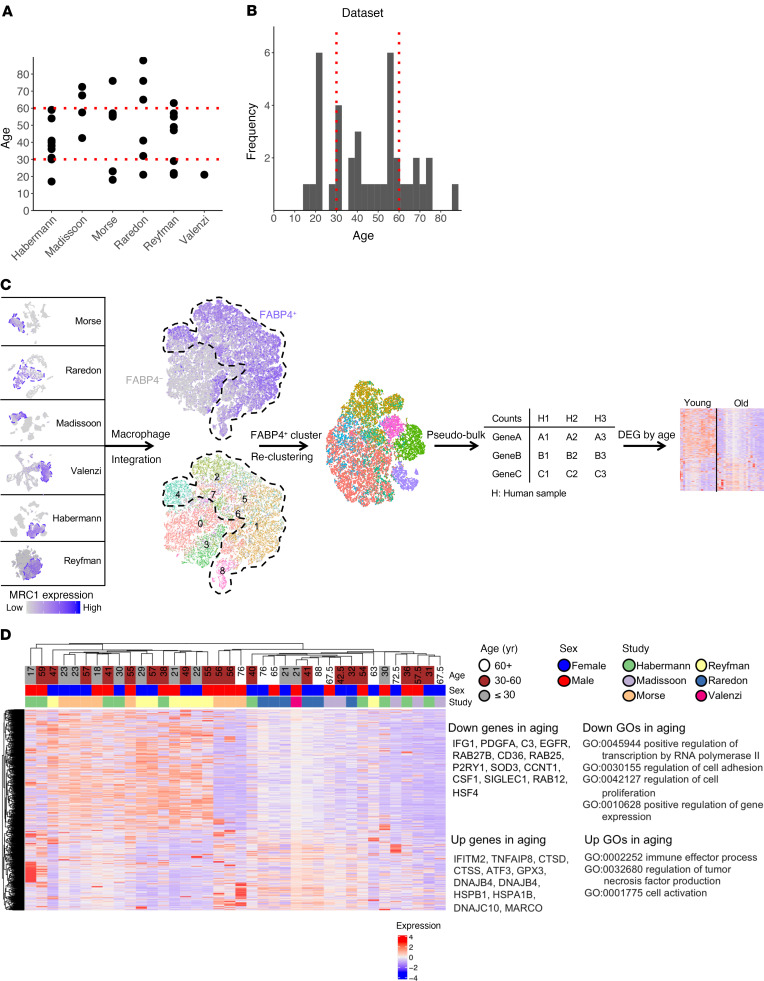
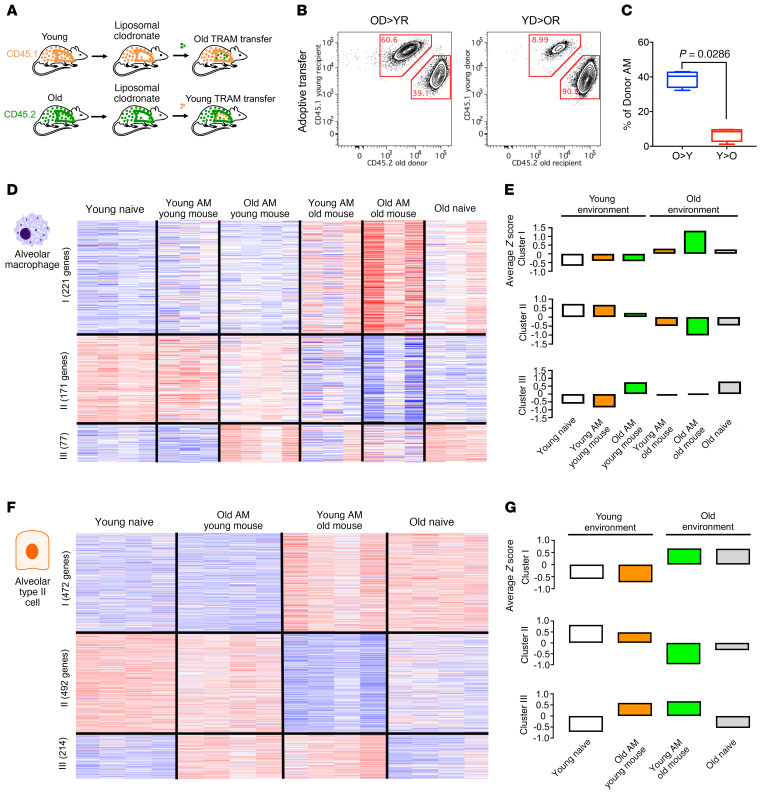
Alveolar macrophages orchestrate the response to viral infections. Age-related changes in these cells may underlie the differential severity of pneumonia in older patients. We performed an integrated analysis of single-cell RNA-Seq data that revealed homogenous age-related changes in the alveolar macrophage transcriptome in humans and mice. Using genetic lineage tracing with sequential injury, heterochronic adoptive transfer, and parabiosis, we found that the lung microenvironment drove an age-related resistance of alveolar macrophages to proliferation that persisted during influenza A viral infection. Ligand-receptor pair analysis localized these changes to the extracellular matrix, where hyaluronan was increased in aged animals and altered the proliferative response of bone marrow-derived macrophages to granulocyte macrophage colony-stimulating factor (GM-CSF). Our findings suggest that strategies targeting the aging lung microenvironment will be necessary to restore alveolar macrophage function in aging.

Keywords: Aging; Immunology; Influenza; Innate immunity; Macrophages.


Conflict of interest statement

Conflict of interest: The authors have declared that no conflict of interest exists.

Figures

Figure 1
Figure 1. Age-related changes in alveolar macrophage transcriptomes persist during influenza A infection in mice.
(A) Schematic of the experimental design. (B) PCA plots show changes in alveolar macrophage and AT2 cell transcriptomes in response to influenza A infection (PC1) and age (PC2). IAV, influenza A virus.(C) Differentially expressed genes (FDR q < 0.05) between alveolar macrophages from young adult and old mice are shown with the representative genes and GO biological processes (see Supplemental Figure 1C and Supplemental Table 1 for genes and GO processes). (D) Differentially expressed genes (FDR q < 0.05) between AT2 cells from young adult and old mice are shown with the representative genes and GO biological processes (see Supplemental Figure 1C and Supplemental Table 1 for genes and GO processes. (E) The t-distributed stochastic neighbor embedding (tSNE) plot shows clusters of alveolar macrophages from 4-, 12-, and 18-month-old mice (see Supplemental Table 2 for the complete list of cluster markers). n = 2 mice per age group. (F) Bar plot shows the distribution of alveolar macrophages in each cluster as a function of age. (G) tSNE plot shows alveolar macrophages colored by mouse age. (H) Meta-analysis of 6 independent experiments in which alveolar macrophages from lung homogenates from young adult and old mice were quantified by flow cytometry. (I) tSNE plot shows clusters of AT2 cells in single-cell RNA-Seq analysis of lung homogenates from 4-, 12-, and 18-month-old mice. n = 2 mice per age group. (J) Bar plot shows the distribution of AT2 cells in each cluster as a function of age. (K) tSNE plot shows AT2 cells colored by mouse age. FC, fold change.
Figure 2
Figure 2. Integrated analysis of single-cell RNA-Seq data obtained from the healthy human lung reveals uniform changes in the transcriptome of alveolar macrophages with age.
(A) Age distribution in each of the 6 published data sets of single-cell RNA-Seq data obtained from healthy human lungs. (B) Histogram of the age distribution in the combined data from the 6 studies. (C) Schematic of the integrated analysis. Alveolar macrophages were identified by expression of typical macrophage marker genes including FABP4 within each of the individual data sets. After reclustering, clusters composed of contaminating cells identified by reduced expression of FABP4 were eliminated. The resulting integrated analysis showed no clustering of alveolar macrophages as a function of age (see also Supplemental Figure 2). Accordingly, cells from each individual were combined to generate a pseudo-bulk transcriptome, and differentially expressed genes with aging were compared. Full code is available on GitHub (https://github.com/NUPulmonary/Doublehit_Human_scRNA_Analysis; branch – master; commit ID: e486203eb0e1437d73be589a31c803fbc46182bd). (D) Pseudo-bulk analysis of alveolar macrophages from each of the 38 subjects. A heatmap of the differentially expressed genes between individuals under 30 and over 60 years of age was generated. The top columns indicate the chronological age and sex of each subject and the study in which they were included. Down, downregulated; Up, upregulated.
Figure 3
Figure 3. Age-related transcriptomic changes in TRAMs are not cell autonomous.
(A) Heterochronic adoptive transfer experiments were performed using CD45.1/CD45.2 pairings as indicated (see also Supplemental Figure 3). (B) Representative flow cytometric plots show engraftment of TRAMs from old (18–24 months) (OD) and young adult (4–6 months) (YD) donors into young adult (YR) and old recipients (OR), respectively. Harvesting was performed 60 days after the adoptive transfer. All mice received liposomal clodronate (25 L) intratracheally 72 hours prior to the adoptive transfer (also see Supplemental Figure 3). n = 4 mice per group. (C) Percentage of engraftment of donor alveolar macrophages (AM) 72 hours after intratracheal adoptive transfer of TRAMs from old donors into young adult recipients (OD>YR) or young adult donors into old recipients (YD>OR). n = 4 mice per group. Mann-Whitney U test. (D) Heatmap shows k-means clustering of differentially expressed genes (FDR q < 0.05 in ANOVA-like test) in TRAMs 60 days after heterochronic adoptive transfer into young or old mice. Naive mice did not undergo adoptive transfer. Young and old alveolar macrophages in the same mouse were distinguished by the CD45.1/CD45.2 label (see the full list of genes in Supplemental Table 3). (E) Average z scores for the genes in clusters I, II, and III in D. (F) Heatmap shows k-means clustering of differentially expressed genes (FDR q < 0.05 in ANOVA-list test) in AT2 cells 60 days after heterochronic adoptive transfer of TRAMs (see the full list of genes in Supplemental Table 3). (G) Average z scores for the genes in clusters I, II, and III from F.
Figure 4
Figure 4. Heterochronic parabiosis does not reverse age-related transcriptomic changes in TRAMs or AT2 cells.
(A) Parabionts were generated from young adult (4–6 months, green) and old (18–24 months, gray) pairs, and TRAMs and AT2 cells were harvested after 60 days. (B) Percentage of circulating CD45+ cells from the young or old parabiont pair determined by flow cytometry using CD45.1/CD45.2. P = NS by ANOVA. (C) PCA plot (PC1 and PC2) of TRAM transcriptomes of young and old mice linked to an isochronic or heterochronic parabiont pair. Each symbol represents an individual animal. (D) Heatmap shows k-means clustering of differentially expressed genes in TRAMs (FDR < 0.01 in ANOVA-like test) between old and young mice with isochronic or heterochronic parabiont pairs (see also Supplemental Table 5). (EG) Volcano plots show differentially expressed genes in TRAMs from young-young versus old/old versus young/old parabiotic pairs (FDR < 0.05) (see also Supplemental Figure 4 and Supplemental Tables 6–8). (H) AT2 cells were harvested from the same parabiont pairs as in A after 60 days. (I) PCA plot of transcriptomes of AT2 cells from young and old mice linked to an isochronic or heterochronic parabiont pair. Each symbol represents an individual animal. (J) Heatmap shows k-means clustering of differentially expressed genes in AT2 cells (FDR < 0.01 in ANOVA-like test) between old and young mice with isochronic or heterochronic parabiont pairs (see also Supplemental Table 9). (KM) Volcano plot showing differentially expressed genes in AT2 cells from young/young versus old/old versus young/old parabiotic pairs (FDR < 0.05) (see also Supplemental Figure 4 and Supplemental Tables 10–12).
Figure 5
Figure 5. The aging microenvironment confers resistance to GM-CSF signaling in alveolar macrophages.
(A) Schematic of the experimental design for B. Green represents young adult (4–6 months) mice, and gray represents old (18–24 months) mice. (B) Survival curve for young adult (4 months) or old (18 months) mice intratracheally infected with influenza A virus (A/WSN/33), 25 PFU/animal, with or without intratracheal GM-CSF (5 mg/kg). n = 5 per group. Mantel-Cox log-rank test. (C) Box-and-whisker plot shows the expression of genes known to regulate signaling through the GM-CSF receptor (Csf2ra, Csf2rb) and the M-CSF receptor (Csf1r) in TRAMs from young and old naive mice (n = 3–4 mice per group). FDR > 0.05 after multipair t test adjustment. (D) Box-and-whisker plot showing expression of Csf1, Csf2, and Il34 in AT2 cells from young and old naive mice (n = 4 mice per group). FDR > 0.05 after multipair t test adjustment. (E) Schematic for FH. Young adult (4 months) and old (18 months) mice were treated with intratracheal GM-CSF (5 mg/kg), and alveolar macrophages were harvested 14 days later (see also Supplemental Figure 5C). (F) Heatmap shows k-means clustering of cell-cycle genes between TRAMs from GM-CSF–treated and untreated young adult and old mice. Representative genes and GO processes are shown (see also Supplemental Table 13). (G) Volcano plot shows differentially expressed genes in young mice (FDR q < 0.05) after treatment with intratracheal GM-CSF (see also Supplemental Table 14). (H) Volcano plot shows differentially expressed genes in old mice (FDR q < 0.05) after treatment with intratracheal GM-CSF (see also Supplemental Table 14). CPM, counts per million reads.
Figure 6
Figure 6. The presence of high-molecular-weight hyaluronan reduces proliferation in BMDMs.
(A) Schematic of ligand-receptor analysis of AT2 cells and alveolar macrophages during aging. Analysis of differentially expressed genes (FDR < 0.01) in AT2 cells from old (18–24 months) and young adult (4–6 months) mice that were part of a ligand-receptor pair for which the corresponding ligand or receptor was detected in alveolar macrophages identified 72 genes with 255 possible interactions. Thirty-one of these genes encoded matrix proteins, 17 of which were detected in proteomics analysis of BAL fluid from healthy mice, reflecting the composition of the extracellular lining fluid. See Changes in composition of the alveolar lining fluid affect alveolarmacrophage responses to GM-CSF in aging in Results and Supplemental Table 20 for details. (B) Levels of total hyaluronan in BAL fluid from young (4–6 months) and old (18–24 months) mice (n = 10 mice, 5 male and 5 female per age). ***P < 0.0001, by Student’s t test. (C) BMDMs were grown with M-CSF (5 ng/mL) for 4 days, replated, and then stimulated with GM-CSF (5 ng/mL) for 3 days, after which the BMDMs were quantified (n = 6 replicates per experiment). Bar plots show the fold change in cell numbers when cells were treated with GM-CSF on plates coated with matrix from the mouse lung alveolar epithelium–like cell line MLE-12, laminin, and collagen (both 1 μg/cm2) in the presence or absence of high-molecular-weight hyaluronan (1 μg/cm2). Averages and the standard error of 3 independent experiments are shown. *P < 0.05, by 2-way ANOVA followed by Student’s t test.
Figure 7
Figure 7. Transcriptional differences between MoAMs and TRAMs persist over the lifespan.
(A) Alveolar macrophages from shielded chimeric mice were harvested from mice at the indicated ages, and TRAMs and MoAMs were flow-sorted on the basis of CD45.2 or CD45.1 labeling, respectively. Differentially expressed genes (FDR < 0.01 in an ANOVA-like test) were identified and subjected to k-means clustering. Selected genes and GO processes from each cluster are highlighted (see Supplemental Table 17 for the full list of genes and GO processes). (B) Representative immunofluorescence image of a lung section from a shielded 6-month-old chimeric mouse. Staining for CD45.2 was done to mark TRAMs and for CD45.1 to mark MoAMs. A combined image overlaid on a phase-contrast image is shown. Scale bars: 40 μm and 10 μm (enlarged inset). (C) Venn diagram shows overlap of differentially expressed genes between MoAMs and TRAMs in this model (clusters IV and V in A) with an independent data set from Misharin et al. (8) collected 10 months after bleomycin exposure. (D) Reduced representation bisulfite sequencing was performed on TRAMs and MoAMs from 6-month-old mice. The frequency of methylated CpG motifs in promoter regions within 1000 bp upstream and downstream of the transcriptional start site (TSS) of differentially expressed genes between TRAMs and MoAMs in shielded chimeric mice was compared with their frequency across the genome. A similar analysis was performed using putative enhancer regions specific to alveolar macrophages defined as consensus H3K4me1 peaks by Lavin et al. (7). No significant differences in DNA methylation were detected.
Figure 8
Figure 8. The response of TRAMs and newly resident MoAMs to a second challenge is similar.
(A) Experimental design for the PCA data in D. Mice were intratracheally infected with influenza A virus on day 0 followed by treatment with bleomycin on day 60. (B) Experimental design for the PCA data in E. Mice were administered intratracheal bleomycin on day 0 followed by treatment with a second dose of bleomycin on day 60. (C) Description of cell populations subjected to RNA-Seq. (D) PCA of alveolar macrophage transcriptomes. Colors and symbols refer to panels A and C. (E) PCA of alveolar macrophage transcriptomes. Colors and symbols refer to panels B and C. (F) Volcano plot shows differentially expressed genes (FDR < 0.05) between TRAMs and MoAMs (recruited in response to historic influenza A virus–induced pneumonia as the first injury; black double arrow in A) after the second injury with bleomycin. Representative genes are shown adjacent to the plot (see Supplemental Table 18 for the full list of genes). (G) Volcano plot shows differentially expressed genes (FDR < 0.05) between TRAMs and MoAMs (recruited in response to bleomycin exposure as the first injury; black double arrow in B) after the second injury with bleomycin. Representative genes are shown adjacent to the plot (see Supplemental Table 19 for the full list of genes).
Figure 9
Figure 9. The environment determines the response of resident and recruited alveolar macrophages after repeated injury.
(A) Schematic for the experimental design for panels BI. Pairwise comparisons described in panels BG and in panels GI are indicated by the double black arrows. (B) Volcano plot shows differentially expressed genes between MoAMs recruited after bleomycin exposure in mice historically treated with bleomycin and mice historically infected with influenza A (FDR < 0.05) (see Supplemental Table 24 for the full list of genes). (C) Volcano plot shows differentially expressed genes between MoAMs recruited after bleomycin exposure in untreated mice and mice historically exposed to bleomycin (FDR q < 0.05). (D) Volcano plot shows differentially expressed genes between MoAMs recruited after bleomycin exposure in untreated mice and mice historically infected with influenza A virus (FDR q < 0.05). (E) Lung compliance was measured in mice after a single bleomycin exposure and 2 sequential bleomycin exposures separated by 60 days. *P < 0.05, 2-way ANOVA followed by unpaired Student’s t test, for comparison between the first and second bleomycin exposures. n = 5 mice per group. (F) Collagen levels were measured in mice after a single bleomycin exposure and 2 sequential bleomycin exposures separated by 60 days. *P < 0.05, 2-way ANOVA followed by an unpaired t test, for comparison between first and second bleomycin exposures. n = 5 mice per group. (G) Volcano plot shows differentially expressed genes in TRAMs after bleomycin exposure in untreated mice and mice historically infected with influenza A virus (FDR < 0.05). (H) Volcano plot shows differentially expressed genes in TRAMs after bleomycin exposure in untreated mice and mice historically exposed to bleomycin (FDR < 0.05). (I) Volcano plot shows differentially expressed genes in TRAMs after bleomycin exposure in mice historically exposed to influenza A virus and mice historically exposed to bleomycin (FDR < 0.05). See also Supplemental Table 23. D, day.

References

    1. Zhou F, et al. Clinical course and risk factors for mortality of adult inpatients with COVID-19 in Wuhan, China: a retrospective cohort study. Lancet. 2020;395(10229):1054–1062. doi: 10.1016/S0140-6736(20)30566-3. - DOI - PMC - PubMed
    1. Budinger GRS, et al. The intersection of aging biology and the pathobiology of lung diseases: a joint NHLBI/NIA workshop. J Gerontol A Biol Sci Med Sci. 2017;72(11):1492–1500. doi: 10.1093/gerona/glx090. - DOI - PMC - PubMed
    1. Hussell T, Bell TJ. Alveolar macrophages: plasticity in a tissue-specific context. Nat Rev Immunol. 2014;14(2):81–93. doi: 10.1038/nri3600. - DOI - PubMed
    1. Yona S, et al. Fate mapping reveals origins and dynamics of monocytes and tissue macrophages under homeostasis. Immunity. 2013;38(1):79–91. doi: 10.1016/j.immuni.2012.12.001. - DOI - PMC - PubMed
    1. Hashimoto D, et al. Tissue-resident macrophages self-maintain locally throughout adult life with minimal contribution from circulating monocytes. Immunity. 2013;38(4):792–804. doi: 10.1016/j.immuni.2013.04.004. - DOI - PMC - PubMed

Publication types