. 2021 Feb 15:10:e61881.
doi: 10.7554/eLife.61881.

Anatomy and activity patterns in a multifunctional motor neuron and its surrounding circuits

Affiliations

Anatomy and activity patterns in a multifunctional motor neuron and its surrounding circuits

Mária Ashaber et al. Elife. .

Abstract

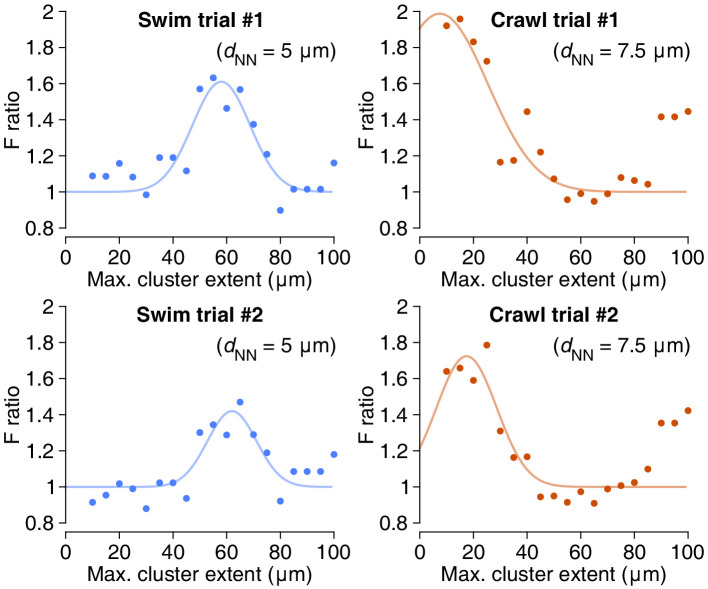
Dorsal Excitor motor neuron DE-3 in the medicinal leech plays three very different dynamical roles in three different behaviors. Without rewiring its anatomical connectivity, how can a motor neuron dynamically switch roles to play appropriate roles in various behaviors? We previously used voltage-sensitive dye imaging to record from DE-3 and most other neurons in the leech segmental ganglion during (fictive) swimming, crawling, and local-bend escape (Tomina and Wagenaar, 2017). Here, we repeated that experiment, then re-imaged the same ganglion using serial blockface electron microscopy and traced DE-3's processes. Further, we traced back the processes of DE-3's presynaptic partners to their respective somata. This allowed us to analyze the relationship between circuit anatomy and the activity patterns it sustains. We found that input synapses important for all the behaviors were widely distributed over DE-3's branches, yet that functional clusters were different during (fictive) swimming vs. crawling.

Keywords: Hirudo verbana; connectome; motor behaviors; neural circuit; neuroscience; serial blockface electron microscopy; voltage-sensitive dye imaging.


Conflict of interest statement

MA, YT, PK, EB, WK, ME, DW No competing interests declared

Figures

Figure 1.
Figure 1.. Approach.
Several fictive behaviors were induced in the isolated nervous system of a medicinal leech while one segmental ganglion was imaged using a voltage-sensitive dye. After fixation and resin embedding, the ganglion was X-ray-imaged to verify that the geometry of somata was preserved. Finally, the neuropil was imaged at nanometer resolution with serial blockface electron microscopy and selected neurons were manually traced. Scale bars: 1 cm (leech photograph); 100 μm (all others).
Figure 2.
Figure 2.. Fictive swimming imaged using VSD.
(a) Images of the dorsal (left) and ventral (right) aspects of a leech ganglion simultaneously obtained using a double-sided microscope. ‘R’ indicates the right side of the ganglion (i.e., the animal’s right when dorsal side up). (b) Selected VSD traces during fictive swimming. From the dorsal surface: dorsal and ventral inhibitory and excitatory motor neurons DI-1, VI-2, DE-3, and VE-4; from the ventral surface: the Retzius cells (neuromodulatory interneurons) and cell 153L (an interneuron). All those cells are known to be rhythmically active during swimming. Also shown is CVL, an excitor of ventrolateral circular muscles that was intracellularly recorded during the trial as a control to verify that fluorescence signals reflect membrane potential changes as they should. Scale bars: 0.2% relative fluorescence change, 5 mV membrane potential change. (c) Magnitude (radial axis from 0 to 1) and phase (angular coordinate) of the coherence of activity in individual neurons with the swim rhythm in motor neuron DE-3R. Error bars indicate confidence intervals based on a multi-taper estimate. (d) Coherence maps of the VSD signals of all cells on the dorsal (left) and ventral (right) surfaces of the ganglion. Colors of cell bodies indicate coherence relative to DE-3R. The yellow needle on CVL indicates a sharp electrode for intracellular recording. Color scale applies to all panels.
Figure 3.
Figure 3.. Fictive crawling imaged using VSD.
(a) Selected VSD traces during fictive crawling. From the dorsal surface: dorsal and ventral inhibitory and excitatory motor neurons DI-1, VI-2, DE-3, and VE-4; from the ventral surface: the Retzius cells and CV cells. All those cells are known to be rhythmically active during crawling. Below the VSD traces, a simultaneously recorded intracellular trace of the annulus erector motor neuron AER is displayed (in both columns). Scale bars: 0.2%, 10 mV. Gray lines mark hyperpolarized phase of AER. (b) Magnitude and phase of the coherence of activity in individual neurons with the crawl rhythm in motor neuron DE-3R. (c) Coherence maps of the VSD signals of all cells on the dorsal (left) and ventral (right) surfaces of the ganglion. Colors of cell bodies indicate coherence relative to DE-3R. The yellow needle on AER indicates a sharp electrode for intracellular recording. Color scale applies to all panels.
Figure 4.
Figure 4.. Fictive local bending imaged using VSD.
(a) Selected VSD traces during fictive local bending. From the dorsal surface: dorsal and ventral inhibitory and excitatory motor neurons DI-1, VI-2, DE-3, and VE-4; from the ventral surface: the Retzius cells, ‘Anterior Pagoda’ cells (‘AP’; well-known postsynaptic partners of the P cells with unknown function). Below the traces, a simultaneously recorded intracellular trace of the PVL cell is displayed with injected current trains (in both columns). Scale bars: 0.2% relative fluorescence change, 100 mV membrane potential change, 2 nA injected current. (b) Magnitude and phase of the coherence of activity in individual neurons with the local bend rhythm in DE-3R. (c) Coherence maps of the VSD signals of all cells on the dorsal (left) and ventral (right) surfaces of the ganglion. Colors of cell bodies indicate coherence relative to DE-3R. A yellow needle on PVL indicates a sharp electrode for electrical stimulation. Note that PVL was only weakly stained by the VSD because it was left partially covered with sheath tissue to preserve its health.
Figure 5.
Figure 5.. Mapping between functional and anatomical images.
(a) Light micrograph (left) and X-ray image (right) of the ganglion in which we recorded neuronal activity using a VSD. Matching colors label the same cells on the two images. A: Anterior, P: Posterior, L: Left, R: Right. (b) Transverse section from X-ray tomographic image stack of the ganglion (top). Only the shaded area was imaged with SBEM (bottom). Arrowheads mark several somata that are (white) or are not (red) included in the SBEM volume. Circles mark neurites that facilitated complete mapping between the two imaging modalities. D: Dorsal, V: Ventral. Note that the X-ray image in (b) is shown in reverse video relative to the x-ray image in (a) for easier visual comparison with the SBEM image.
Figure 6.
Figure 6.. Electron microscopic tracing: neurites and synapses of motor neuron DE-3R.
(a) The principal neurite of DE-3R near its entrance to the neuropil (dashed yellow outline). (b) Two branches of the neurite of DE-3R (dashed outlines). (c) A synaptic connection onto DE-3R from an inhibitory motor neuron (DI-1R). Arrowheads: synapses, Pre: presynaptic terminal, v: vesicles. (d) A synapse onto DE-3R from an interneuron (cell 24 on the canonical map [Wagenaar, 2017]).
Figure 6—figure supplement 1.
Figure 6—figure supplement 1.. Comparison of SEM with TEM for interpreting synapses.
(a) Our interpretation of a small section of our SBEM image: a process of cell DE-3 (yellow) and a presynaptic partner (purple). (b) Same area without overlay. Arrowhead: synapse. Stars: Mitochondria. (c) A similar area imaged with TEM (from a ganglion from another leech). (d) Same area as (c), computationally blurred (radius: 15 μm) to simulate the lower resolving power of SEM.
Figure 6—figure supplement 2.
Figure 6—figure supplement 2.. Basis for estimating true resolution of SEM images: Spectral power in the images.
Average based on four representive 2048 × 2048 pixel regions from the volume.
Figure 6—figure supplement 3.
Figure 6—figure supplement 3.. Workflow for identifying neurons in our data with the canonical map of the ganglion.
Figure 7.
Figure 7.. Traced neuronal arborizations.
(a) Fully reconstructed arborization of DE-3R overlaid on a dorsal projection and a transverse section of the micro-CT data. (b) A selection of presynaptic partners with previously known identities. (c) A selection of presynaptic partners not matched to neurons previously described in the literature. (Top row: cell bodies on dorsal aspect; bottom row: cell bodies on ventral aspect of the ganglion.) Other cells in this category are 20R, 25R, 154R, 156L. Numbers in parentheses are number of synapses between each cell and DE-3R.
Figure 8.
Figure 8.. Full tracing of DE-3R (thick black line, soma location marked ‘DE-3’) and backtracings of all synaptic partners.
Partners that we could identify with cells in the VSD recording are marked with (arbitrary) colors. Small gray disks indicate partner neurons that could not be cross-identified between EM and VSD image stacks.
Figure 9.
Figure 9.. Correlation between anatomical and functional measures of synaptic strength.
(a) Scatter plot of synapse count vs coherence magnitude during swimming for presynaptic partners with at least two synapses, with linear regression line (data from swim trial #1, R = 0.26, p = 0.20, n.s.). (b) Same for crawling (data from crawl trial #1, R = 0.38, p = 0.05, n.s.). (c) Correlation coefficients for all trials (left) and when raw synapse count was replaced by proximity weight (right; see Materials and methods).
Figure 10.
Figure 10.. Spatial distribution of synapses onto DE-3.
(a) Distribution of excitatory and inhibitory synapses. (b) Histogram of the length of the paths between those synapses and the soma. (c) Distribution of synapses more strongly associated with a certain behavior. (d) Histogram of the length of the paths between those synapses and the soma (LB: Local bend).
Figure 10—figure supplement 1.
Figure 10—figure supplement 1.. Path lengths between synapses and the trunk of DE-3R.
(a) Path length for excitatory vs inhibitory synapses. (b) Path lengths for synapses from neurons more strongly associated with a certain behavior.
Figure 11.
Figure 11.. Synaptic clustering.
(a) Tracing of DE-3R with synapses (arbitrarily) colored by presynaptic partner. (b) Clusters (elliptic areas) associated with synchronized synapses for a swimming trial (top) and a crawling trial (bottom). Within the same connectome, clusters of synchronized synapses differ with respect to their spatial extent for the two behaviors: During swimming, synchronization extends over larger areas along the neurite than during crawling. Shown are synaptic clusters obtained with parameter values (dNN, dext) = (5 μm, 65 μm) for swimming and (dNN, dext) = (7.5 μm, 15 μm) for crawling, respectively. Synapses are colored by the coherence between the activity of their presynaptic partner and DE-3R during the behaviors (as in Figure 2) and clusters are colored by the average coherence of their constituent presynaptic partners. Inset: Explanation of clustering parameters (see Materials and methods). (c) All clustering results for swim and crawl trials. Color indicates the degree of correspondence between spatial clusters and functional grouping expressed as an F-ratio from complex ANOVA (see Materials and methods) as a function of clustering parameters.
Figure 11—figure supplement 1.
Figure 11—figure supplement 1.. Clustering results for the local bend trials.
Out of the four trials, the first three involved stimulation of the left PV cell; the final trial involved stimulation of the right PV cell. In contrast to the swim and crawl trials (Figure 10b), the clustering results for local bend trials are inconsistent.
Figure 11—figure supplement 2.
Figure 11—figure supplement 2.. Peak F-ratios for connecting spatial clusters to functional activity.
These graphs represent slices through the data shown in Figure 11c, vertically through the highest peak in the parameter space. Lines are Gaussians fitted through the data; see Materials and methods.
Figure 11—figure supplement 3.
Figure 11—figure supplement 3.. Demonstration of the F-ratio method using synthetic data.
(a) Synthetic data where the coherence of a neuron’s activity (location of each dot) is unrelated to its membership in a spatially defined cluster (color), hence F = 1. (b) Synthetic data where such a relationship does exist, hence F > 1. See Materials and methods.
Figure 12.
Figure 12.. Wiring diagram of DE3.
The diagram shows synaptic connections onto DE3, including newly found presynaptic neurons in this study (yellow) and previously known ones (green if also found in this study; white otherwise). Only confidently identified neurons shown in Figure 7 and Table 1 are represented as ‘found.’ Other presynaptic partners found but not positively identified in this study are not shown here. This diagram does not depict whether connections are ipsi- or contralateral.
Author response image 1.
Author response image 2.

Similar articles

Cited by

References

    1. Ahrens MB, Orger MB, Robson DN, Li JM, Keller PJ. Whole-brain functional imaging at cellular resolution using light-sheet microscopy. Nature Methods. 2013;10:413–420. doi: 10.1038/nmeth.2434. - DOI - PubMed
    1. Alivisatos AP, Chun M, Church GM, Greenspan RJ, Roukes ML, Yuste R. The brain activity map project and the challenge of functional connectomics. Neuron. 2012;74:970–974. doi: 10.1016/j.neuron.2012.06.006. - DOI - PMC - PubMed
    1. Andjelic S, Torre V. Calcium dynamics and compartmentalization in leech neurons. Journal of Neurophysiology. 2005;94:4430–4440. doi: 10.1152/jn.00695.2005. - DOI - PubMed
    1. Bargmann CI, Marder E. From the connectome to brain function. Nature Methods. 2013;10:483–490. doi: 10.1038/nmeth.2451. - DOI - PubMed
    1. Bates AS, Schlegel P, Roberts RJ, Drummond N, Tamimi IFM, Turnbull R, Zhao X, Marin EC, Popovici PD, Dhawan S, Jamasb A, Javier A, Li F, Rubin GM, Waddell S, Bock DD, Costa M, Jefferis G. Complete connectomic reconstruction of olfactory projection neurons in the fly brain. bioRxiv. 2020 doi: 10.1101/2020.01.19.911453. - DOI - PMC - PubMed

Publication types