. 2021 Feb 15:10:e64444.
doi: 10.7554/eLife.64444.

A β-catenin-driven switch in TCF/LEF transcription factor binding to DNA target sites promotes commitment of mammalian nephron progenitor cells

Affiliations

A β-catenin-driven switch in TCF/LEF transcription factor binding to DNA target sites promotes commitment of mammalian nephron progenitor cells

Qiuyu Guo et al. Elife. .

Erratum in

Abstract

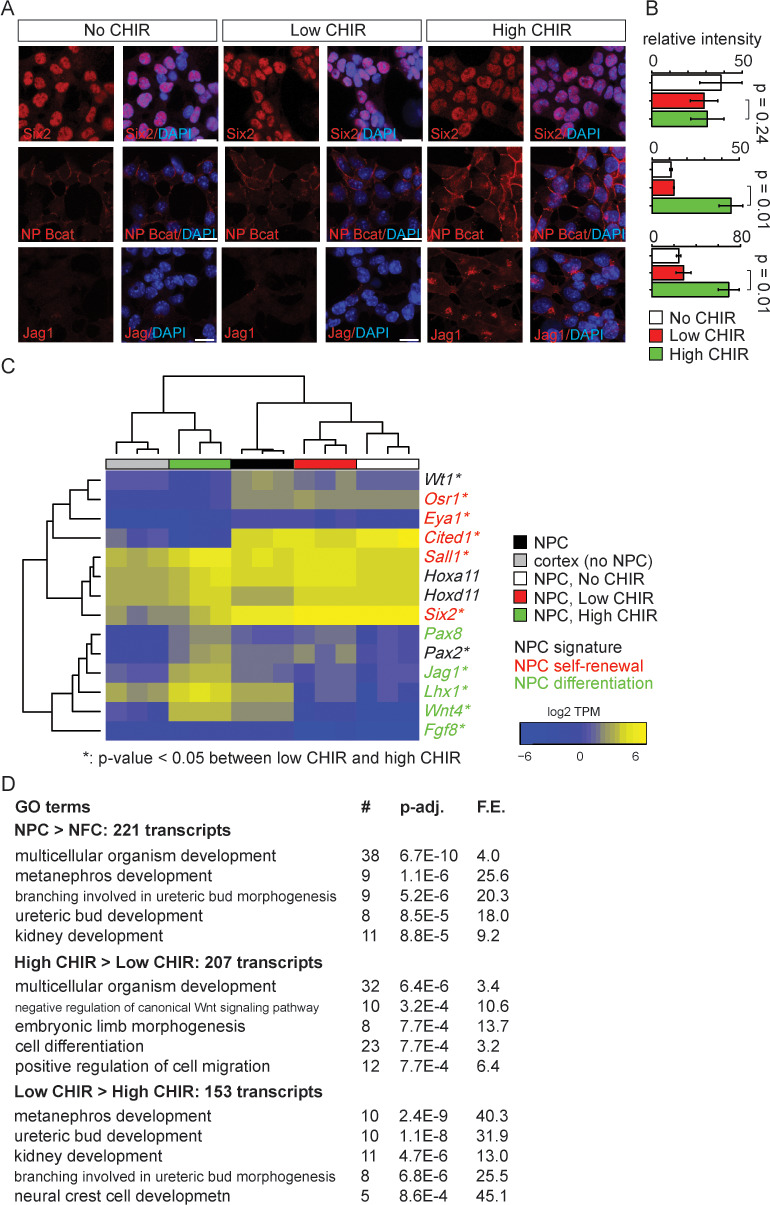
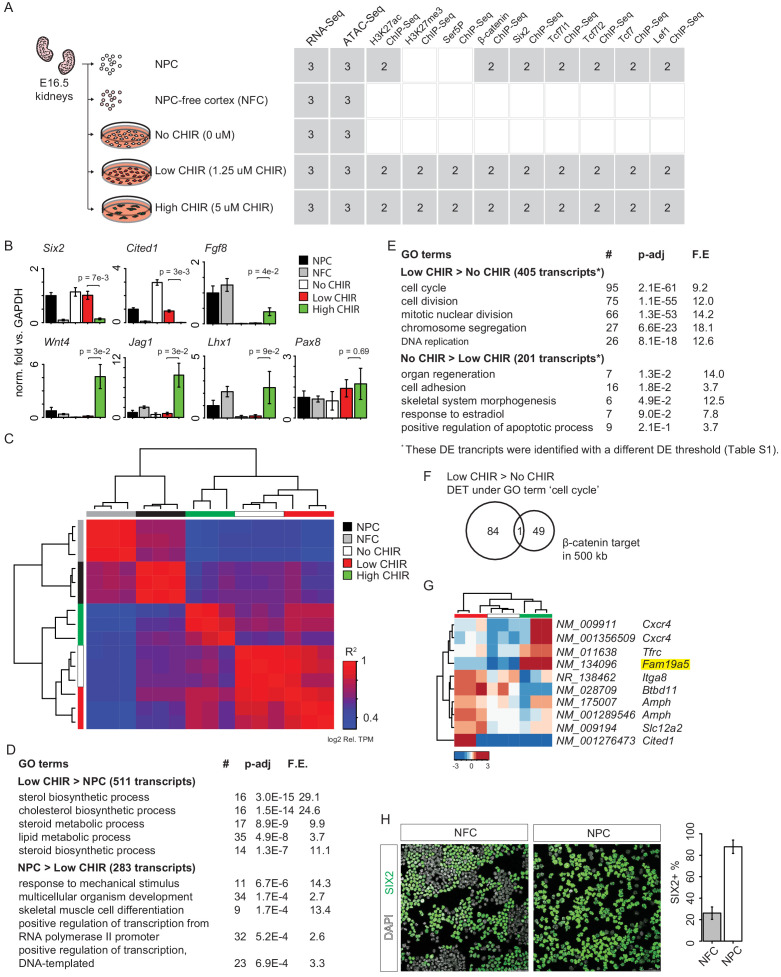
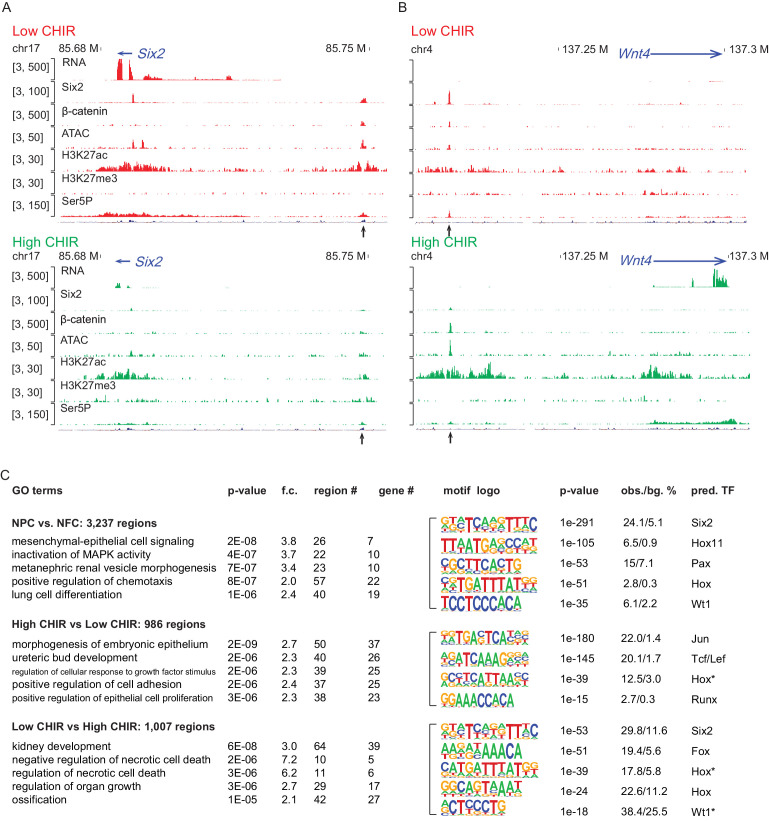
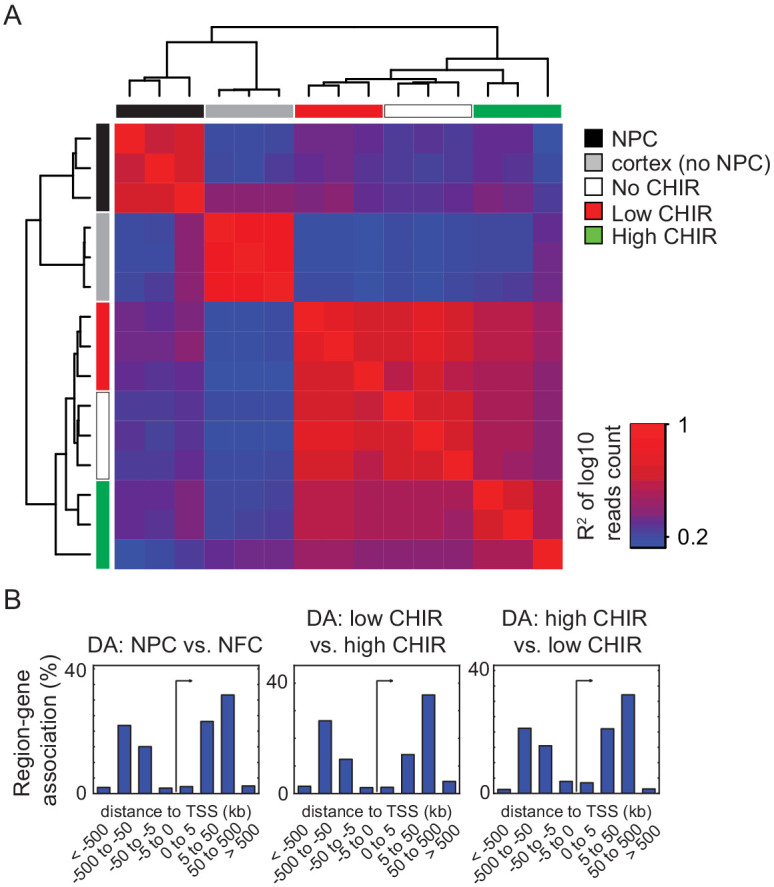
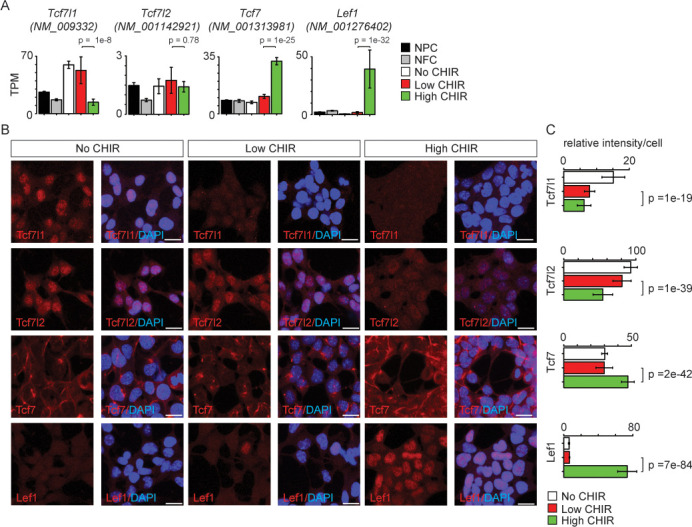
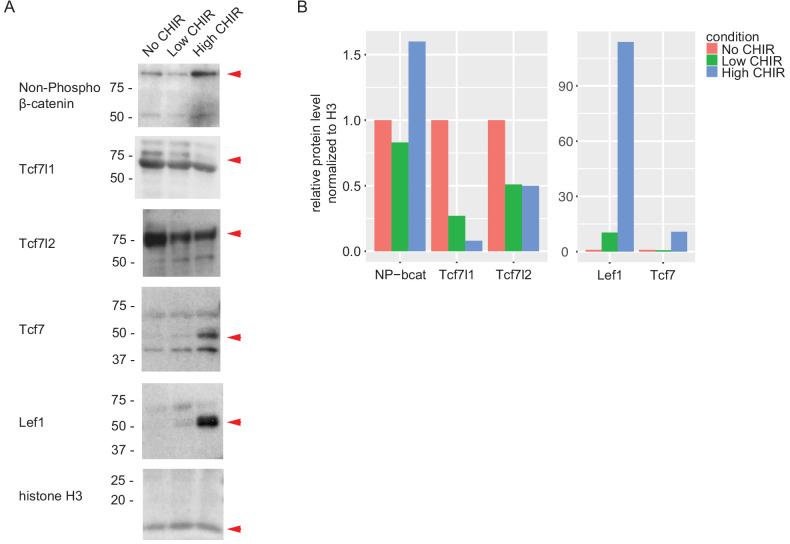
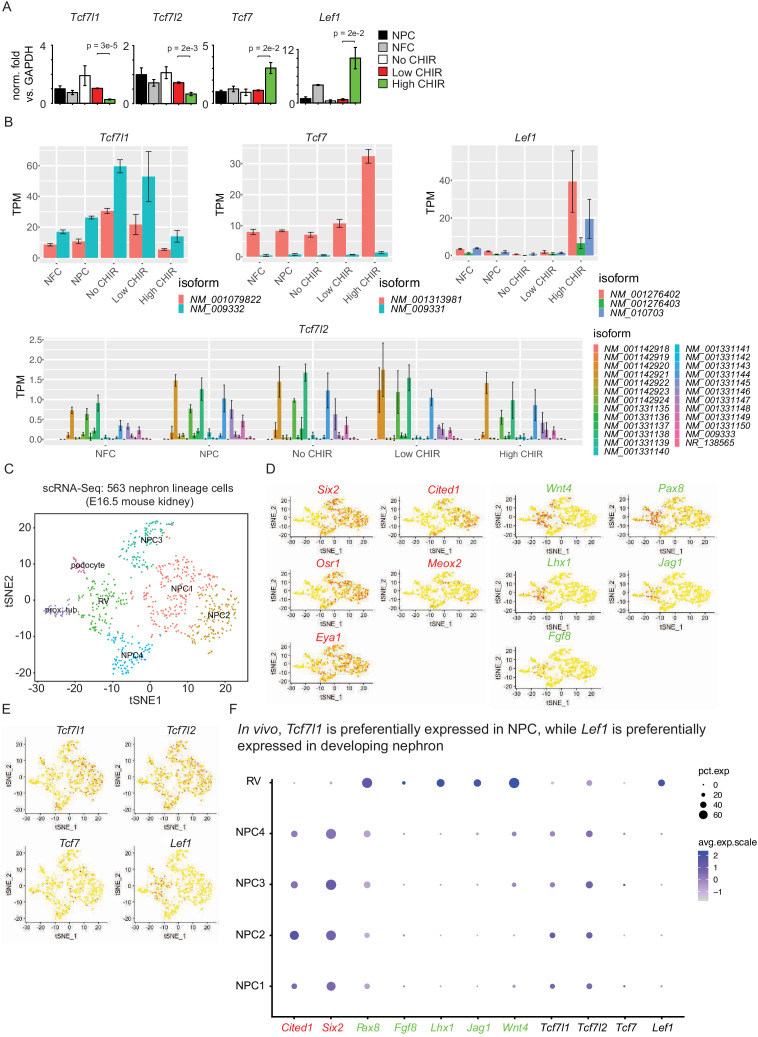
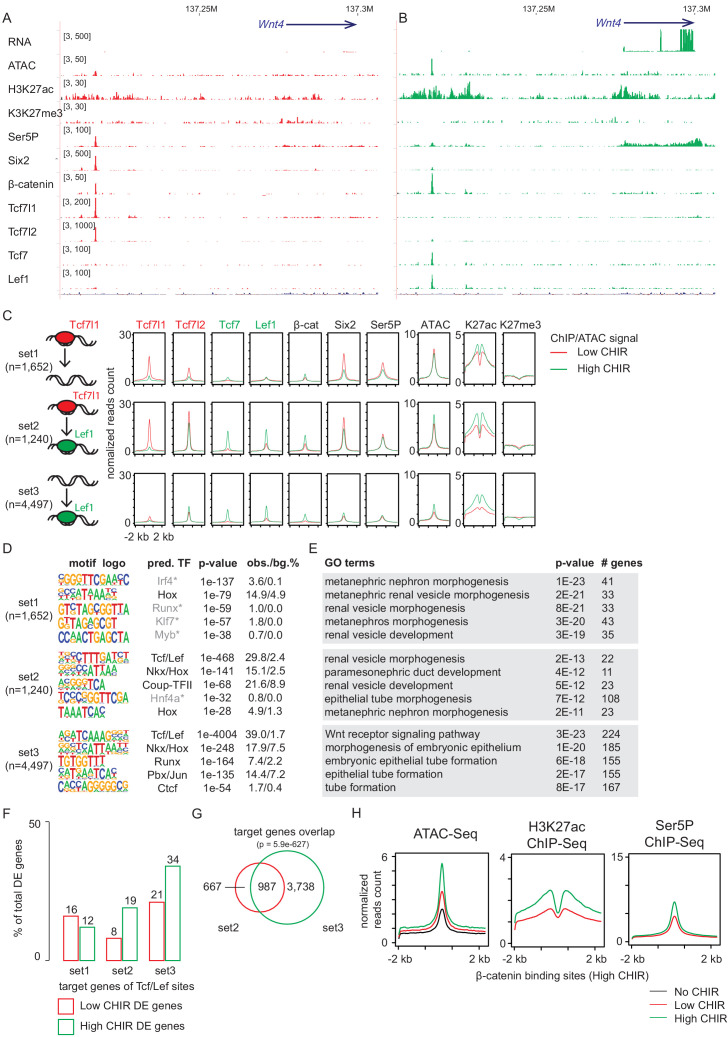
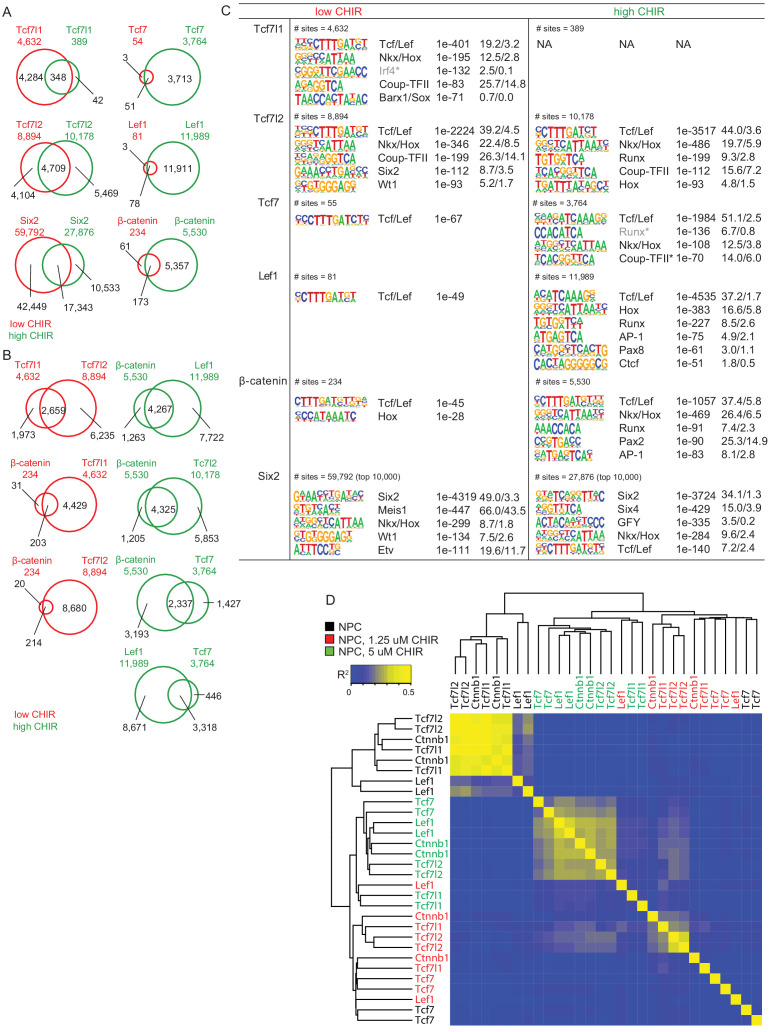
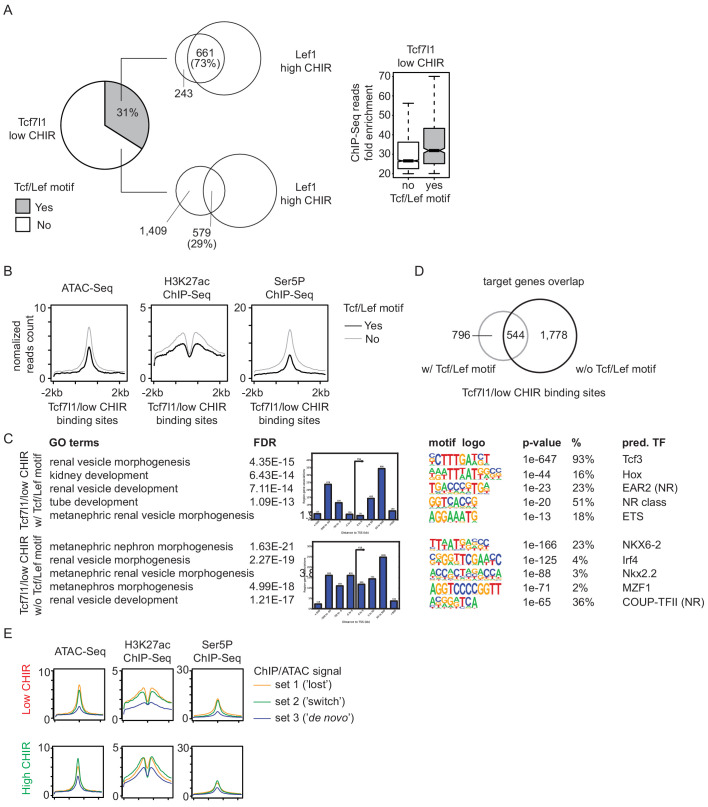
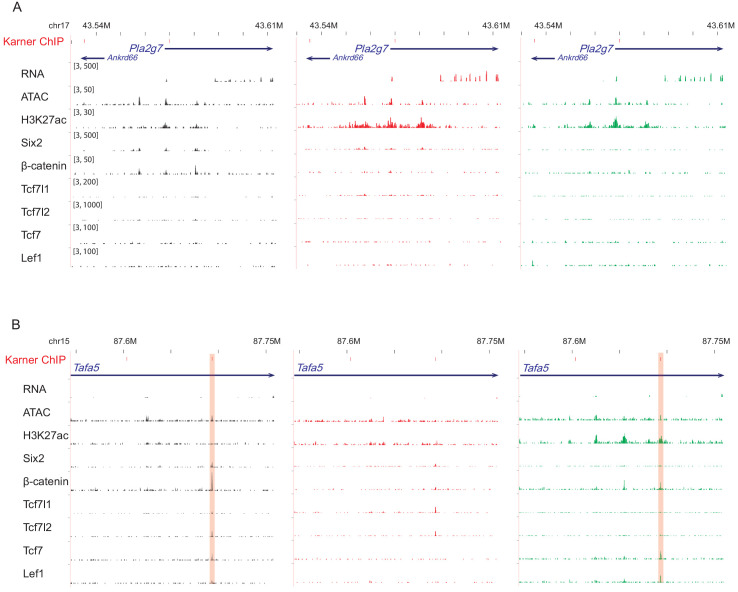
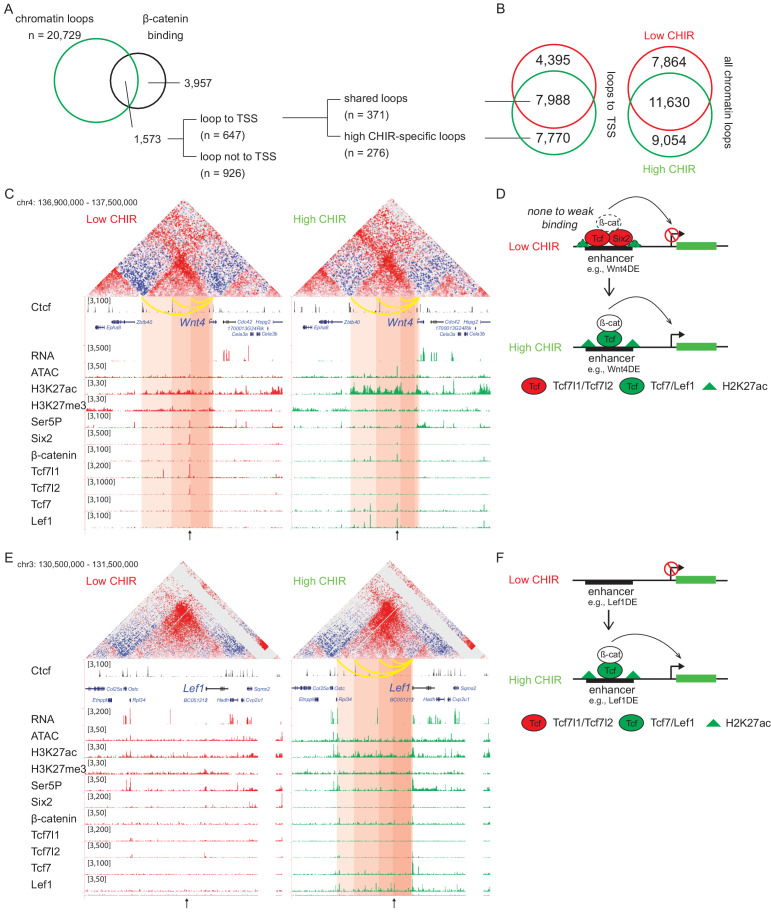
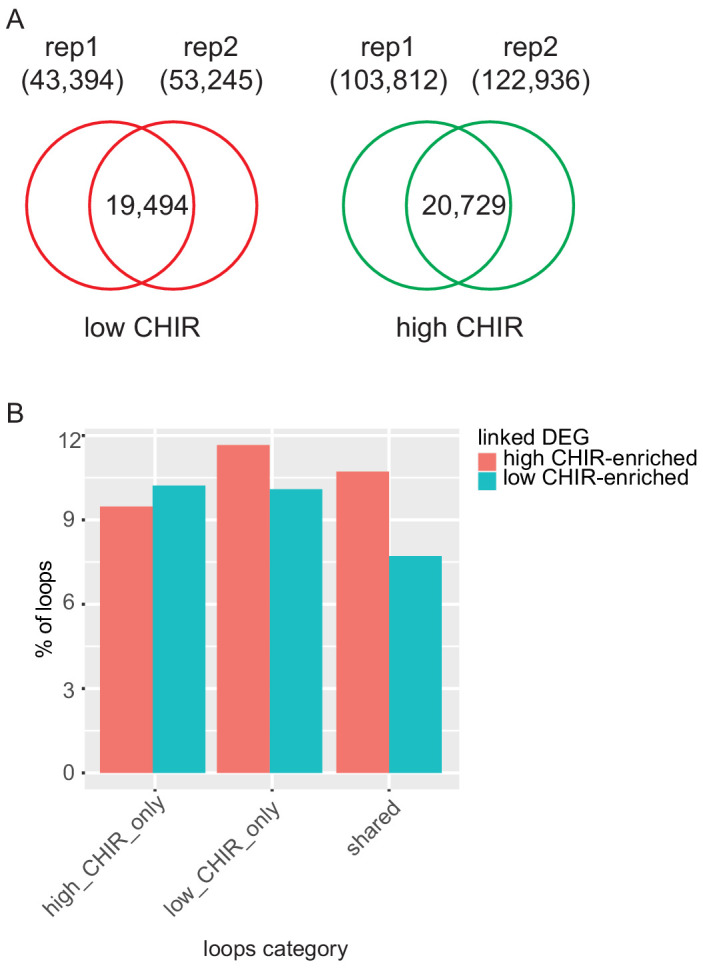
The canonical Wnt pathway transcriptional co-activator β-catenin regulates self-renewal and differentiation of mammalian nephron progenitor cells (NPCs). We modulated β-catenin levels in NPC cultures using the GSK3 inhibitor CHIR99021 (CHIR) to examine opposing developmental actions of β-catenin. Low CHIR-mediated maintenance and expansion of NPCs are independent of direct engagement of TCF/LEF/β-catenin transcriptional complexes at low CHIR-dependent cell-cycle targets. In contrast, in high CHIR, TCF7/LEF1/β-catenin complexes replaced TCF7L1/TCF7L2 binding on enhancers of differentiation-promoting target genes. Chromosome confirmation studies showed pre-established promoter-enhancer connections to these target genes in NPCs. High CHIR-associated de novo looping was observed in positive transcriptional feedback regulation to the canonical Wnt pathway. Thus, β-catenin's direct transcriptional role is restricted to the induction of NPCs, where rising β-catenin levels switch inhibitory TCF7L1/TCF7L2 complexes to activating LEF1/TCF7 complexes at primed gene targets poised for rapid initiation of a nephrogenic program.

Keywords: TCF/LEF factors; Wnt signaling; developmental biology; kidney development; mouse; stem cells; transcriptional regulation.


Conflict of interest statement

QG, AK, BL, AR, HB, XC, NL, AB, LO, BR, AM No competing interests declared

Figures

Figure 1.
Figure 1.. Nephron progenitor expansion medium (NPEM) supplemented with differential levels of CHIR99021 (CHIR) models nephron progenitor cell maintenance or differentiation in a plate.
(A) Immunofluorescence (IF) staining showing expression level of Six2, non-phospho (NP) β-catenin and Jag1 in nephron progenitor cell (NPC) cultured in NPEM supplemented with various CHIR dosages. (B) Relative intensity of IF signals from individual cells in experiment associated with A. (C) Heatmap/hierarchical cluster of expression levels of NPC signature, self-renewal, and differentiation marker genes. (D) Top five enriched Gene Ontology (GO) terms of indicated differentially expressed gene lists, analyzed by DAVID. Link to high-definition figure: https://www.dropbox.com/s/76chyrs07m0toen/Fig%201.pdf?dl=0.
Figure 1—figure supplement 1.
Figure 1—figure supplement 1.. Supplementary RNA-Seq data analysis.
(A) Overview of experiment design and data available (gray). (B) Bar plots show RT-qPCR measurement of relative expression of the indicated genes, as verification of results in Figure 1C. (C) Hierarchical cluster of R-square values between transcriptome-wide TPM of the indicated pair of replicate RNA-Seq data sets. (D) Top five enriched Gene Ontology (GO) terms of genes differentially expressed between low CHIR99021 (CHIR) condition and uncultured nephron progenitor cell (NPC). (E) Top five enriched GO terms of genes differentially expressed between low CHIR and no CHIR conditions. (F) Venn diagram shows overlap of β-catenin target genes with all genes associated to the GO term ‘cell cycle’ that are highly expressed in low CHIR versus no CHIR condition. (G) Heatmap and hierarchical cluster showing log2 relative TPM (TPM divided by mean across samples) to reflect change of gene expression (at isoform level) of Karner et al., 2011) class II genes (differentially expressed low CHIR > no CHIR or high CHIR > low CHIR) in our data set. The highlighted gene is supported by genetic evidence of regulation by β-catenin in the current data. (H) Immunofluorescence (IF) staining of SIX2 in unpurified NPC-free cortex (NFC) cells and NPC freshly purified from NFC; bar plots showing percentage of SIX2+ cells in the preps.
Figure 2.
Figure 2.. High dosage of CHIR99021 (CHIR) triggered change of nephron progenitor cell (NPC) epigenome.
(A, B) Genome browser view of RNA-Seq, ATAC-Seq, as well as Six2, H3K27ac, H3K27me3, and Ser5P ChIP-Seq data near Six2 (A) and Wnt4 (B) in low CHIR (left) and high CHIR (right) conditions. Black arrow indicates Six2DE and Wnt4DE, respectively. (C) Display of differentially accessible regions (DARs) generated by the indicated comparisons. (Left) Heatmaps showing log2 normalized read counts of top 500 most significant DARs; (middle) top five most significant Gene Ontology (GO) terms associated with the DARs; (right) top five most enriched motifs discovered de novo in the DARs; * indicates less well-conserved motifs for the factor. NFC: NPC-free cortex.
Figure 2—figure supplement 1.
Figure 2—figure supplement 1.. Supplementary ATAC-Seq data analysis.
(A) Hierarchical cluster of R-square values between normalized ATAC-Seq reads within merged peaks from all samples. (B) Histograms of distances from differentially accessible (DA) chromatin regions to transcriptional start site (TSS) implicate a predominant enhancer feature. CHIR: CHIR99021; NPC: nephron progenitor cell; NFC: NPC-free cortex.
Figure 3.
Figure 3.. Differential expression of TCF/LEF family transcription factors in nephron progenitor cell (NPC) in response to distinct level of CHIR99021 (CHIR).
(A) Bar plots showing RNA-Seq measured expression levels of TCF/LEF family factors in NPC cultured in nephron progenitor expansion medium (NPEM) culture supplemented with various concentrations of CHIR. (B) Immunofluorescence (IF) staining of TCF/LEF family factors in NPEM cultured with conditions indicated. (C) Relative intensity of IF signals from individual cells in experiment associated with B. Link to high-definition figure: https://www.dropbox.com/s/pvhu1ffhoujt39p/Fig%203.pdf?dl=0. NFC: NPC-free cortex.
Figure 3—figure supplement 1.
Figure 3—figure supplement 1.. Expression of TCF/LEF factors measured by immunoblots.
(A) Immunoblots of TCF/LEF family factors in nephron progenitor cell cultured in nephron progenitor expansion medium with the indicated treatment; red arrows indicate target band. (B) Quantification of target band intensity normalized to histone H3 intensity. CHIR: CHIR99021.
Figure 3—figure supplement 2.
Figure 3—figure supplement 2.. Supplementary evidence for differential expression of TCF/LEF factors.
(A) Bar plots show RT-qPCR measurement of relative expression of TCF/LEF family factors, as verification for results in Figure 3A. (B) Bar plots show expression of individual transcripts of TCF/LEF factors in our RNA-Seq data. (C) tSNE plot displaying unbiased cluster of nephron lineage cells profiled by single-cell RNA-Seq. (D) Feature plots displaying distribution of self-renewal (red) and differentiation (green) marker genes transcripts on the tSNE plot. (E) Feature plots showing distribution of TCF/LEF factors transcripts on the tSNE plot. (F) Dot plots showing accumulated expression level of marker genes as well as TCF/LEF factor in selected clusters of cells. NPC: nephron progenitor cell; NFC: NPC-free cortex; CHIR: CHIR99021.
Figure 4.
Figure 4.. Increased CHIR99021 (CHIR) dosage induces a switch of TCF/LEF factors binding to the genome.
(A, B) Genome browser view of Wnt4 enhancer locus showing ChIP-Seq signal of TCF/LEF factors in low and high CHIR conditions. (C) Histograms showing binding intensity of TCF/LEF factors and chromatin markers on the three sets of TCF/LEF binding sites assigned by overlap of low CHIR Tcf7l1 and high CHIR Lef1 binding sites. (D) Result from de novo motif discovery of the three sets of TCF/LEF binding sites described in A. (E) Top Gene Ontology (GO) terms associated with the corresponding sets of TCF/LEF binding sites shown in B. (F) Percentage of TCF/LEF target genes belonging to different sets in differential expressed genes specific to low CHIR or high CHIR conditions as described in Figure 1. (G) Venn diagram showing overlap of set 2 and 3 target genes assigned by GREAT (McLean et al., 2010). (H) Histograms showing quantification of reads from the indicated data sets in ±2 kb of β-catenin binding sites in high CHIR condition.
Figure 4—figure supplement 1.
Figure 4—figure supplement 1.. Supplementary ChIP-Seq data analysis.
(A) Numbers of and overlap between binding sites of the same factors between different conditions. (B) Numbers of and overlap between binding sites of different factors in the same conditions. (C) Most enriched motifs by de novo discovery (Homer) from binding sites of the data sets indicated. (D) Hierarchical clustering of normalized read counts of ChIP-Seq data sets on merged binding sites. NPC: nephron progenitor cell; CHIR: CHIR99021.
Figure 4—figure supplement 2.
Figure 4—figure supplement 2.. Analysis of Tcf7l1 binding in low CHIR99021 (CHIR).
(A) Overlap of direct and indirect Tcf7l1 binding in low CHIR with Lef1 binding in high CHIR (left) and enrichment of ChIP-Seq reads on the two types of binding events. (B) Distribution of ATAC-Seq, H3K27ac ChIP-Seq, and Ser5P ChIP-Seq signals on Tcf7l1 binding sites in low CHIR with or without TCF/LEF motifs. (C) Gene Ontology (GO) analysis by GREAT on Tcf7l1 binding sites in low CHIR with or without TCF/LEF motifs. (D) Overlap of predicted target genes between Tcf7l1 binding sites in low CHIR with or without TCF/LEF motifs. (E) Histograms showing intensities of ATAC-Seq or ChIP-Seq signals around set 1, 2, and 3 TCF/LEF binding sites in low CHIR and high CHIR conditions.
Figure 4—figure supplement 3.
Figure 4—figure supplement 3.. β-Catenin binding sites near (A) Pla2g7 and (B) Tafa5, two β-catenin target genes reported in Karner et al., 2011.
The ChIP-qPCR target sites were marked as red bins on the top track. The highlighted region is where our data is consistent with Karner’s.
Figure 5.
Figure 5.. β-Catenin activates gene expression through both stable and de novo enhancer–promoter loops.
(A) β-Catenin binding sites that overlap with an anchor of chromatin loop in high CHIR99021 (CHIR), the proportion that connects to a transcriptional start site (TSS) (gray in the pie chart) and segregation between two types of loops defined in B. (B) Overlap of chromatin loops between low CHIR and high CHIR conditions. Examples (C, E) and schematics (D, F) of β-catenin utilizing low/high CHIR-shared enhancer–promoter loops to activate Wnt4 (C, D) or high CHIR-specific loops to activate Lef1 (E, F). Black arrow at the bottom indicates the β-catenin binding sites involved in the loops.
Figure 5—figure supplement 1.
Figure 5—figure supplement 1.. Supplementary Hi-C data analysis.
(A) Reproducible loops between replicates. (B) Bar plots showing the percentage of loops in the corresponding category (high CHIR99021 [CHIR] only, low CHIR only or share) that are linked to differentially expressed genes (DEG) that are high in low CHIR or high CHIR.

Similar articles

Cited by

References

    1. Aberle H, Bauer A, Stappert J, Kispert A, Kemler R. beta-catenin is a target for the ubiquitin-proteasome pathway. The EMBO Journal. 1997;16:3797–3804. doi: 10.1093/emboj/16.13.3797. - DOI - PMC - PubMed
    1. Acebron SP, Karaulanov E, Berger BS, Huang YL, Niehrs C. Mitotic wnt signaling promotes protein stabilization and regulates cell size. Molecular Cell. 2014;54:663–674. doi: 10.1016/j.molcel.2014.04.014. - DOI - PubMed
    1. Adam RC, Yang H, Ge Y, Lien WH, Wang P, Zhao Y, Polak L, Levorse J, Baksh SC, Zheng D, Fuchs E. Temporal layering of signaling effectors drives chromatin remodeling during hair follicle stem cell lineage progression. Cell Stem Cell. 2018;22:398–413. doi: 10.1016/j.stem.2017.12.004. - DOI - PMC - PubMed
    1. Barker N, Hurlstone A, Musisi H, Miles A, Bienz M, Clevers H. The chromatin remodelling factor Brg-1 interacts with beta-catenin to promote target gene activation. The EMBO Journal. 2001;20:4935–4943. doi: 10.1093/emboj/20.17.4935. - DOI - PMC - PubMed
    1. Bertram JF, Douglas-Denton RN, Diouf B, Hughson MD, Hoy WE. Human nephron number: implications for health and disease. Pediatric Nephrology. 2011;26:1529–1533. doi: 10.1007/s00467-011-1843-8. - DOI - PubMed

Publication types

MeSH terms

Associated data