. 2021 Feb 15:10:e61951.
doi: 10.7554/eLife.61951.

α-Synuclein plasma membrane localization correlates with cellular phosphatidylinositol polyphosphate levels

Affiliations

α-Synuclein plasma membrane localization correlates with cellular phosphatidylinositol polyphosphate levels

Reeba Susan Jacob et al. Elife. .

Abstract

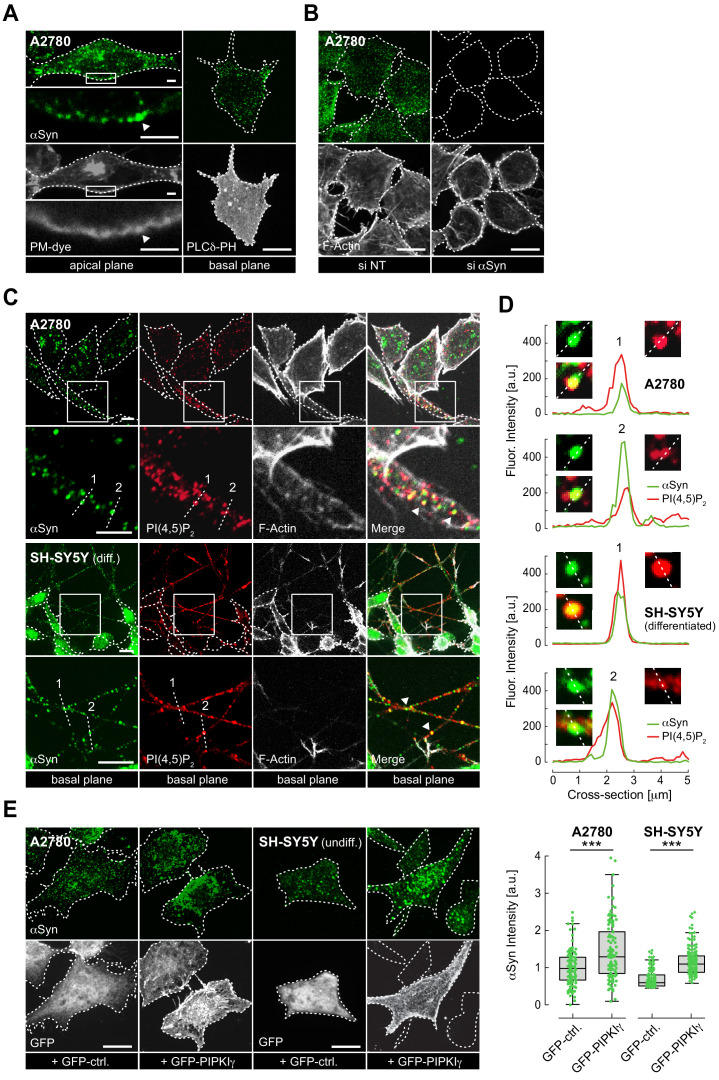
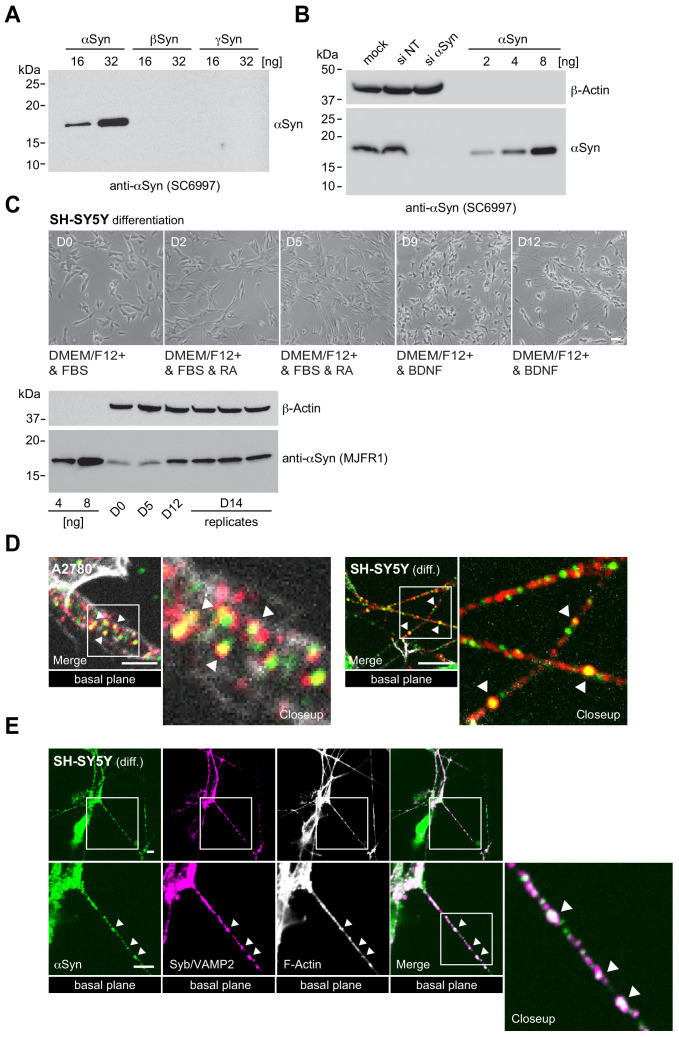
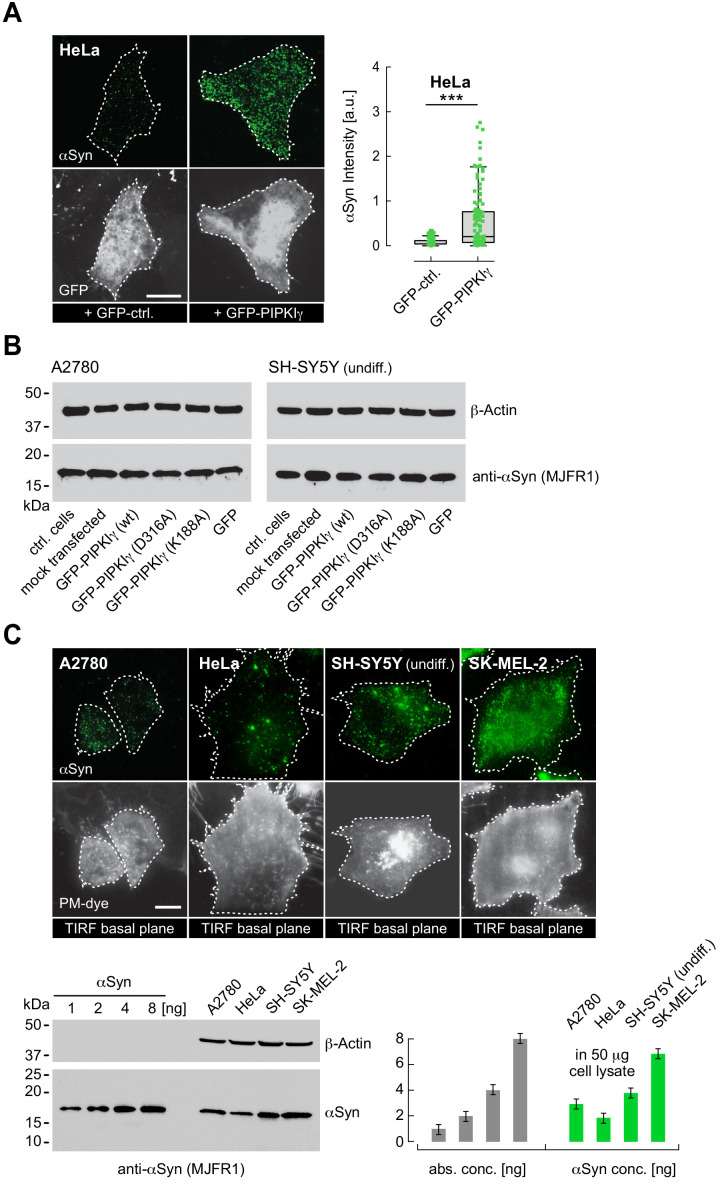
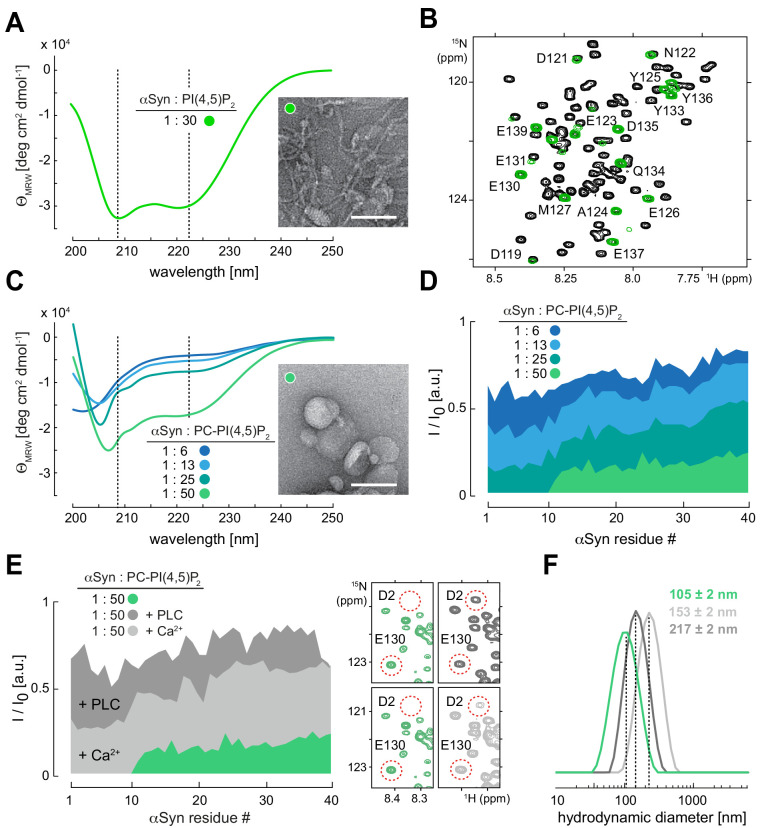
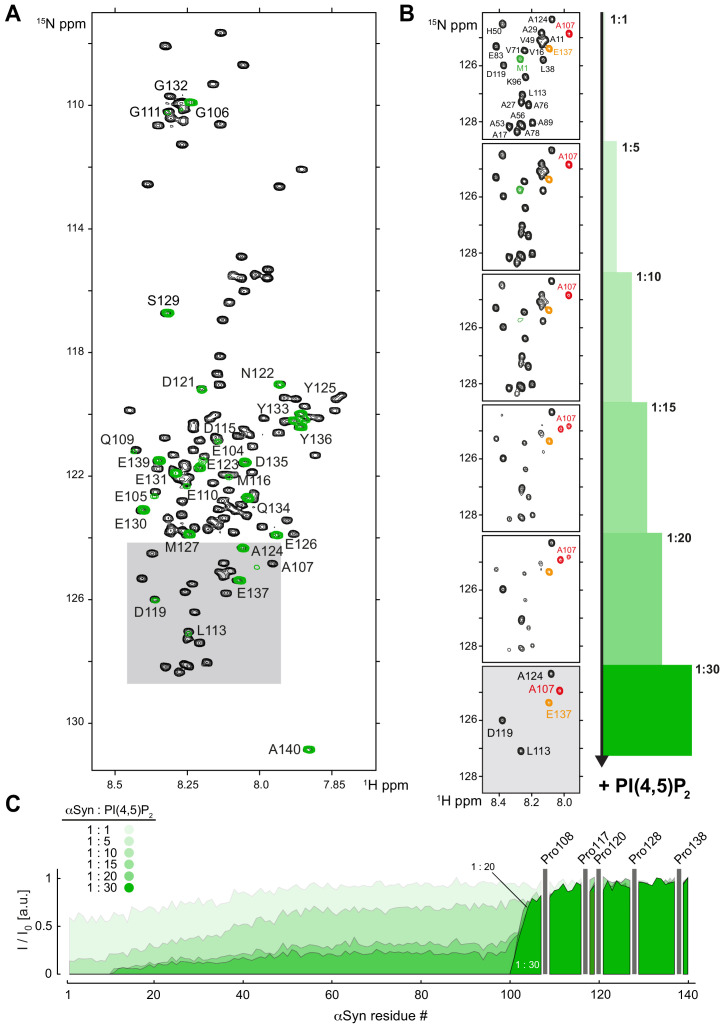
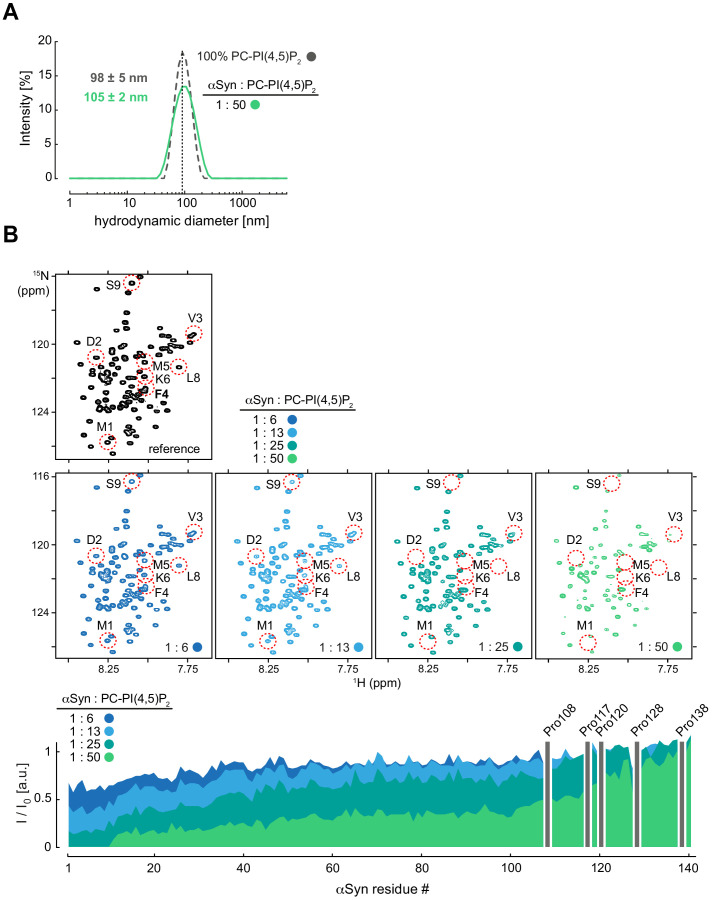
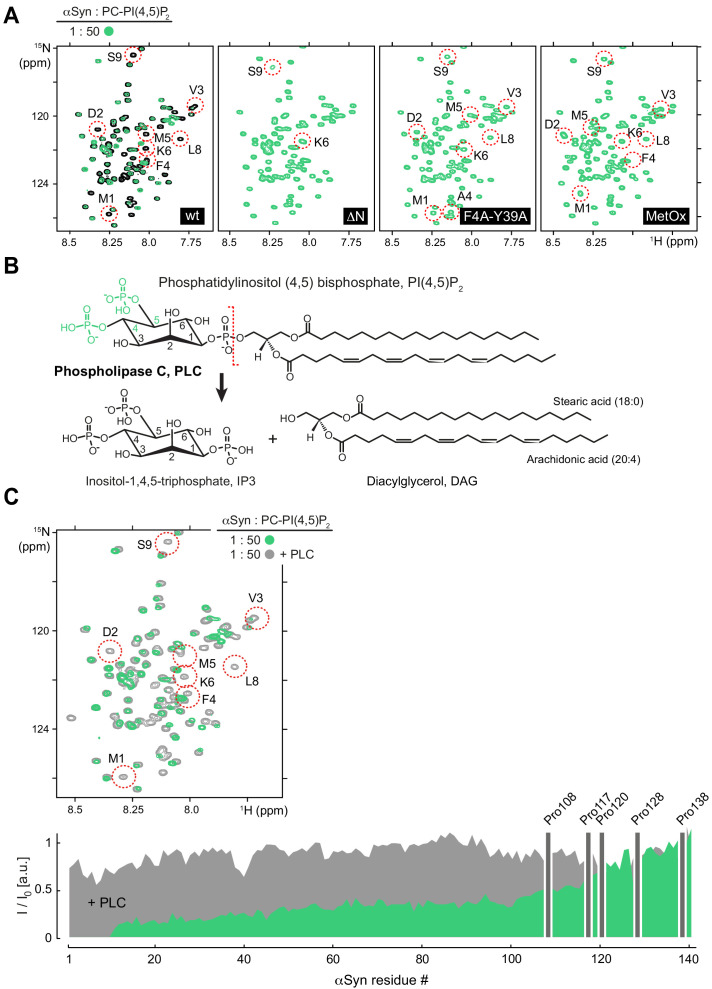
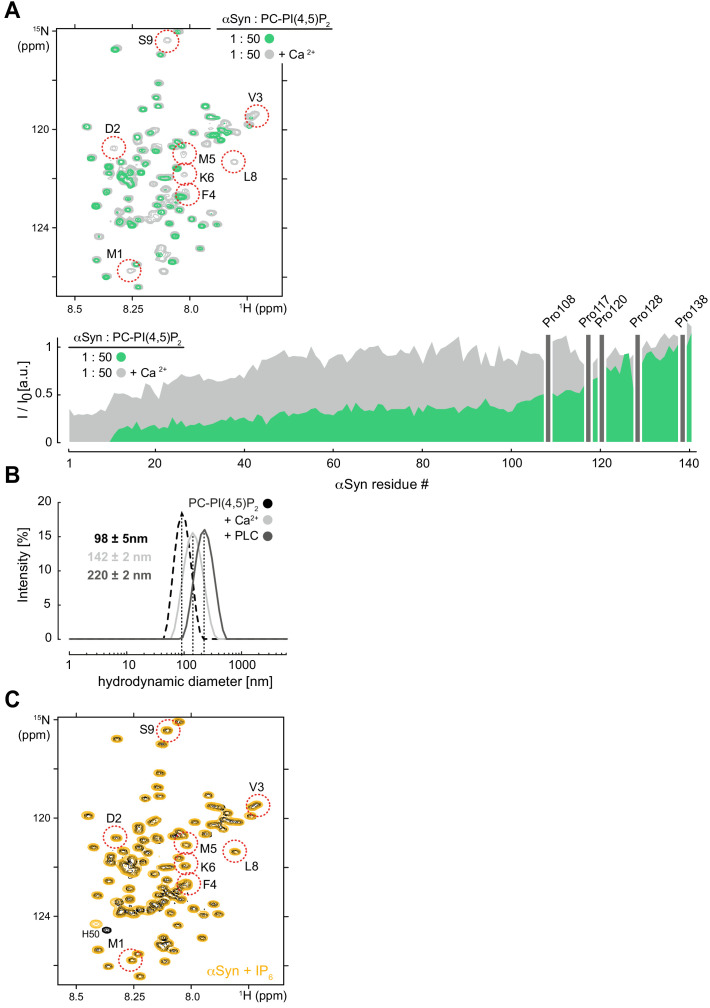
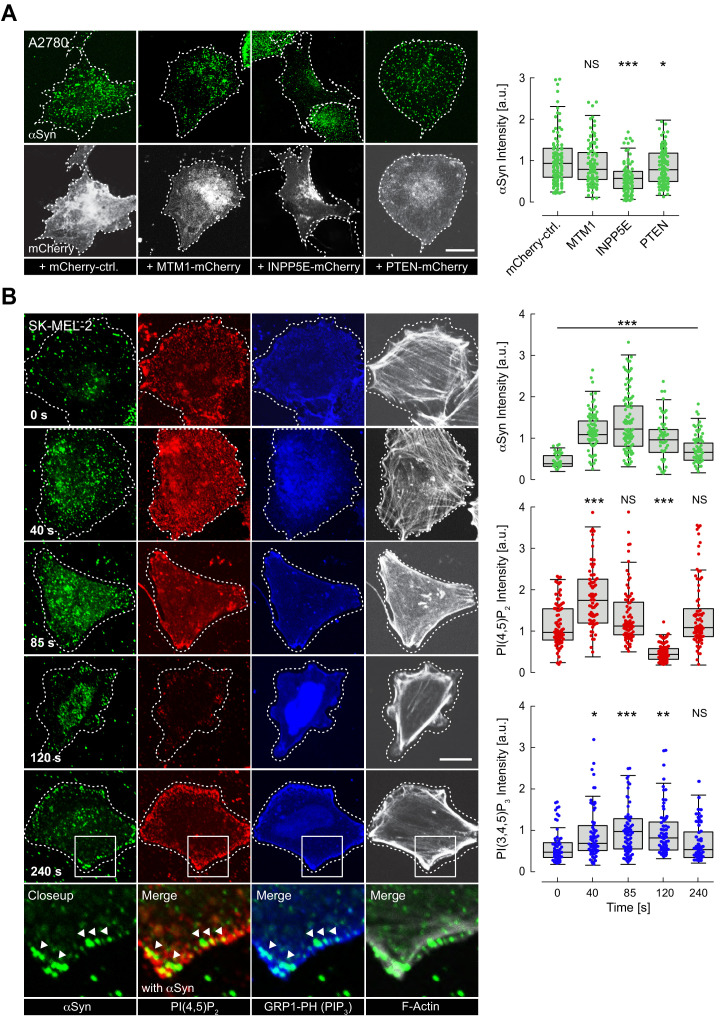
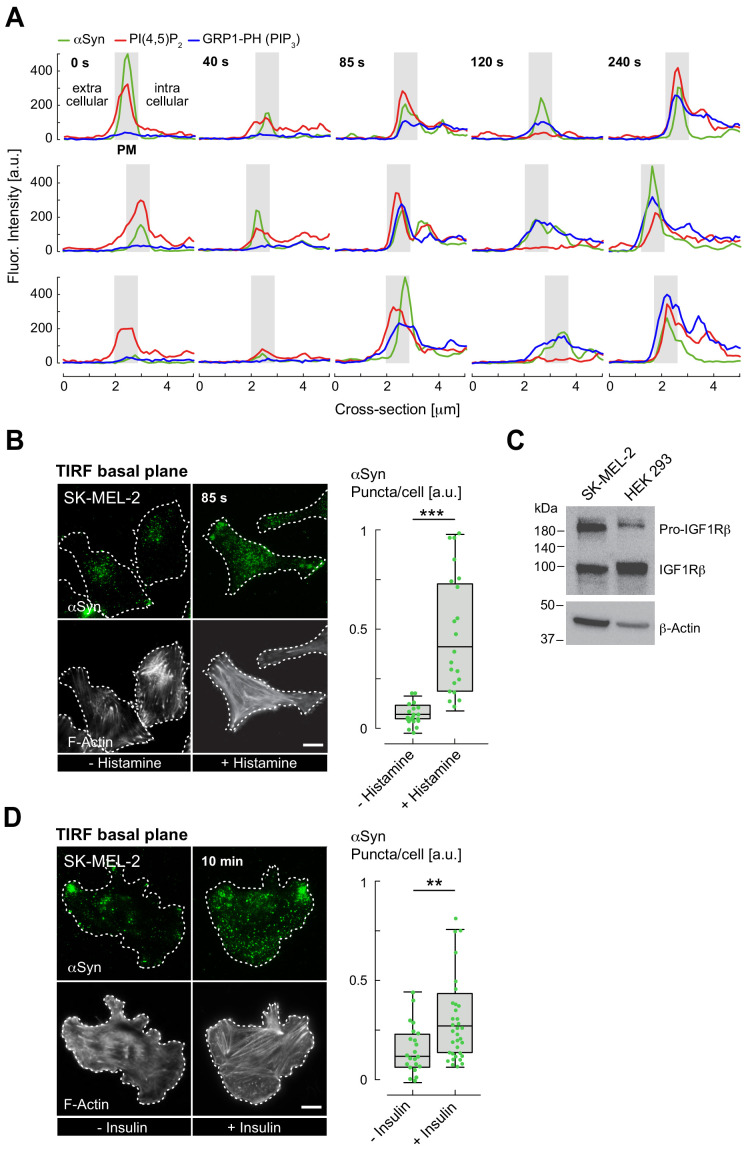
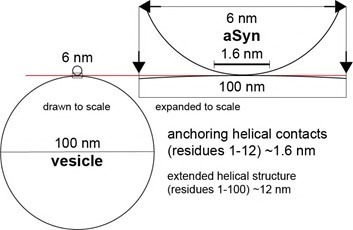
The Parkinson's disease protein α-synuclein (αSyn) promotes membrane fusion and fission by interacting with various negatively charged phospholipids. Despite postulated roles in endocytosis and exocytosis, plasma membrane (PM) interactions of αSyn are poorly understood. Here, we show that phosphatidylinositol 4,5-bisphosphate (PIP2) and phosphatidylinositol 3,4,5-trisphosphate (PIP3), two highly acidic components of inner PM leaflets, mediate PM localization of endogenous pools of αSyn in A2780, HeLa, SK-MEL-2, and differentiated and undifferentiated neuronal SH-SY5Y cells. We demonstrate that αSyn binds to reconstituted PIP2 membranes in a helical conformation in vitro and that PIP2 synthesizing kinases and hydrolyzing phosphatases reversibly redistribute αSyn in cells. We further delineate that αSyn-PM targeting follows phosphoinositide-3 kinase (PI3K)-dependent changes of cellular PIP2 and PIP3 levels, which collectively suggests that phosphatidylinositol polyphosphates contribute to αSyn's function(s) at the plasma membrane.

Keywords: A2780; HeLa; SH-SY5Y; SK-MEL-2; human cell lines; neuroscience.


Conflict of interest statement

RJ, CE, AD, DM, PS No competing interests declared

Figures

Figure 1.
Figure 1.. Plasma membrane (PM) localization of endogenous α-synuclein (αSyn).
(A) Immunofluorescence detection of endogenous αSyn in A2780 cells by confocal microscopy. PM stained with tetramethylrhodamine-wheat germ agglutinin (WGA) (left panel) or identified via GFP-PLCδ-PH (right panel). Representative apical and basal confocal planes are shown. Scale bars are 2 μm (left) and 10 μm (right). (B) αSyn-PM localization in A2780 cells following control (si NT) and targeted siRNA (si αSyn) knockdown. Phalloidin staining of F-actin marks cell boundaries. Scale bars are 10 μm. (C) Immunofluorescence detection of endogenous αSyn and phosphatidylinositol 4,5-bisphosphate (PIP2) at the PM in A2780 (top) and differentiated SH-SY5Y cells (bottom). Scale bars are 5 μm. (D) Spatially resolved αSyn (green) and PIP2 (red) fluorescence intensity profiles across the dotted lines in the closeup views. Resolved αSyn and PIP2 traces are marked with arrowheads. (E) αSyn-PM localization and quantification after transient green fluorescent protein (GFP) or GFP-PIPKIγ overexpression in A2780 and undifferentiated SH-SY5Y cells. GFP fluorescence identifies transfected cells. Scale bars are 10 μm. Box plots for αSyn immunofluorescence quantification. Data points represent n ~120 cells collected in four independent replicate experiments. Box dimensions represent the 25th and 75th percentiles, whiskers extend to the 5th and 95th percentiles. Data points beyond these values were considered outliers. Significance based on Student’s t tests as ∗∗∗p<0.001. See also Figure 1—source data 1.
Figure 1—figure supplement 1.
Figure 1—figure supplement 1.. αSyn siRNA knockdown, differentiation of SH-SY5Y cells and αSyn, PI(4,5)P2 and synaptobrevin 2/VAMP2 colocalization.
(A) Western blot to determine the specificity of the α-synuclein (αSyn) antibody (sc69977) against β and γ isoforms of the protein. (B) Western blot of A2780 lysates of control (si NT) and targeted siRNA (si αSyn) knockdown cells. Recombinant N-terminally acetylated αSyn serves as input, β-actin as loading controls. See also Figure 1—figure supplement 1—source data 1. (C) Bright field microscopy images of the SH-SY5Y differentiation time course upon retinoic acid treatment (5 days) followed by brain-derived neurotrophic factor (BDNF) stimulation (7 days). Respective days (D0 to D12) are indicated. Western blot of endogenous αSyn concentrations in SH-SY5Y lysates during the differentiation time course with recombinant αSyn as input, β-actin as loading controls. See also Figure 1—figure supplement 1—source data 2. (D) Closeup views of αSyn-PIP2 colocalizations in A2780 (left) and differentiated SH-SY5Y cells (right) as in Figure 1B. Arrowheads mark prominent sites. (E) Colocalization of αSyn and synaptobrevin-2/VAMP2 in neurites of day 14 differentiated SH-SY5Y cells. Scale bar is 10 μm. PIP2: phosphatidylinositol 4,5-bisphosphate. DMEM: Dulbecco's modified eagle medium. FBS: Fetal bovine serum. RA: Retinoic acid.
Figure 1—figure supplement 2.
Figure 1—figure supplement 2.. αSyn PM localization in A2780, HeLa, undifferentiated SH-SY5Y and SK-MEL-2 cells.
(A) Immunofluorescence localization and quantification of endogenous α-synuclein (αSyn) in HeLa cells transfected with green fluorescent protein (GFP) or GFP-PIPKIγ. Scale bar is 10 μm. Box plots for αSyn immunofluorescence quantification. Data points represent n ~ 120 cells collected in four independent replicate experiments. Box dimensions represent the 25th and 75th percentiles, whiskers extend to the 5th and 95th percentiles. Data points beyond these values were considered outliers. Significance based on Student’s t tests as ∗∗∗p<0.001. See also Figure 1—figure supplement 2—source data 1. (B) Lysate western blots of endogenous αSyn in A2780 and undifferentiated SH-SY5Y cells transiently transfected with indicated PIPKIγ expression plasmids. Control (ctrl), mock and GFP-only transfected cells serve as baseline controls. Wild-type (WT) and kinase-inactive D316A- and K188A-PIPKIγ mutants were used to assess possible differences between kinase activity versus PM-targeting effects on αSyn levels. See also Figure 1—figure supplement 2—source data 2. (C) Total internal reflection fluorescence (TIRF) microscopy of αSyn-PM localization in A2780, HeLa, SH-SY5Y and SK-MEL-2 cells. Plasma membrane (PM) stained with tetramethylrhodamine-wheat germ agglutinin (WGA). Scale bars are 10 μm. Western blot of endogenous αSyn in respective cell lysates. Recombinant N-terminally acetylated αSyn serves as input, β-actin as loading controls. Bar graphs denote western blot quantifications of αSyn with signals normalized against β-actin. Error bars denote standard deviations based on measured background. See also Figure 1—figure supplement 2—source data 3.
Figure 2.
Figure 2.. α-Synuclein (αSyn) binding to reconstituted phosphatidylinositol 4,5-bisphosphate (PIP2) vesicles.
(A) Circular dichroism (CD) spectrum and negative-stain electron micrograph of αSyn-bound PIP2 vesicles (100%). Scale bar is 100 nm. (B) Overlay of 2D 1H-15N nuclear magnetic resonance (NMR) spectra of isolated αSyn in buffer (black) and bound to PIP2 vesicles (green). Remaining signals of C-terminal αSyn residues are labeled. (C) CD spectra of αSyn bound to phosphatidylcholine (PC)-PIP2 vesicles at increasing lipid-to-protein ratios (inset) and negative-stain electron micrograph of the αSyn:PC-PIP2 (1:50 protein:PIP2) sample. Scale bar is 100 nm. (D) NMR signal intensity ratios of bound (I) over unbound (I0) αSyn in the presence of different amounts of PC-PIP2 vesicles (equivalent to (C)). Only residues 1–40 are shown. (E) I/I0 of PC-PIP2 bound αSyn at 1:50 (green) and after addition of phospholipase C (PLC) (dark gray) and Ca2+ (light gray). Selected regions of 2D 1H-15N NMR spectra of PC-PIP2 bound αSyn (left, green) and in the presence of PLC (top right, dark gray) and Ca2+ (bottom right, light gray). Release of N-terminal αSyn residues from vesicles and reappearance of corresponding NMR signals are indicated for Asp2 (D2) as an example. (F) Hydrodynamic diameters of αSyn-bound PC-PIP2 vesicles before (green) and after PLC (dark gray) and Ca2+ (light gray) addition by dynamic light scattering. Errors were calculated based on measurements on three independent replicate samples.
Figure 2—figure supplement 1.
Figure 2—figure supplement 1.. NMR characterization of αSyn binding to reconstituted PI(4,5)P2 vesicles.
(A) Overlay of 2D 1H-15N nuclear magnetic resonance (NMR) spectra of isolated, N-terminally acetylated α-synuclein (αSyn) (black) and bound to a 30-fold molar excess of phosphatidylinositol 4,5-bisphosphate (PIP2)-only vesicles (green). Uniform signal broadening of N-terminal residues 1–100 is evident. Observable C-terminal αSyn signals are labeled. (B) Selected region of 2D 1H-15N NMR spectra of αSyn upon addition of increasing amounts of PIP2-only vesicles, corresponding to molar protein:lipid ratios of 1:1, 1:5, 1:10, 1:15, 1:20 and 1:30, with Met1 (M1) labeled in green and Glu137 (E137) indicated in orange. Note that Ala107 (A107, red) at the border between membrane-bound (N-terminal) and -unbound (C-terminal) αSyn residues displays peak-splitting at increasing PIP2 concentrations, indicative of chemical shift differences between free and membrane-bound protein states. (C) Residue-resolved signal attenuation profiles (I/I0) of free (I0) versus PIP2 bound αSyn (I) at previously indicated molar ratios. Positions of C-terminal αSyn proline residues without peptide amide resonances are shown in the three-letter amino acid code. See also Figure 2—figure supplement 1—source data 1.
Figure 2—figure supplement 2.
Figure 2—figure supplement 2.. NMR characterization of αSyn binding to reconstituted PC-PI(4,5)P2 vesicles.
(A) Hydrodynamic diameters of phosphatidylcholine-phosphatidylinositol 4,5-bisphosphate (PC-PIP2) vesicles in the absence (dashed gray) and presence of α-synuclein (αSyn) (green) at a protein:lipid ratio of 1:50 by dynamic light scattering . Errors were calculated based on measurements of three independent replicate samples. (B) Selected regions of 2D 1H-15N nuclear magnetic resonance (NMR) spectra of isolated, N-terminally acetylated αSyn (black) and in the presence of 6, 13, 25 and 50 mol equivalents of PC-PIP2 vesicles (blue to green). Site-selective line broadening of N-terminal residues 1–9 is highlighted. Residue-resolved signal attenuation profiles (I/I0) of free (I0) versus PC-PIP2 bound αSyn (I) at previously indicated molar ratios. Positions of C-terminal αSyn proline residues without peptide amide resonances are shown in the three-letter amino acid code. See also Figure 2—figure supplement 2—source data 1.
Figure 2—figure supplement 3.
Figure 2—figure supplement 3.. NMR characterization of mutant αSyn binding to reconstituted PC-PI(4,5)P2 vesicles and upon phospholipase C (PLC) treatment.
(A) Selected regions of 2D 1H-15N nuclear magnetic resonance (NMR) spectra. Left to right: Overlay of isolated, N-terminally acetylated wild-type (WT) α-synuclein (αSyn) and bound to phosphatidylcholine-phosphatidylinositol 4,5-bisphosphate (PC-PIP2) vesicles at a protein:lipid ratio of 1:50 (green). NMR spectra of N-terminally truncated αSyn lacking residues 1–4 (ΔN), mutated (F4A-Y39A), and methionine-oxidized (MetOx) αSyn in the presence of PC-PIP2 vesicles (1:50). (B) Chemical structures and reaction scheme of phospholipase C (PLC)-mediated PIP2 hydrolysis. (C) Overlay of selected regions of 2D 1H-15N NMR spectra of αSyn bound to PC-PIP2 vesicles (1:50) before (green) and after PLC hydrolysis (dark gray). N-terminal residues 1–9 are highlighted. Corresponding residue-resolved signal attenuation profiles (I/I0) of free versus PC-PIP2 vesicle-bound αSyn before (green) and after PLC hydrolysis (dark gray). Positions of C-terminal αSyn proline residues without peptide amide resonances are shown in the three-letter amino acid code. See also Figure 2—figure supplement 3—source data 1.
Figure 2—figure supplement 4.
Figure 2—figure supplement 4.. NMR characterization of αSyn binding to reconstituted PC-PI(4,5)P2 vesicles in the presence of Ca and inositol polyphosphate (IP6) interaction.
(A) Overlay of 2D 1H-15N nuclear magnetic resonance (NMR) spectra of phosphatidylcholine-phosphatidylinositol 4,5-bisphosphate (PC-PIP2) vesicle-bound α-synuclein (αSyn) in the absence (green) and presence of Ca2+ (light gray). Residue-resolved NMR signal intensity ratios (I/I0) of free versus PC-PIP2 vesicle-bound αSyn with (light gray) and without Ca2+ (green). Positions of C-terminal αSyn proline residues without peptide amide resonances are shown in the three-letter amino acid code. See also Figure 2—figure supplement 4—source data 1. (B) Hydrodynamic diameters of PC-PIP2 vesicles (dashed black) and in the presence of Ca2+ (light gray) or phospholipase C (PLC) (dark gray) by dynamic light scattering . Errors were calculated based on measurements of three independent replicate samples. (C) Overlay of 2D 1H-15N NMR spectra of αSyn (black) and in the presence of a fourfold molar excess of free inositol polyphosphate (IP6, orange). N-terminal residues 1–9 are highlighted. Slight changes in sample pH toward a more acidic value are indicated by the chemical shift change of His50 (H50).
Figure 3.
Figure 3.. Reversible α-synuclein (αSyn)-plasma membrane (PM) localization.
(A) Representative immunofluorescence localization of αSyn at basal A2780 PM planes by confocal microscopy. Cells transiently expressing PM-targeted, mCherry-tagged phosphatidylinositol phosphate (PIP) phosphatases, with mCherry fluorescence indicating successful transfection and phosphatase expression. Mutant, phosphatase-inactive INPP4A-mCherry-CAAX serves as the negative control (mCherry-ctrl, first panel). Scale bar is 10 μm. Box plots of αSyn immunofluorescence quantifications are shown on the right. Approximately 120 data points were collected per cell in four independent replicate experiments. Box dimensions represent the 25th and 75th percentiles, whiskers extend to the 5th and 95th percentiles. Data points beyond these values were considered outliers. Significance based on analysis of variance (ANOVA) tests with Bonferroni’s post-tests as NS >0.05; ∗p<0.05; ∗∗∗p<0.001. See also Figure 3—source data 1. (B) Time-course experiments following histamine stimulation of SK-MEL-2 cells transiently expressing histamine 1 receptor (H1R) and GRP1-PH. Immunofluorescence detection of endogenous phosphatidylinositol 4,5-bisphosphate (PIP2) and αSyn by confocal microscopy of basal PM regions. GRP1-PH GFP-signals report on the presence of PIP3. Phalloidin staining of F-actin marks cell boundaries. Scale bar is 10 μm. Box plots represent data points collected per cell (n ~ 80) from a single experiment, but representative of three independent experiments with similar results. Significance based on ANOVA tests with Bonferroni’s post-tests as NS >0.05; ∗p<0.05; ∗∗p<0.01; ∗∗∗p<0.001. See also Figure 3—source data 1.
Figure 3—figure supplement 1.
Figure 3—figure supplement 1.. Dynamic αSyn plasma-membrane (PM) localization upon histamine and insulin stimulation.
(A) Spatially resolved fluorescence intensity profiles of α-synuclein (αSyn, green), phosphatidylinositol 4,5-bisphosphate (PIP2,red), and GRP1-PH (PIP3, blue) at the plasma membrane (PM) at indicated time points following histamine stimulation. Individual traces span extracellular and intracellular portions of analyzed cells. PM regions are indicated by gray boxes. (B, D) Immunofluorescence localization of endogenous αSyn in SK-MEL-2 cells by total internal reflection (TIRF) microscopy counterstained with Phalloidin for F-actin to mark cell boundaries. Cells were stimulated with histamine (B) or insulin (D). Quantification of αSyn signals at basal PM regions with and without stimulation shown on the right. Box plots represent data points collected from n~120 cells combined from three independent replicate experiments. Significance based on Student’s t tests as ∗∗p<0.01; ∗∗∗p<0.001. Scale bars are 10 μm. See also Figure 3—figure supplement 1—source data 1 and 3. (C) Western blot of SK-MEL-2 and HEK 293 cell lysates showing the presence of endogenous insulin-like growth factor-1 receptor β (IGF-1 Rβ). β-Actin serves as loading control. See also Figure 3—figure supplement 1—source data 2. PIP3: phosphatidylinositol 3,4,5-trisphosphate.
Author response image 1.

References

    1. Armstrong RA. When to use the Bonferroni correction. Ophthalmic and Physiological Optics. 2014;34:502–508. doi: 10.1111/opo.12131. - DOI - PubMed
    1. Balla T. Inositol-lipid binding motifs: signal integrators through protein-lipid and protein-protein interactions. Journal of Cell Science. 2005;118:2093–2104. doi: 10.1242/jcs.02387. - DOI - PubMed
    1. Balla T. Phosphoinositides: tiny lipids with giant impact on cell regulation. Physiological Reviews. 2013;93:1019–1137. doi: 10.1152/physrev.00028.2012. - DOI - PMC - PubMed
    1. Bartels T, Ahlstrom LS, Leftin A, Kamp F, Haass C, Brown MF, Beyer K. The N-terminus of the intrinsically disordered protein α-synuclein triggers membrane binding and Helix folding. Biophysical Journal. 2010;99:2116–2124. doi: 10.1016/j.bpj.2010.06.035. - DOI - PMC - PubMed
    1. Berridge MJ, Irvine RF. Inositol trisphosphate, a novel second messenger in cellular signal transduction. Nature. 1984;312:315–321. doi: 10.1038/312315a0. - DOI - PubMed

Publication types

MeSH terms

Substances