. 2021 Feb 15:10:e60681.
doi: 10.7554/eLife.60681.

SNPC-1.3 is a sex-specific transcription factor that drives male piRNA expression in C. elegans

Affiliations

SNPC-1.3 is a sex-specific transcription factor that drives male piRNA expression in C. elegans

Charlotte P Choi et al. Elife. .

Abstract

Piwi-interacting RNAs (piRNAs) play essential roles in silencing repetitive elements to promote fertility in metazoans. Studies in worms, flies, and mammals reveal that piRNAs are expressed in a sex-specific manner. However, the mechanisms underlying this sex-specific regulation are unknown. Here we identify SNPC-1.3, a male germline-enriched variant of a conserved subunit of the small nuclear RNA-activating protein complex, as a male-specific piRNA transcription factor in Caenorhabditis elegans. SNPC-1.3 colocalizes with the core piRNA transcription factor, SNPC-4, in nuclear foci of the male germline. Binding of SNPC-1.3 at male piRNA loci drives spermatogenic piRNA transcription and requires SNPC-4. Loss of snpc-1.3 leads to depletion of male piRNAs and defects in male-dependent fertility. Furthermore, TRA-1, a master regulator of sex determination, binds to the snpc-1.3 promoter and represses its expression during oogenesis. Loss of TRA-1 targeting causes ectopic expression of snpc-1.3 and male piRNAs during oogenesis. Thus, sexually dimorphic regulation of snpc-1.3 expression coordinates male and female piRNA expression during germline development.

Keywords: C. elegans; TRA-1; chromosomes; gene expression; genetics; genomics; germline development; piRNA; sex determination; spermatogenesis; transcription.


Conflict of interest statement

CC, RT, MS, SF, JM, BM, EX, MH, MS, TM, JY, SJ, JK No competing interests declared

Figures
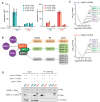
Figure 1.
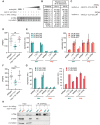
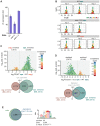
Figure 1.. SNPC-4 and SNPC-1.3 are part of the male piRNA transcription complex.
(A) SNPC-4 is required for both male and female piRNA expression. Taqman qPCR of male (left) and female (right) piRNAs normalized to U18 small nucleolar RNA in snpc-4::aid (denoted as ‘−’) and snpc-4::aid; Psun-1::TIR1 (denoted as ‘+’) worms. Both genotypes were placed on auxin, and collected during spermatogenesis (spe., 48 hr) and oogenesis (oog., 72 hr). Error bars: ± SD from two technical replicates. (B) Schematic highlights the conservation of SNAPc homologs from C. elegans, D. melanogaster, and H. sapiens and catalogs all SNPC-4 (orange) interacting partners from previous work (Weick et al., 2014; Weng et al., 2019) or from our own analysis. Known piRNA biogenesis factors (purple), SNPC-1 paralogs (green), and SNPC-3 paralogs (gray) are indicated. (C) SNPC-1.3 interacts with SNPC-4 in only him-8(-) mutants. Volcano plots showing enrichment values of IP of SNPC-4 over control (control: him-8(-) mutants for top panel or fem-1(-) mutants for bottom panel) and analogous significance values for proteins that co-purified with SNPC-4::3xFlag from (top) him-8(-) mutants or (bottom) fem-1(-) mutants (n = 2 biological replicates). piRNA biogenesis factors (purple), SNPC-1 paralogs (green), and SNPC-3 paralogs (dark gray) are labeled in (B). Although SNPC-3.1 and SNPC-3.2 are reported to have the same amino acid sequence, we have picked up differential peptide coverage in the fem-1(-) mutant for these two proteins and represented them as two different data points. (D) SNPC-4 interacts with SNPC-1.3. Anti-Flag immunoprecipitation of SNPC-4::3xFlag and western blot for SNPC-1.3::Ollas during spermatogenesis (spe.) and oogenesis (oog.). PRDE-1::Ollas was used as a positive control for interaction with SNPC-4::3xFlag (Kasper et al., 2014). γ-Tubulin was used as the loading control.
Figure 1—figure supplement 1.
Figure 1—figure supplement 1.. Validation of strains and mass spectrometry.
(A) SNPC-4::AID is substantially degraded at 250 µM auxin in the germline. Western blot of SNPC-4::AID::Ollas in worms placed on various auxin concentrations (0, 25, 50, 100, 250, 500, 1000 µM) for 1 hr. The germline promoter Psun-1 was used to drive expression of the A. thaliana TIR1. γ-Tubulin is the loading control. (B) Table showing the peptide counts of SNAPc homologs and piRNA biogenesis proteins from the first biological replicate in immunopurified samples of SNPC-4::3xFlag identified by mass spectrometry of immunopurified SNPC-4::3xFlag from fem-1(-) and him-8(-) strains. (C) Schematic of snpc-1.3 locus showing the location of the two different isoform-specific tags. (D) snpc-1.3a::3xflag strain has wild-type fertility at 25°C. Black bars indicate mean ± SD of n = 10 worms (wild type versus snpc-1.3(-) mutant **p≤0.005, Welch’s t-test). (E) snpc-1.3a::3xflag strain has wild-type levels of male and female piRNAs during spermatogenesis and oogenesis. 1.3(-) denotes snpc-1.3(-). 1.3a::3xflag denotes snpc-1.3a::3xflag. Error bars: ± SD from two technical replicates. (F) snpc-1.3b::3xflag strain has wild-type fertility at 25°C. Black bars indicate mean ± SD of n = 10 worms (wild type versus snpc-1.3(-) mutant ***p≤0.0001, Welch’s t-test). (G) snpc-1.3b::3xflag strain has wild-type levels of male and female piRNAs during spermatogenesis and oogenesis. 1.3(-) denotes snpc-1.3(-). 1.3b::3xflag denotes snpc-1.3b::3xflag. Error bars: ± SD from two technical replicates. (H) SNPC-1.3 interacts with SNPC-4. Reciprocal immunoprecipitation of Figure 1D. Anti-Flag immunoprecipitation of SNPC-1.3::3xFlag and western blot of SNPC-4::Ollas during spermatogenesis and oogenesis. γ-Tubulin is the loading control.
Figure 2.
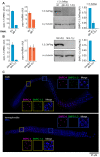
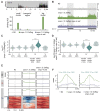
Figure 2.. SNPC-1.3 is enriched in the male germline.
(A) SNPC-1.3 is predominantly germline-expressed. (Left) snpc-1.3 mRNA expression is reduced upon RNAi-mediated knockdown of glp-1 during early spermatogenesis (36 hr). The housekeeping gene eft-2 was used for normalization. Error bars: ± SD of two technical replicates. (Right) Western blot and quantification of SNPC-1.3::3xFlag in wild type, glp-4(-), and snpc-1.3(-) (no-Flag control) during spermatogenesis. Error bars: ± SD of two biological replicates. γ-Tubulin was used as the loading control. (B) SNPC-1.3 is more highly expressed in males. (Left) snpc-1.3 mRNA expression is dramatically enriched in him-8(-) males over fem-1(-) females during spermatogenesis, whereas snpc-4 mRNA expression shows no specific enrichment. eft-2 was used for normalization. Error bars: ± SD of two technical replicates. (Right) Western blot and quantification of SNPC-1.3::3xFlag in him-8(-) and fem-1(-). Error bars: ± SD of two biological replicates. γ-Tubulin was used as the loading control. (C) SNPC-1.3 colocalizes with SNPC-4 in the male germline. Dissected adult male (top) and hermaphrodite (bottom) germlines stained for DNA, SNPC-4::3xFlag (magenta) and SNPC-1.3::Ollas (green) in a N2 background. Yellow insets: transition zone. Blue insets: pachytene. Representative image of three biological replicates is shown (male, n = 21, 18, 15 and hermaphrodite, n = 18, 10, 10). Scale bar, 25 µm.
Figure 3.
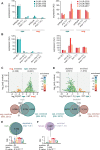
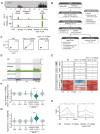
Figure 3.. SNPC-1.3 is required for transcription of male piRNAs.
(A) snpc-1.3 is required for male piRNA expression (spe.) but is dispensable for female piRNA expression during oogenesis (oog.). Taqman qPCR and quantification of representative male (left) and female (right) piRNAs at spermatogenic and oogenic time points normalized to U18. Error bars: ± SD of two technical replicates. (B) him-8(-); snpc-1.3(-) mutant males exhibit severely impaired male piRNA expression and enhanced female piRNA expression. snpc-1.3 is not required for male or female piRNA expression in fem-1(-) females. Error bars: ± SD from two technical replicates. (C) piRNAs are differentially expressed during spermatogenesis (spe.) and oogenesis (oog.) in wild-type worms. (Top) Volcano plot showing piRNAs with ≥1.2 fold-change and FDR of ≤0.05 in 48 hr (spe.) versus 72 hr (oog.). piRNAs are colored according to male and female enrichment scores from Billi et al., 2013. (Bottom) Overlap of male piRNAs (spe.) in wild type at 48 hr with spermatogenesis-enriched and oogenesis-enriched piRNAs defined in Billi et al., 2013. (D) piRNAs depleted in snpc-1.3(-) comprise mostly of male piRNAs. (Top) Volcano plot shows piRNAs with ≥1.2 fold-change and FDR ≤ 0.05 in snpc-1.3(-) mutant versus wild type during spermatogenesis (spe.). piRNAs are colored according to male and female enrichment scores from Billi et al., 2013. (Bottom) Overlap of snpc-1.3-dependent piRNAs with spermatogenesis- and oogenesis-enriched piRNAs defined in Billi et al., 2013. (E) Male piRNAs that are depleted in snpc-1.3(-) have a conserved upstream motif with a strong 5′ C bias. (Top) Overlap of snpc-1.3-dependent piRNAs with male piRNAs shown in (C). (Bottom) Logo plot displays conserved motif upstream of each piRNA. Median position of the C-nucleotide of the identified motif, number of piRNAs, and associated E-value are listed. (F) Female piRNAs are upregulated in snpc-1.3(-) mutants during spermatogenesis. (Top) Overlap of piRNAs upregulated at 72 hr (oog.) with piRNAs enriched in snpc-1.3(-) at 48 hr (spe.). (Bottom) Logo plot displays conserved motif upstream of each piRNA. Median position of the C-nucleotide of the identified motif, number of piRNAs, and associated E-value are listed.
Figure 3—figure supplement 1.
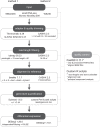
Figure 3—figure supplement 1.. Small RNA-seq analysis pipeline.
Two independent workflows (method 1 and method 2) were applied for differential expression analysis.
Figure 3—figure supplement 2.
Figure 3—figure supplement 2.. Quality control of small RNA-seq and validation analysis.
(A) SNPC-1.3 is not responsible for U1 snRNA transcription. U1 snRNA levels normalized to eft-2 upon knockdown of snpc-4 (control) and snpc-1.3. Knockdown of snpc-4, but not of snpc-1.3, results in a reduction in U1 levels. Error bars: ± SD of two technical replicates. (B) Mapped reads distributed by read length and 5′ nucleotide identity. (C) (Top) Volcano plot showing differential piRNA expression between spermatogenesis and oogenesis in wild-type worms. piRNAs are colored according to male and female enrichment scores from Billi et al., 2013. Analysis shown is from a second, independent small RNA-seq analysis workflow (method 2). (Bottom) Overlap of spermatogenesis-enriched piRNAs in wild type at 48 hr with male and female piRNAs defined in Billi et al., 2013. (D) (Top) Volcano plot showing differential piRNA expression between snpc-1.3(-) mutants versus wild type during spermatogenesis. piRNAs are colored by enrichment scores of male and female piRNAs defined in Billi et al., 2013. Analysis shown is from a second, independent small RNA-seq analysis workflow (method 2). (Bottom) Overlap of SNPC-1.3-dependent piRNAs in wild type at 48 hr with male and female piRNAs defined in Billi et al., 2013. (E) Most SNPC-1.3-dependent piRNAs overlap with spermatogenesis-enriched piRNAs (left) and are enriched for the upstream eight nt core motif showing a bias for (C) at the 5′ position (right).
Figure 4.
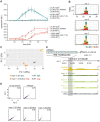
Figure 4.. SNPC-1.3 binds male piRNA loci in a SNPC-4-dependent manner.
(A) SNPC-1.3 binding at the piRNA clusters requires SNPC-4. SNPC-1.3::3xFlag binding normalized to input (mean ± SD of two technical replicates) on chromosome IV by ChIP-qPCR in N2, snpc-1.3::3xflag, and snpc-1.3::3xflag; snpc-4::aid::ollas, which undergoes TIR-1-mediated degradation by addition of auxin (snpc-4::aid). Top panel depicts the density of piRNAs on chromosome IV with piRNAs predominantly found in the small (4.5–7 Mb) and big (13.5–17.2 Mb) clusters. (B) SNPC-1.3 binding profiles across chromosome IV in N2, snpc-1.3::3xflag, and snpc-1.3::3xflag; snpc-4::aid. The locations of the two piRNAs clusters are highlighted. (C) SNPC-1.3 binding is enriched at piRNA clusters on chromosome IV. SNPC-1.3-bound regions are enriched within piRNA clusters compared to regions outside of the piRNA clusters on chromosome IV (****p≤0.0001, Wilcoxon rank sum test). The number of bins analyzed is listed in parentheses. (D) SNPC-1.3 enrichment at piRNA clusters is dependent on SNPC-4. SNPC-1.3-bound regions within piRNA clusters are depleted compared to regions outside of the piRNA clusters on chromosome IV upon loss of SNPC-4 (****p≤0.0001, Wilcoxon rank sum test). The number of bins analyzed is listed in parentheses. (E) Distribution of SNPC-1.3 reads (mean density ± standard error) around the 5′ nucleotide of mature piRNAs at the piRNA clusters. To resolve SNPC-1.3 binding between male and female piRNAs despite the high density of piRNAs, we selected 1 kb bins with all male (100), female (19), or non-enriched (279) piRNAs. Heat maps represent ChIP signal in 1 kb bins around the 5′ nucleotide of all 100 mature male piRNAs, ranked according to SNPC-1.3 signal. (F) Examples of SNPC-1.3 binding at two regions containing two male piRNA loci. Regions are anchored on the 5′ nucleotide of each mature male piRNA and show mean read density ± standard error.
Figure 4—figure supplement 1.
Figure 4—figure supplement 1.. SNPC-1.3 ChIP-seq pipeline and quality control and biological replicates for SNPC-1.3 ChIP.
(A) SNPC-1.3 binding at the piRNA clusters requires SNPC-4. Two biological replicates of the experiment shown in Figure 4A. Top panel depicts the density of piRNAs on chromosome IV, showing piRNAs are predominantly found in a small (4.5–7 Mb) and big (13.5–17.2 Mb) clusters. SNPC-1.3::3xFlag binding normalized to input (mean ± SD of two technical replicates) on chromosome IV by ChIP-qPCR in N2, snpc-1.3::3xflag, and snpc-1.3::3xflag;snpc-4::aid. The locations of the two piRNAs clusters are highlighted. (B) SNPC-1.3 ChIP-seq analysis workflow. (C) Pairwise Pearson correlations between SNPC-1.3 ChIP-seq biological replicates. (D) Biological replicate of Figure 4B. The locations of the two piRNAs clusters are highlighted. (E) Biological replicate of enrichment profiles shown in Figure 4E. Distribution of SNPC-1.3 reads (mean density ± standard error) around the 5′ nucleotide of mature piRNAs at the piRNA clusters. To resolve SNPC-1.3 binding between male and female piRNAs despite the high density of piRNAs, we selected 1 kb bins with all male (135), female (20), or non-enriched (337) piRNAs. (F) SNPC-1.3 enrichment at piRNA clusters is dependent on SNPC-4. Biological replicate of Figure 4D. SNPC-1.3-bound regions within piRNA clusters are depleted compared to regions outside of the piRNA clusters on chromosome IV upon loss of SNPC-4 (****p≤0.0001, Wilcoxon rank sum test). The number of bins analyzed is listed in parentheses. (G) SNPC-1.3 binding is enriched at piRNA clusters on chromosome IV. Biological replicate of Figure 4C. Regions within piRNA clusters are enriched for SNPC-1.3 binding compared to regions outside of the piRNA clusters on chromosome IV (****p≤0.0001, Wilcoxon rank sum test). The number of bins analyzed is listed in parentheses. (H) Examples of SNPC-1.3 binding at two regions containing two male piRNA loci. Regions are anchored on the 5′ nucleotide of each mature male piRNA and show mean read density ± standard error. Biological replicate of Figure 4F.
Figure 5.
Figure 5.. TRA-1 represses snpc-1.3 and male piRNAs expression during oogenesis.
(A) snpc-1.3 mRNA levels peak during early spermatogenesis (spe.) while tra-1 mRNA levels are highest during oogenesis (oog.). qRT-PCR and quantification of snpc-1.3, snpc-4, and tra-1 mRNA normalized to eft-2 mRNA across hermaphrodite development. Time zero corresponds to the time when synchronized L1s were plated. Error bars: ± SD of two technical replicates. (B) TRA-1 binds to the snpc-1.3 promoter. Schematic of the three TRA-1 binding sites upstream of the snpc-1.3 locus in wild type (top). Site-specific mutations shown in red were made in one, two, or three of the TRA-1 binding sites (gray denotes the mutated motifs). (Bottom) TRA-1 binding is reduced in TRA-1 binding site mutants assayed by TRA-1 ChIP-seq. (C) TRA-1 represses snpc-1.3 mRNA expression during oogenesis. (Left) snpc-1.3 mRNA expression is drastically upregulated upon RNAi-mediated knockdown of tra-1 and (middle) in strains bearing mutations in two (2xtbs) or three (3xtbs) TRA-1 binding sites. Error bars indicate ± SD from two technical replicates. (Right) Western blot of SNCP-1.3::3xFlag expression driven under the wild-type and 2xtbs mutant promoter during spermatogenesis (spe.) (top) and oogenesis (oog.) (bottom). H3 was used as the loading control. (D) A subset of male piRNAs are ectopically expressed during oogenesis in snpc-1.3 (2xtbs) mutants. (Top) Volcano plot showing differential piRNA expression between snpc-1.3 (2xtbs) mutants versus wild type during oogenesis (oog.). piRNAs are colored by enrichment scores from Billi et al., 2013. (Bottom) Overlap of male piRNAs defined in Figure 3C with upregulated piRNAs in snpc-1.3 (2xtbs) mutants. (E) Mutations at two (2xtbs) or three (3xtbs) TRA-1 binding sites enhance male piRNA expression (top) but attenuate female piRNA expression (bottom) during oogenesis. Error bars indicate ± SD from two technical replicates.
Figure 5—figure supplement 1.
Figure 5—figure supplement 1.. TRA-1 regulation of snpc-1.3 across hermaphrodite development.
(A) Male and female piRNA levels peak during spermatogenesis and oogenesis, respectively. Male piRNA levels are severely impaired but female piRNA expression is upregulated during hermaphrodite development in snpc-1.3 mutants. Taqman qPCR and quantification of male and female piRNAs across hermaphrodite development. Error bars: ± SD of two technical replicates. (B) Mapped reads distributed by read length and 5′ nucleotide identity of three biological replicates. (C) Principal component analysis (PCA) of piRNA expression based on rlog transformation of normalized counts. The scatter plot depicts the first two principal components. Percentage on each axis represents the percentage of variation accounted for by each principal component. (D) TRA-1 binds to the snpc-1.3 promoter. Biological replicate of Figure 5B. Schematic of the three TRA-1 binding sites upstream of the snpc-1.3 locus in wild type (top). (Bottom) TRA-1 binding is progressively reduced with the increase in number of TRA-1 binding sites mutated. (E) Pairwise Pearson correlations between TRA-1 ChIP-seq biological replicates.
Figure 6.
Figure 6.. SNPC-1.3 is critical for male fertility.
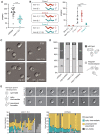
(A) snpc-1.3(-) hermaphrodites exhibit sterility at 25°C. Circles correspond to the number of viable progeny from singled hermaphrodites (n = 16). Black bars indicate mean ± SD. Statistical significance was assessed using Welch’s t-test (****p≤0.0001). (B) snpc-1.3 promotes male fertility but is dispensable for female fertility. (Left) Diagram illustrates crosses between strains for mating assays (1.3(-) denotes snpc-1.3(-)). (Right) snpc-1.3(-); him-8(-) males crossed to fem-1(-) females show severe fertility defects (Cross 3). snpc-1.3; fem-1(-) females crossed to him-8(-) males (Cross 2) show equivalent fertility similar to fem-1(-) females crossed to him-8(-) males (Cross 1). Circles correspond to the number of viable progeny from cross (n = 16). Black bars indicate mean ± SD. Statistical significance was assessed using Welch’s t-test (ns: not significant; ****p≤0.0001). (C) snpc-1.3(-) spermatids exhibit severe morphological defects. Images of pronase-treated sperm of wild-type, prg-1(-), snpc-1.3(-), and snpc-1.3 (2xtbs) males. (D) snpc-1.3(-) spermatids exhibit severe sperm maturation defects. (E) (Top) Images depicted at 3 min intervals of a sperm undergoing activation and maturation. Imaging of spermatid commenced ~3 min after pronase treatment. (Bottom) Graphical display of individual sperm tracked over time after pronase treatment.
Figure 6—figure supplement 1.
Figure 6—figure supplement 1.. SNPC-1.3 is critical for male fertility.
(A) snpc-1.3 is required in males, but not females, to promote fertility. (Left) Diagram illustrates crosses between strains for mating assays. Green worms represent Pcol-19::gfp males. (Right) snpc-1.3(-); Pcol-19::gfp males show diminished ability to rescue wild-type or snpc-1.3(-) hermaphrodites when compared to Pcol-19::gfp males. Circles correspond to the brood size of viable progeny from each mating (n = 16). Black bars indicate mean ± SD. Statistical significance was assessed using Welch’s t-test (ns: not significant; **p≤0.005; ****p≤0.0005). (B) snpc-1.3 (2xtbs) and snpc-1.3 (3xtbs) mutant hermaphrodites have decreased fertility at 25°C. Black bars indicate mean ± SD (n = 16). Statistical significance was assessed using Welch’s t-test (****p≤0.0001). (C) Multiple TRA-1 binding sites are conserved in C. elegans, C. brenneri, C. briggsae, and C. nigoni. Sequence alignment of snpc-1.3 homologs in other nematode species. Blue indicates sequences in TRA-1 binding motifs.
Figure 7.
Figure 7.. Model illustrating the dynamics of male and female piRNA transcription across C.
elegans sexual development. In wild-type worms, male and female piRNA expression peaks during spermatogenesis and oogenesis, respectively. (Top) In snpc-1.3(-) mutants, male piRNA expression is abrogated, and female piRNA expression is moderately enhanced across sexual development relative to wild type. In TRA-1 binding site mutants, snpc-1.3 expression is de-repressed causing ectopic upregulation of male piRNAs and moderate repression of female piRNA expression during oogenesis relative to wild type. (Bottom) During spermatogenesis, SNPC-1.3 interacts with SNPC-4 at male promoters to drive male piRNA transcription. During oogenesis, TRA-1 represses the transcription of snpc-1.3 which results in the suppression of male piRNA transcription, thus leading to enhanced transcription of female piRNAs.
Author response image 1.
Author response image 1.. Distance of the nearest neighboring piRNA for each piRNA in the two chromosome IV clusters.
Author response image 2.
Author response image 2.. Absolute value of the log2(fold-change) of each male piRNA depleted in snpc-1.3(-) mutants against its mean expression level during spermatogenesis in wildtype.
Author response image 3.
Author response image 3.. Fertility defect in snpc-1.3(-) at 20°C.

References

    1. Amemiya HM, Kundaje A, Boyle AP. The ENCODE blacklist: identification of problematic regions of the genome. Scientific Reports. 2019;9:9354. doi: 10.1038/s41598-019-45839-z. - DOI - PMC - PubMed
    1. Andersen PR, Tirian L, Vunjak M, Brennecke J. A heterochromatin-dependent transcription machinery drives piRNA expression. Nature. 2017;549:54–59. doi: 10.1038/nature23482. - DOI - PMC - PubMed
    1. Aravin AA, Lagos-Quintana M, Yalcin A, Zavolan M, Marks D, Snyder B, Gaasterland T, Meyer J, Tuschl T. The small RNA profile during Drosophila melanogaster development. Developmental Cell. 2003;5:337–350. doi: 10.1016/S1534-5807(03)00228-4. - DOI - PubMed
    1. Aravin A, Gaidatzis D, Pfeffer S, Lagos-Quintana M, Landgraf P, Iovino N, Morris P, Brownstein MJ, Kuramochi-Miyagawa S, Nakano T, Chien M, Russo JJ, Ju J, Sheridan R, Sander C, Zavolan M, Tuschl T. A novel class of small RNAs bind to MILI protein in mouse testes. Nature. 2006;442:203–207. doi: 10.1038/nature04916. - DOI - PubMed
    1. Armisen J, Gilchrist MJ, Wilczynska A, Standart N, Miska EA. Abundant and dynamically expressed miRNAs, piRNAs, and other small RNAs in the vertebrate Xenopus tropicalis. Genome Research. 2009;19:1766–1775. doi: 10.1101/gr.093054.109. - DOI - PMC - PubMed

Publication types

MeSH terms

Associated data