. 2021 Sep 1;105(9):1965-1979.
doi: 10.1097/TP.0000000000003617.

Ex Vivo Expanded Donor Alloreactive Regulatory T Cells Lose Immunoregulatory, Proliferation, and Antiapoptotic Markers After Infusion Into ATG-lymphodepleted, Nonhuman Primate Heart Allograft Recipients

Affiliations

Ex Vivo Expanded Donor Alloreactive Regulatory T Cells Lose Immunoregulatory, Proliferation, and Antiapoptotic Markers After Infusion Into ATG-lymphodepleted, Nonhuman Primate Heart Allograft Recipients

Mohamed B Ezzelarab et al. Transplantation. .

Abstract

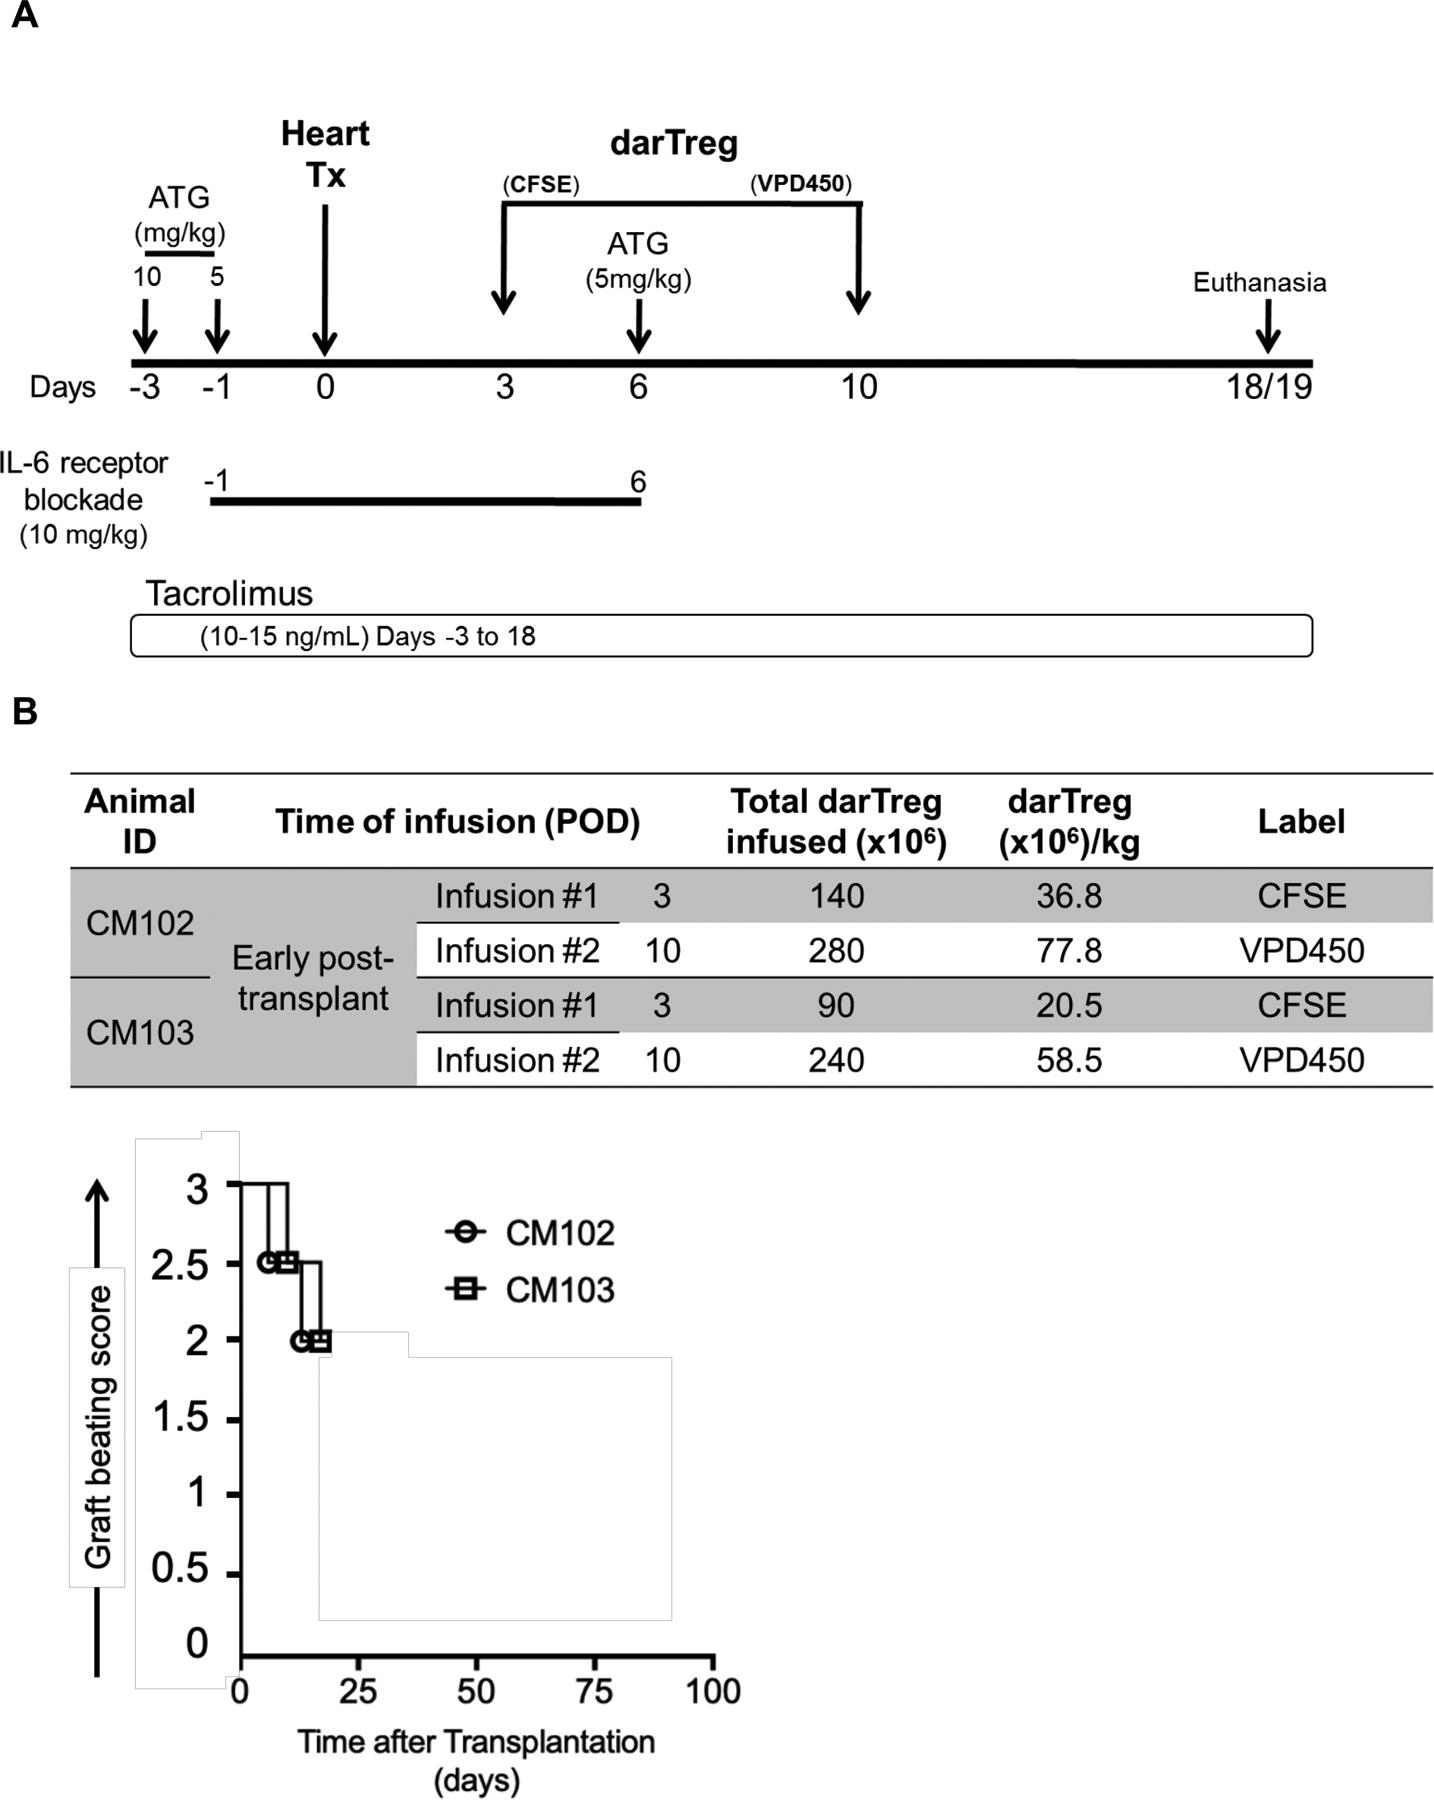
Background: Regulatory T cell (Treg) therapy is a promising approach to amelioration of allograft rejection and promotion of organ transplant tolerance. However, the fate of infused Treg, and how this relates to their therapeutic efficacy using different immunosuppressive regimens is poorly understood. Our aim was to analyze the tissue distribution, persistence, replicative activity and phenotypic stability of autologous, donor antigen alloreactive Treg (darTreg) in anti-thymocyte globulin (ATG)-lymphodepleted, heart-allografted cynomolgus monkeys.

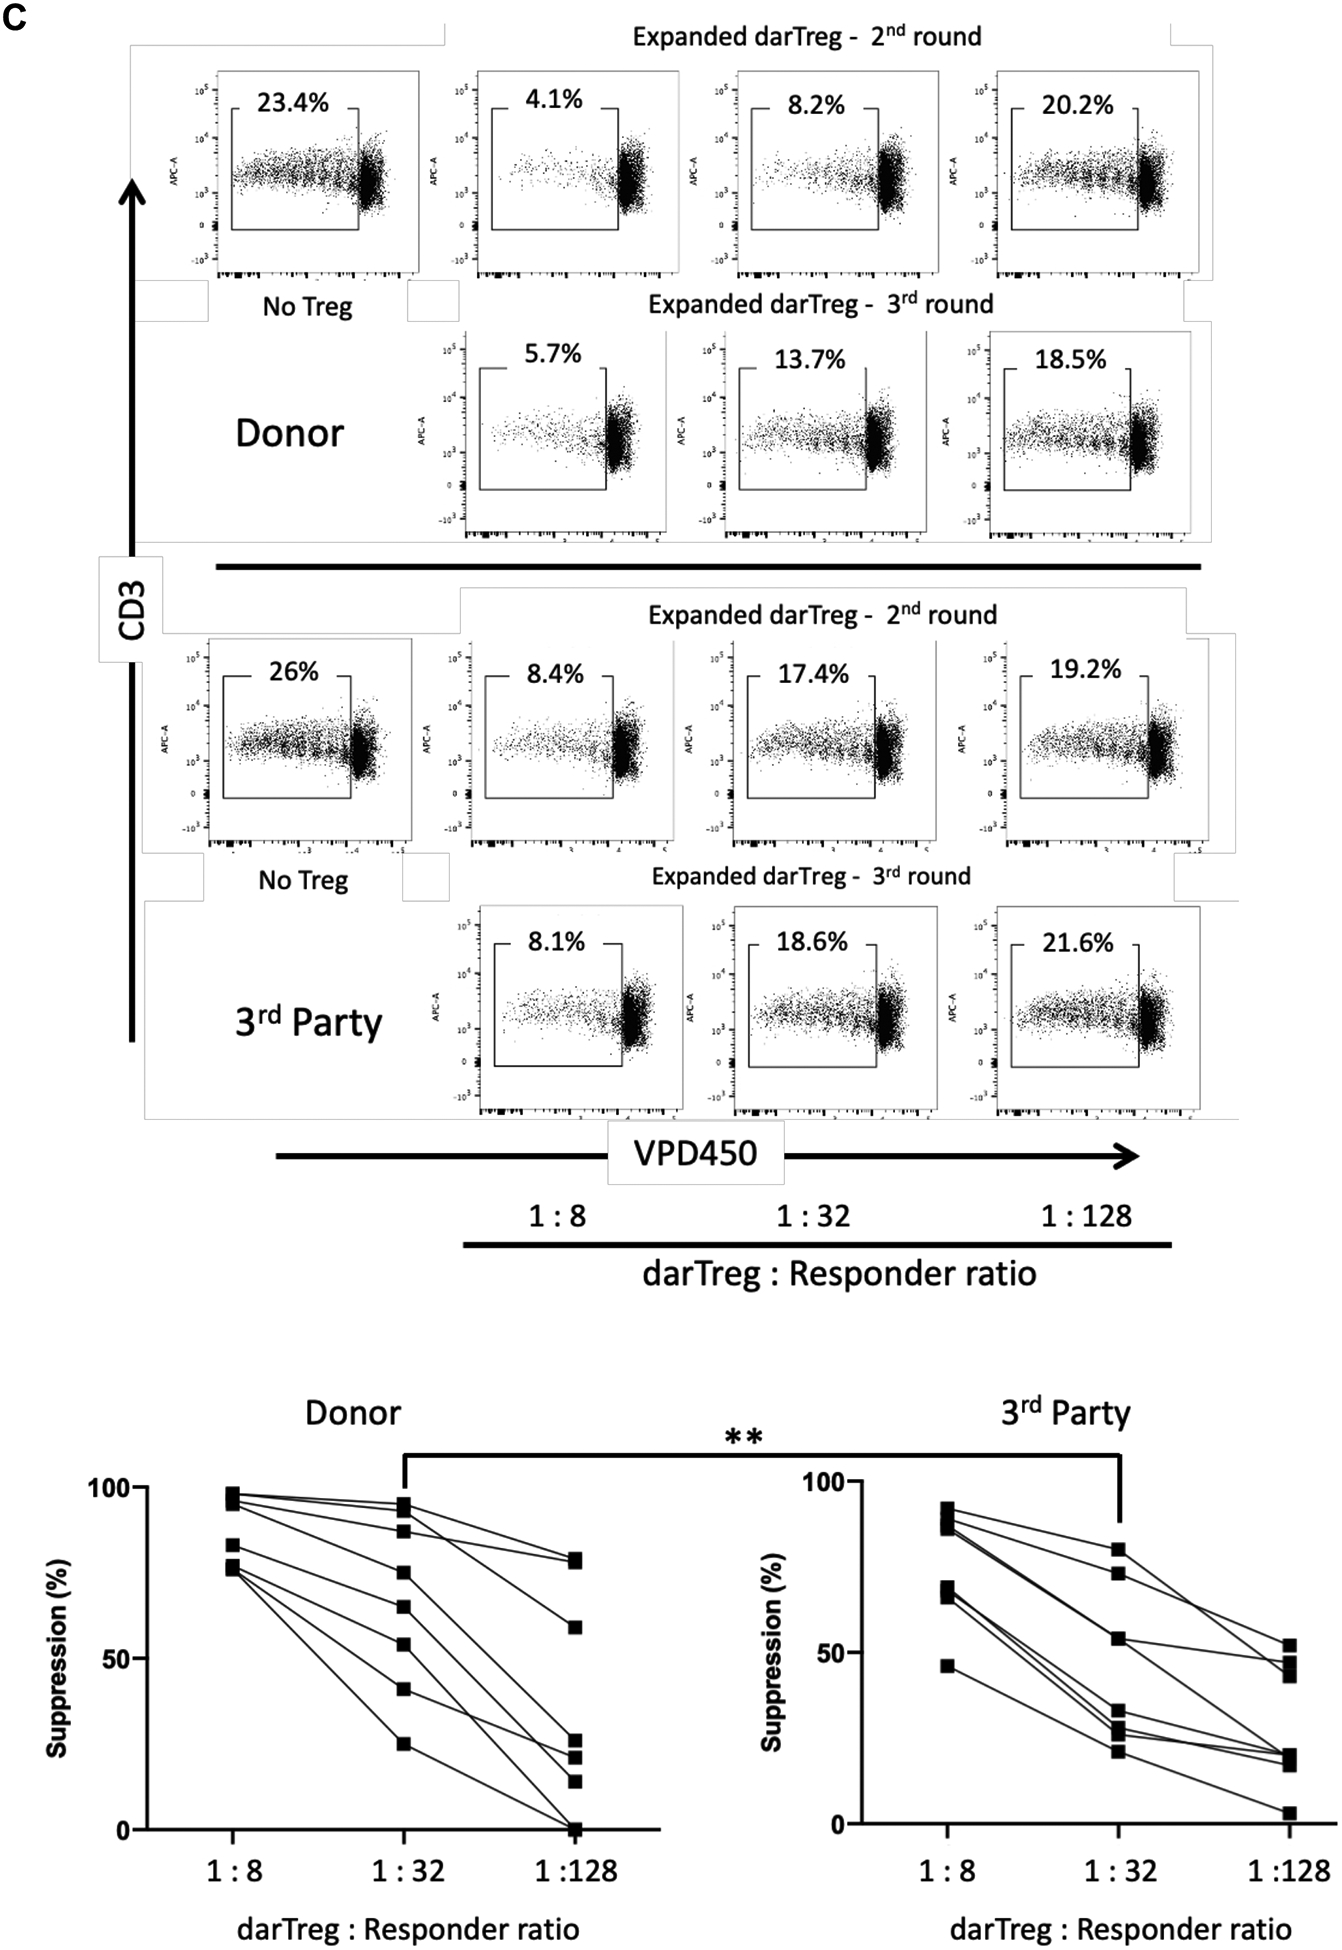
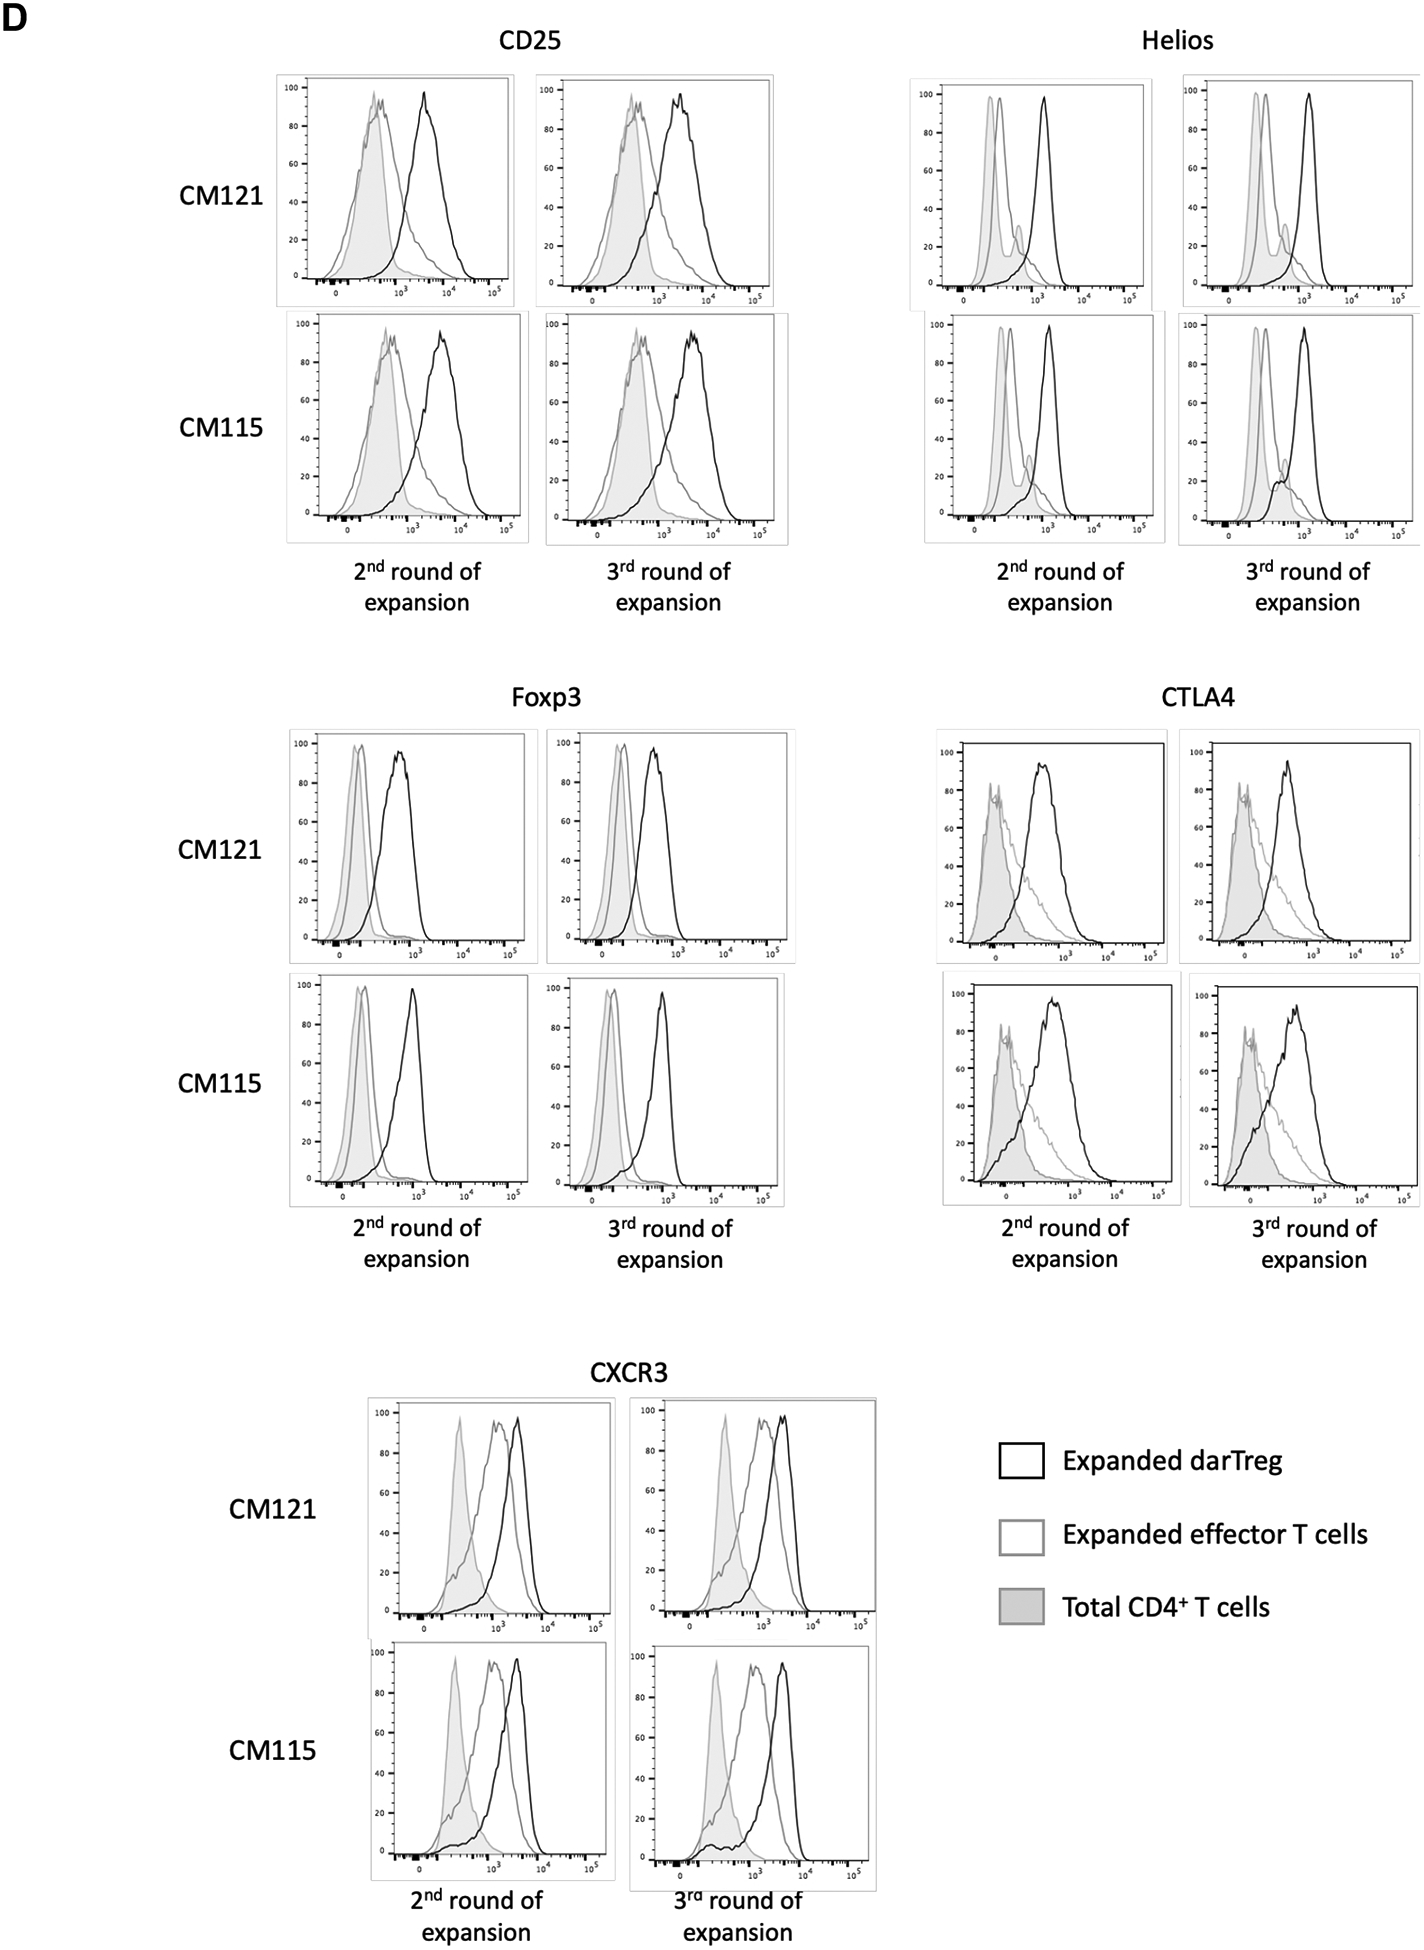
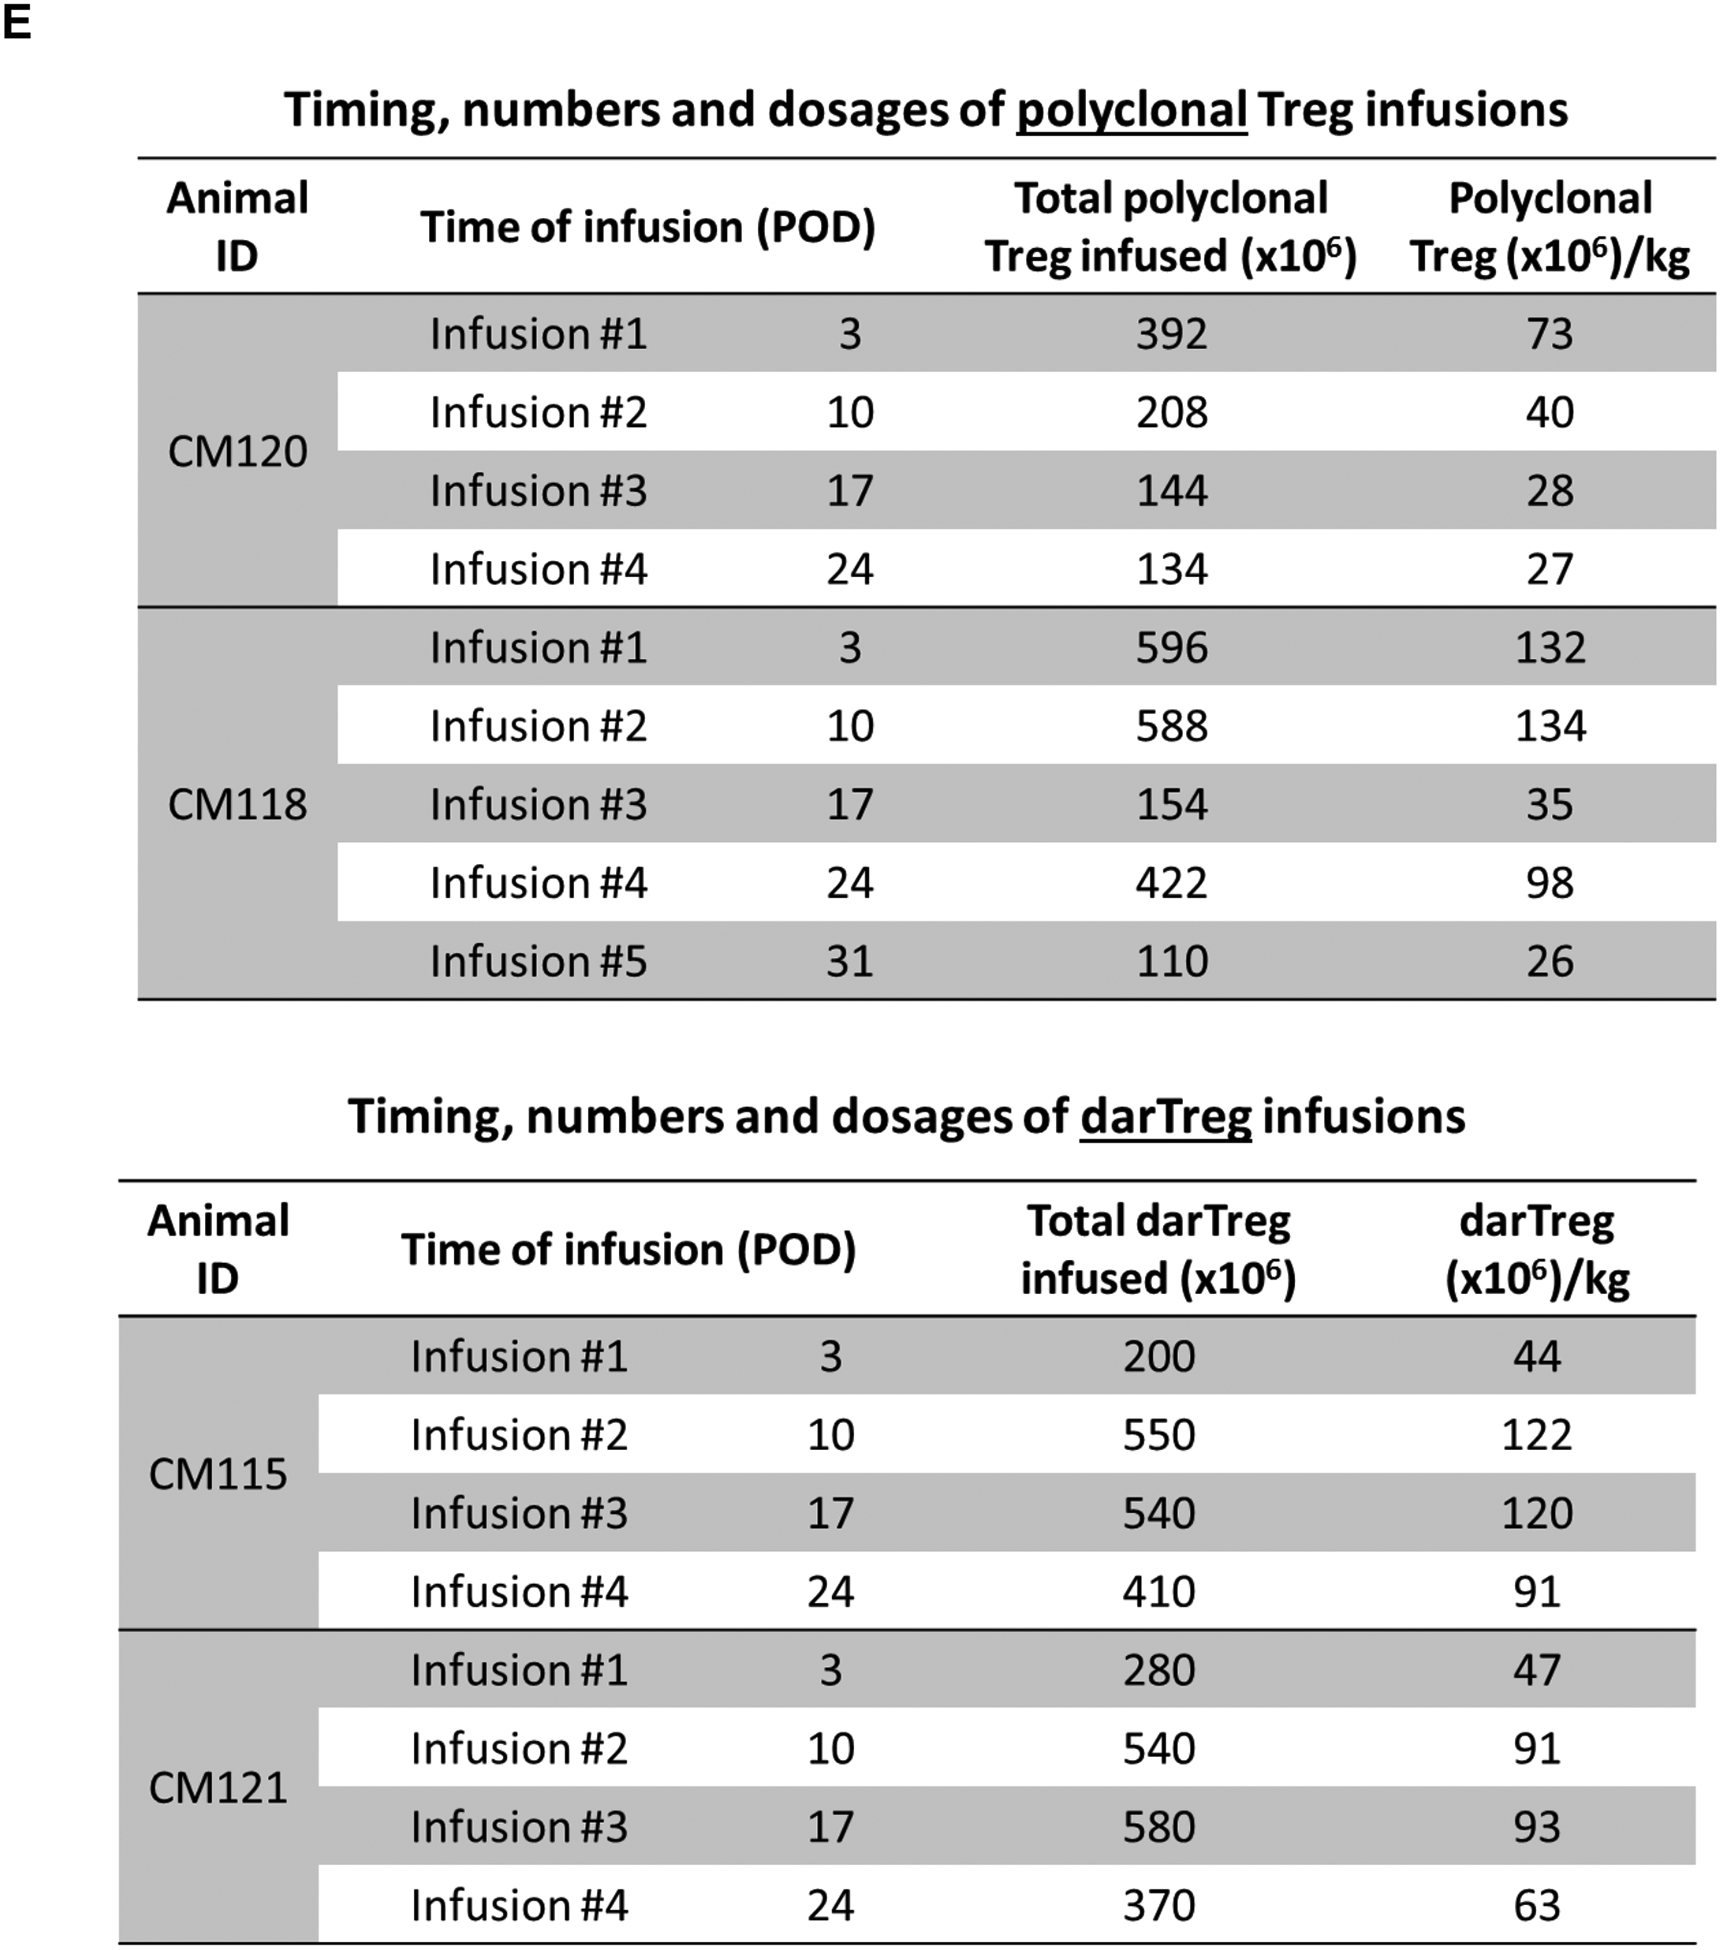
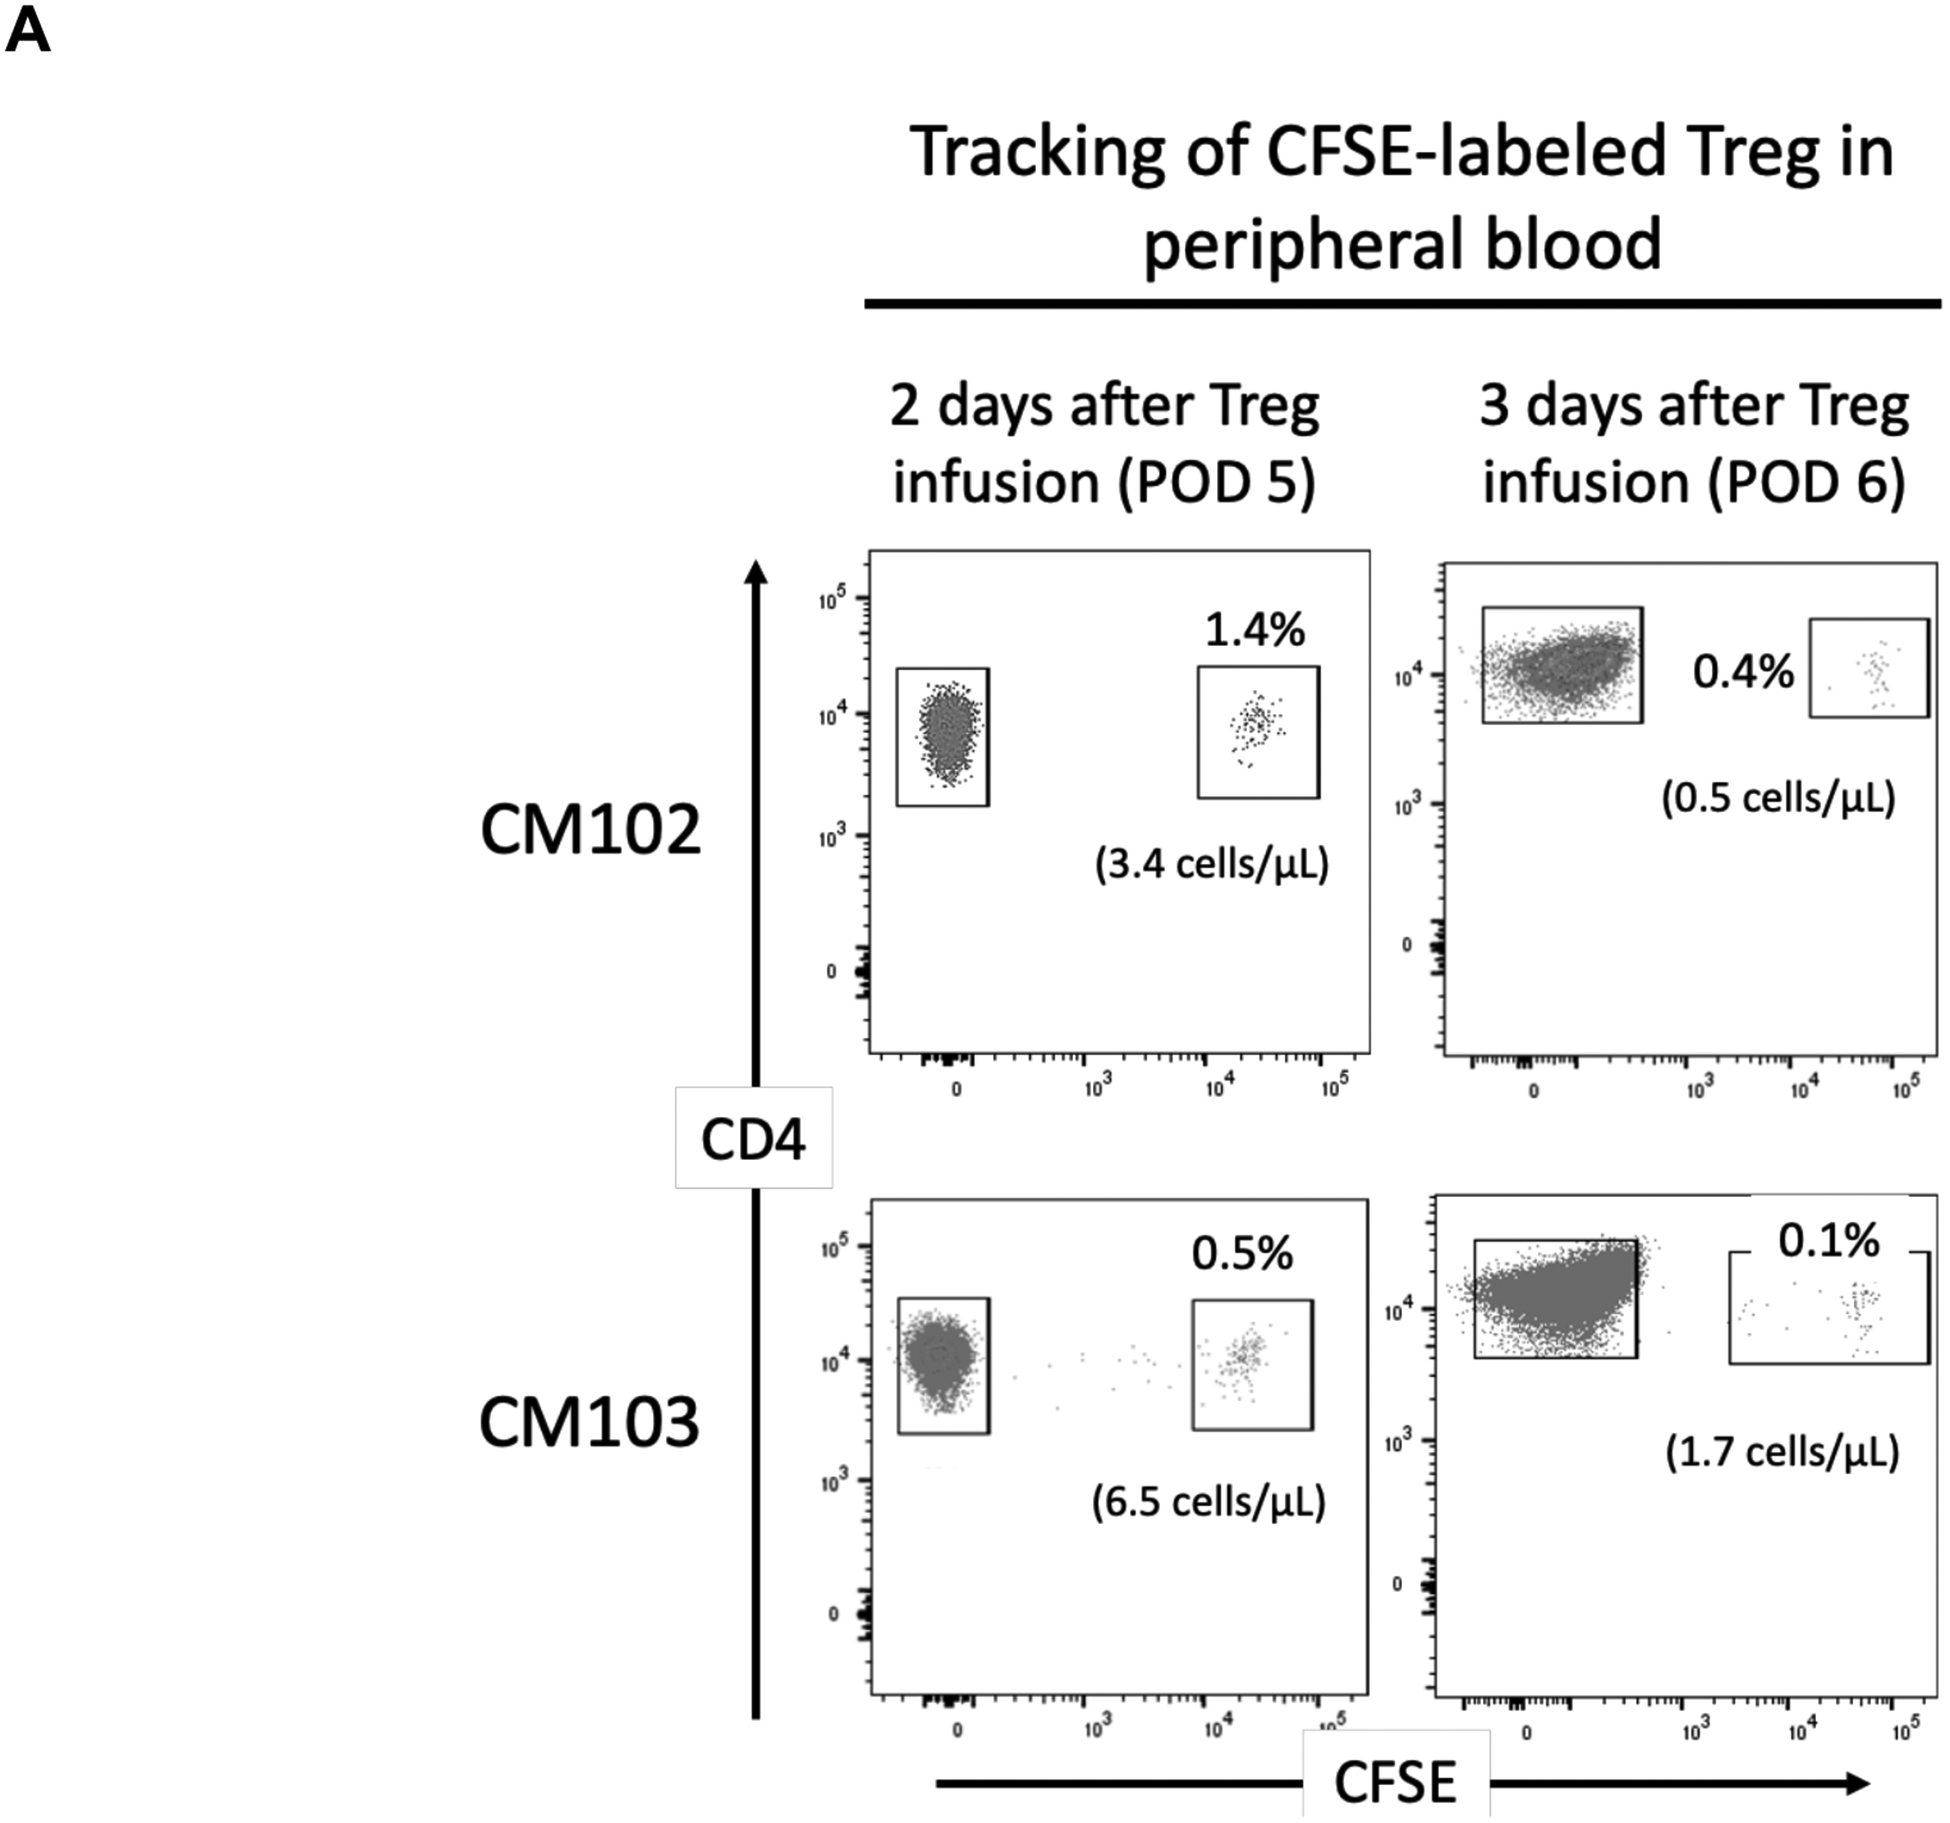
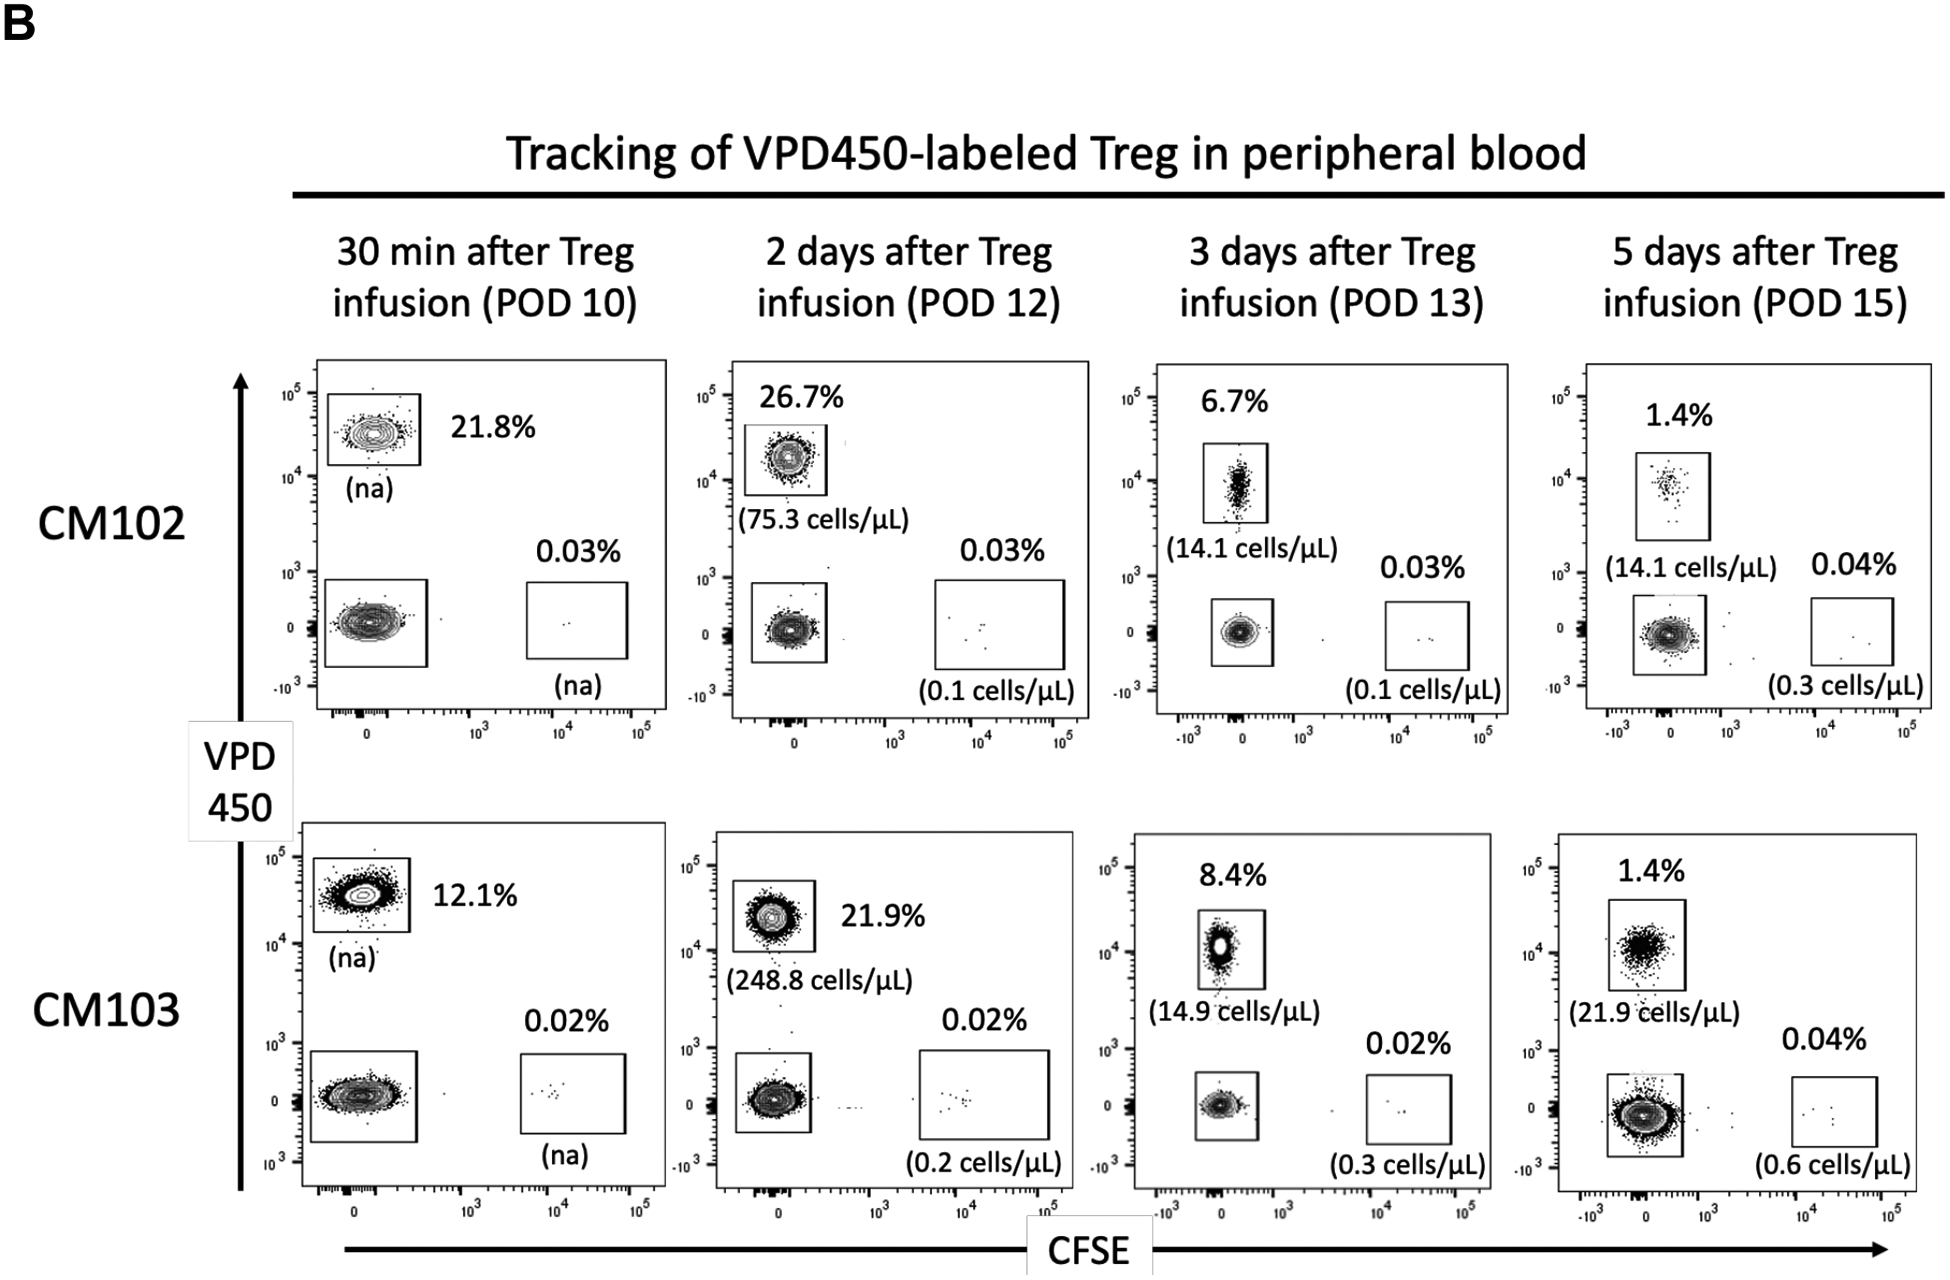
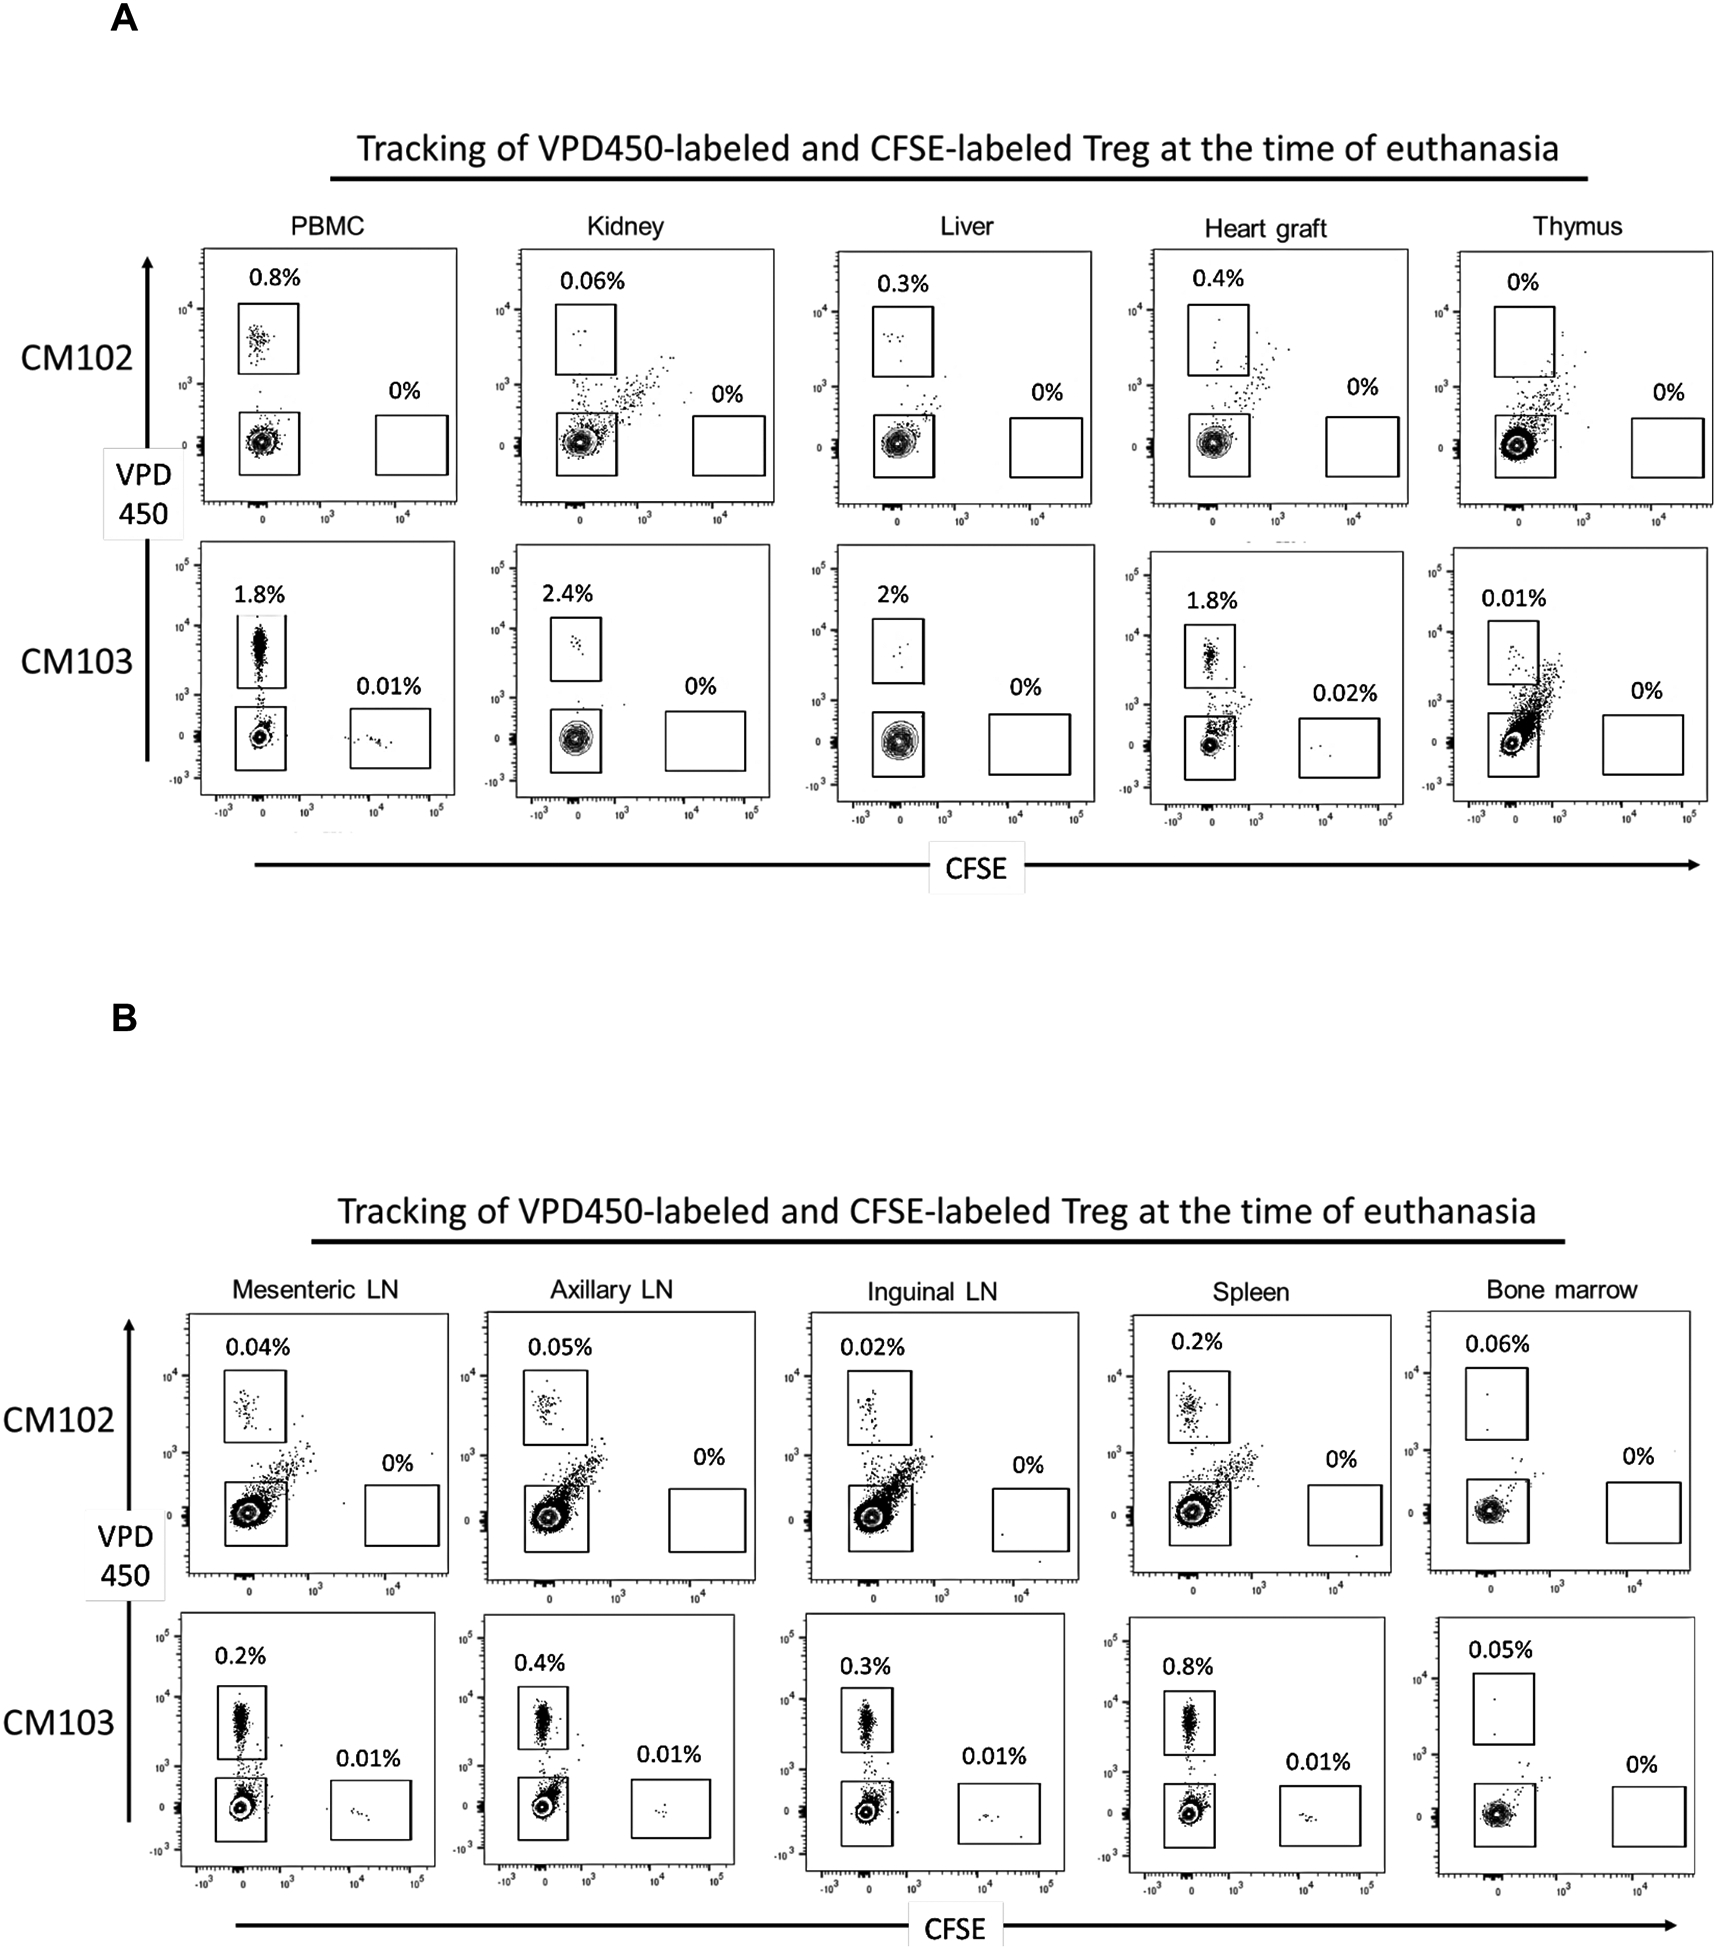
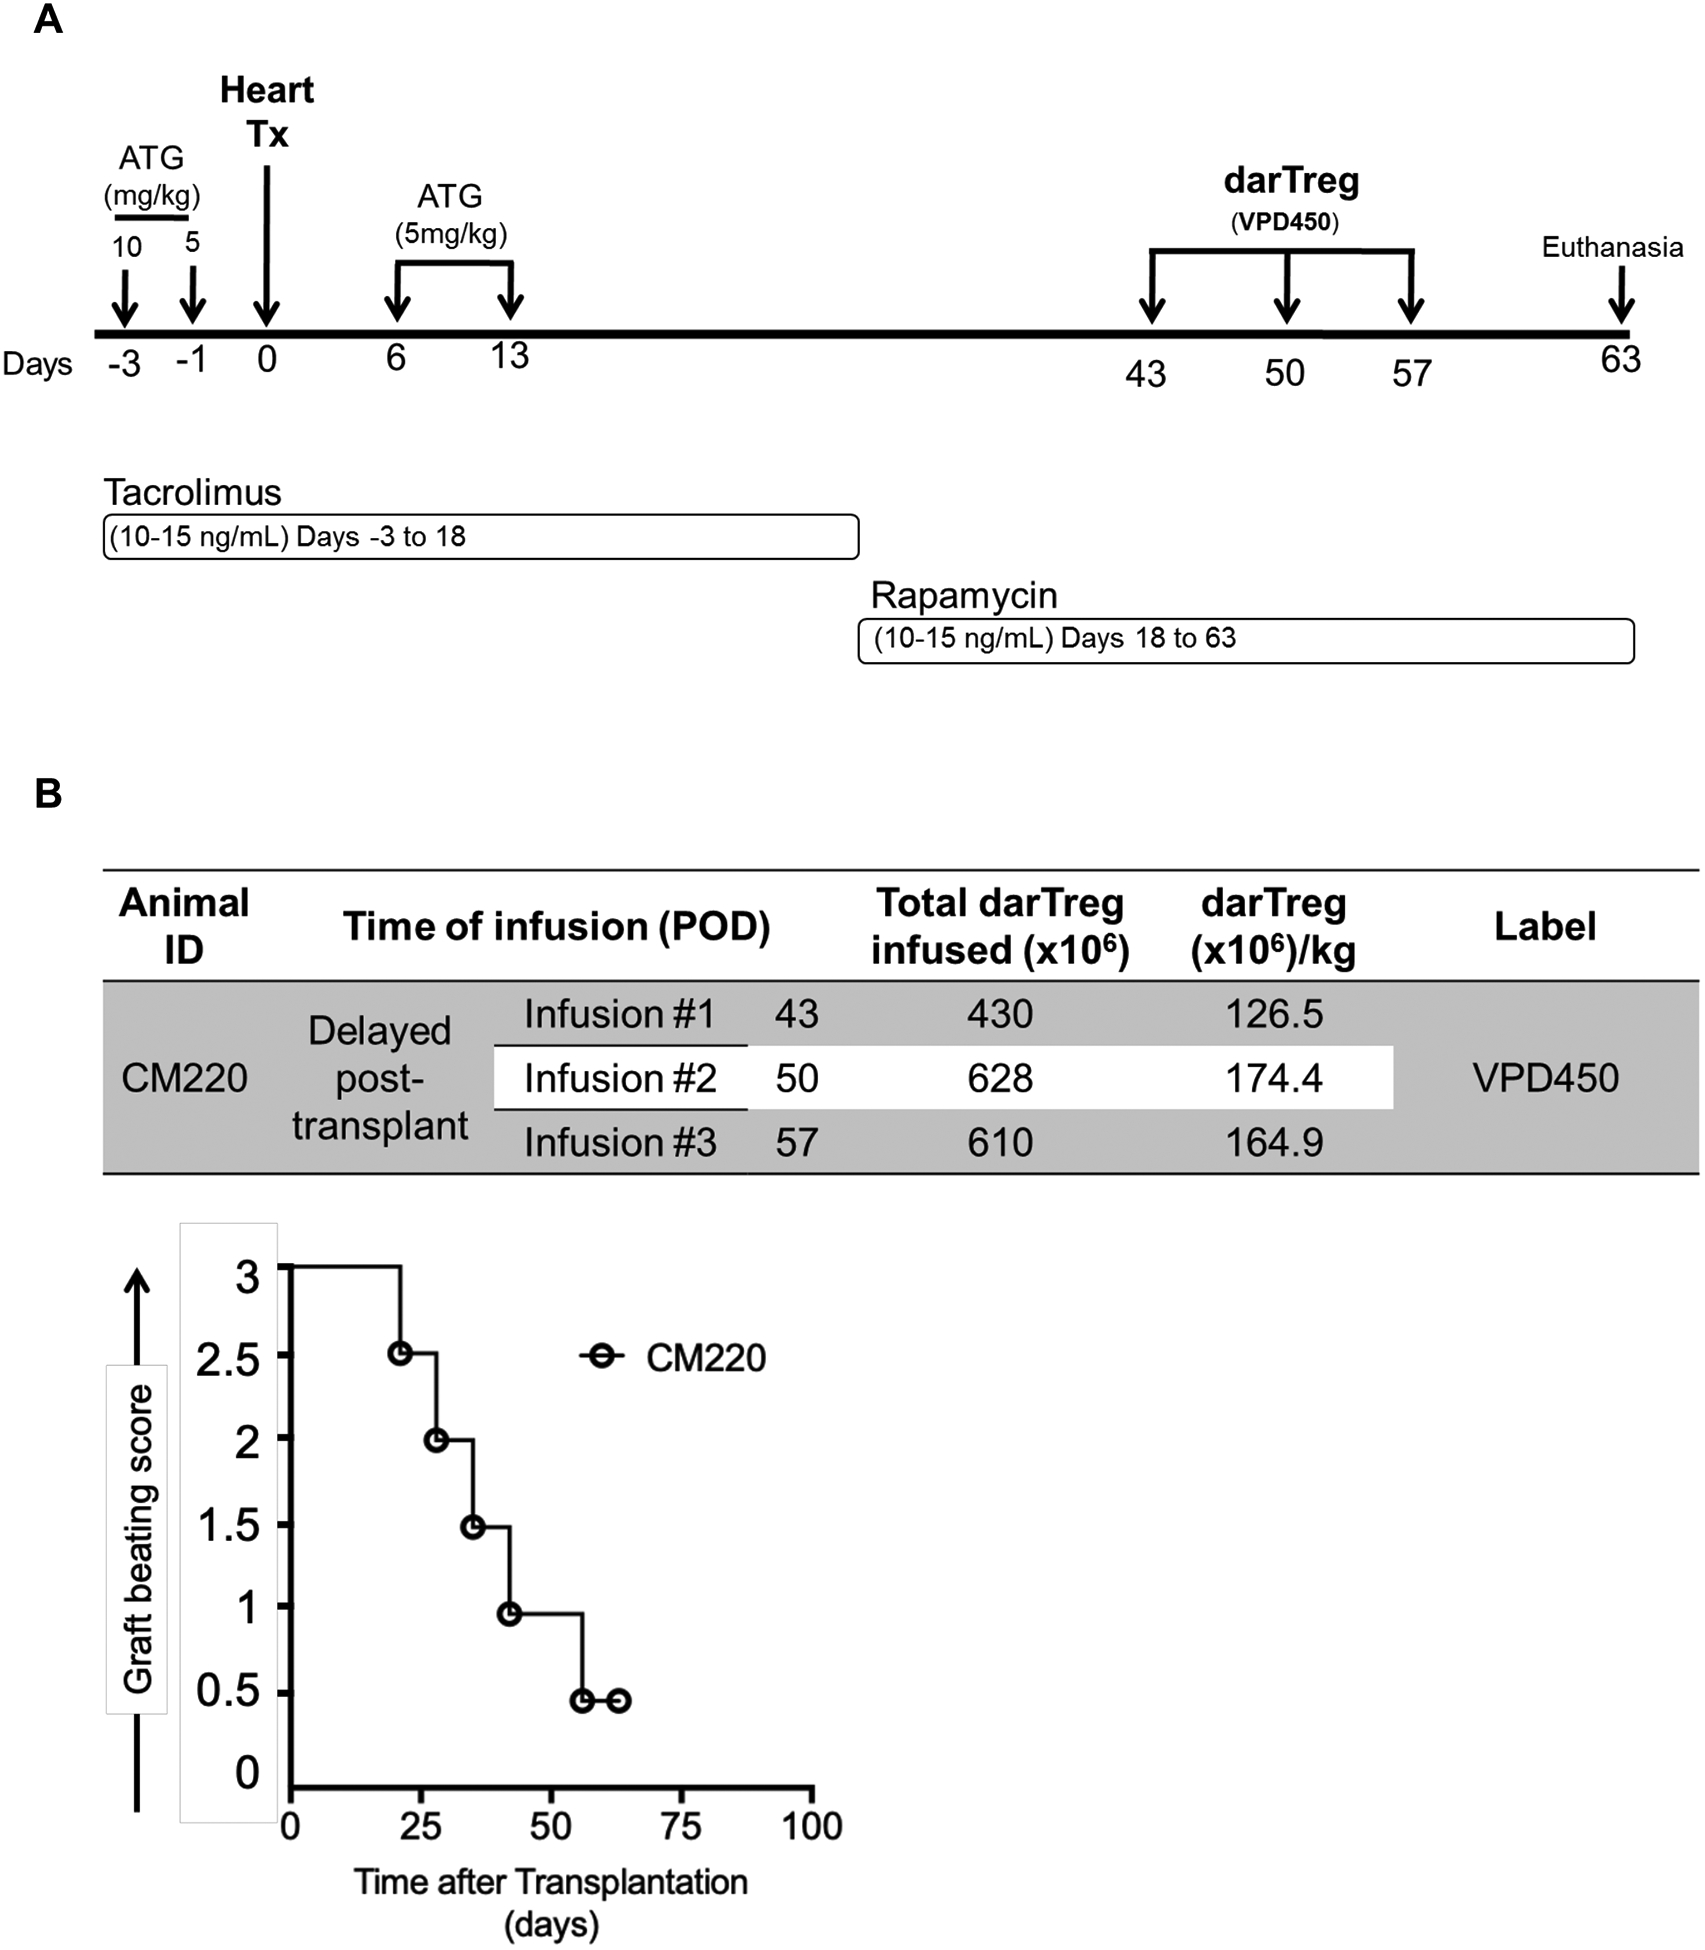
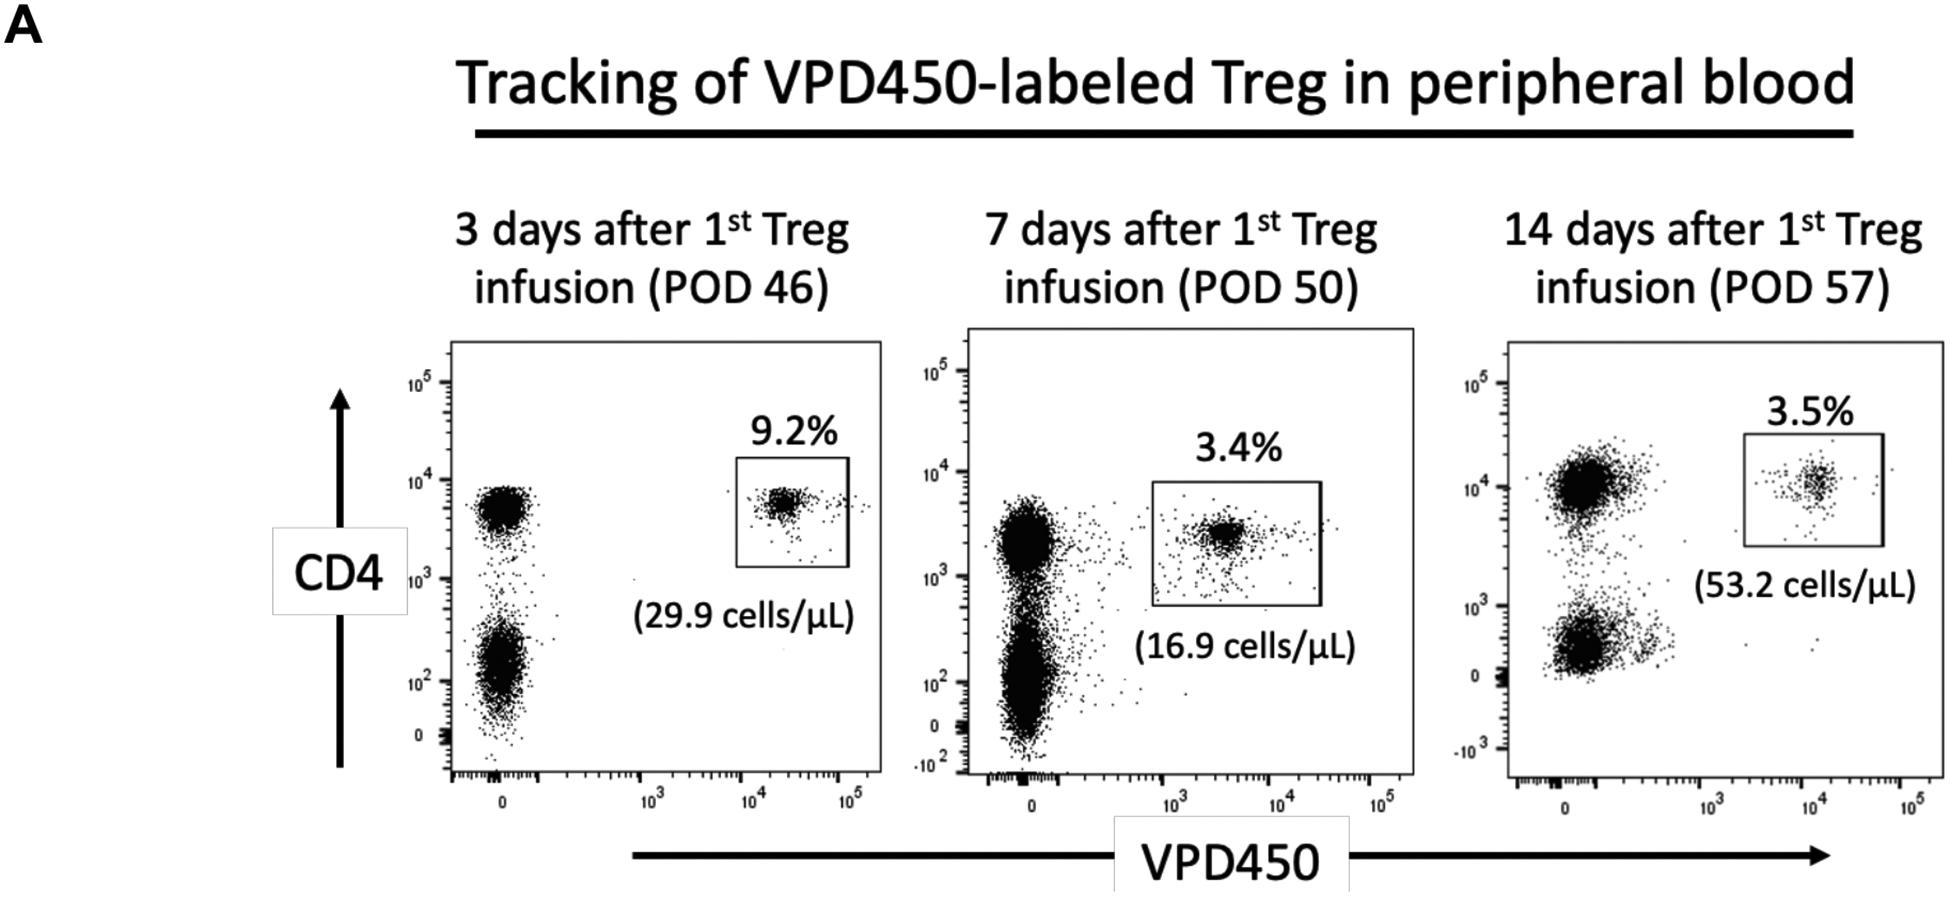
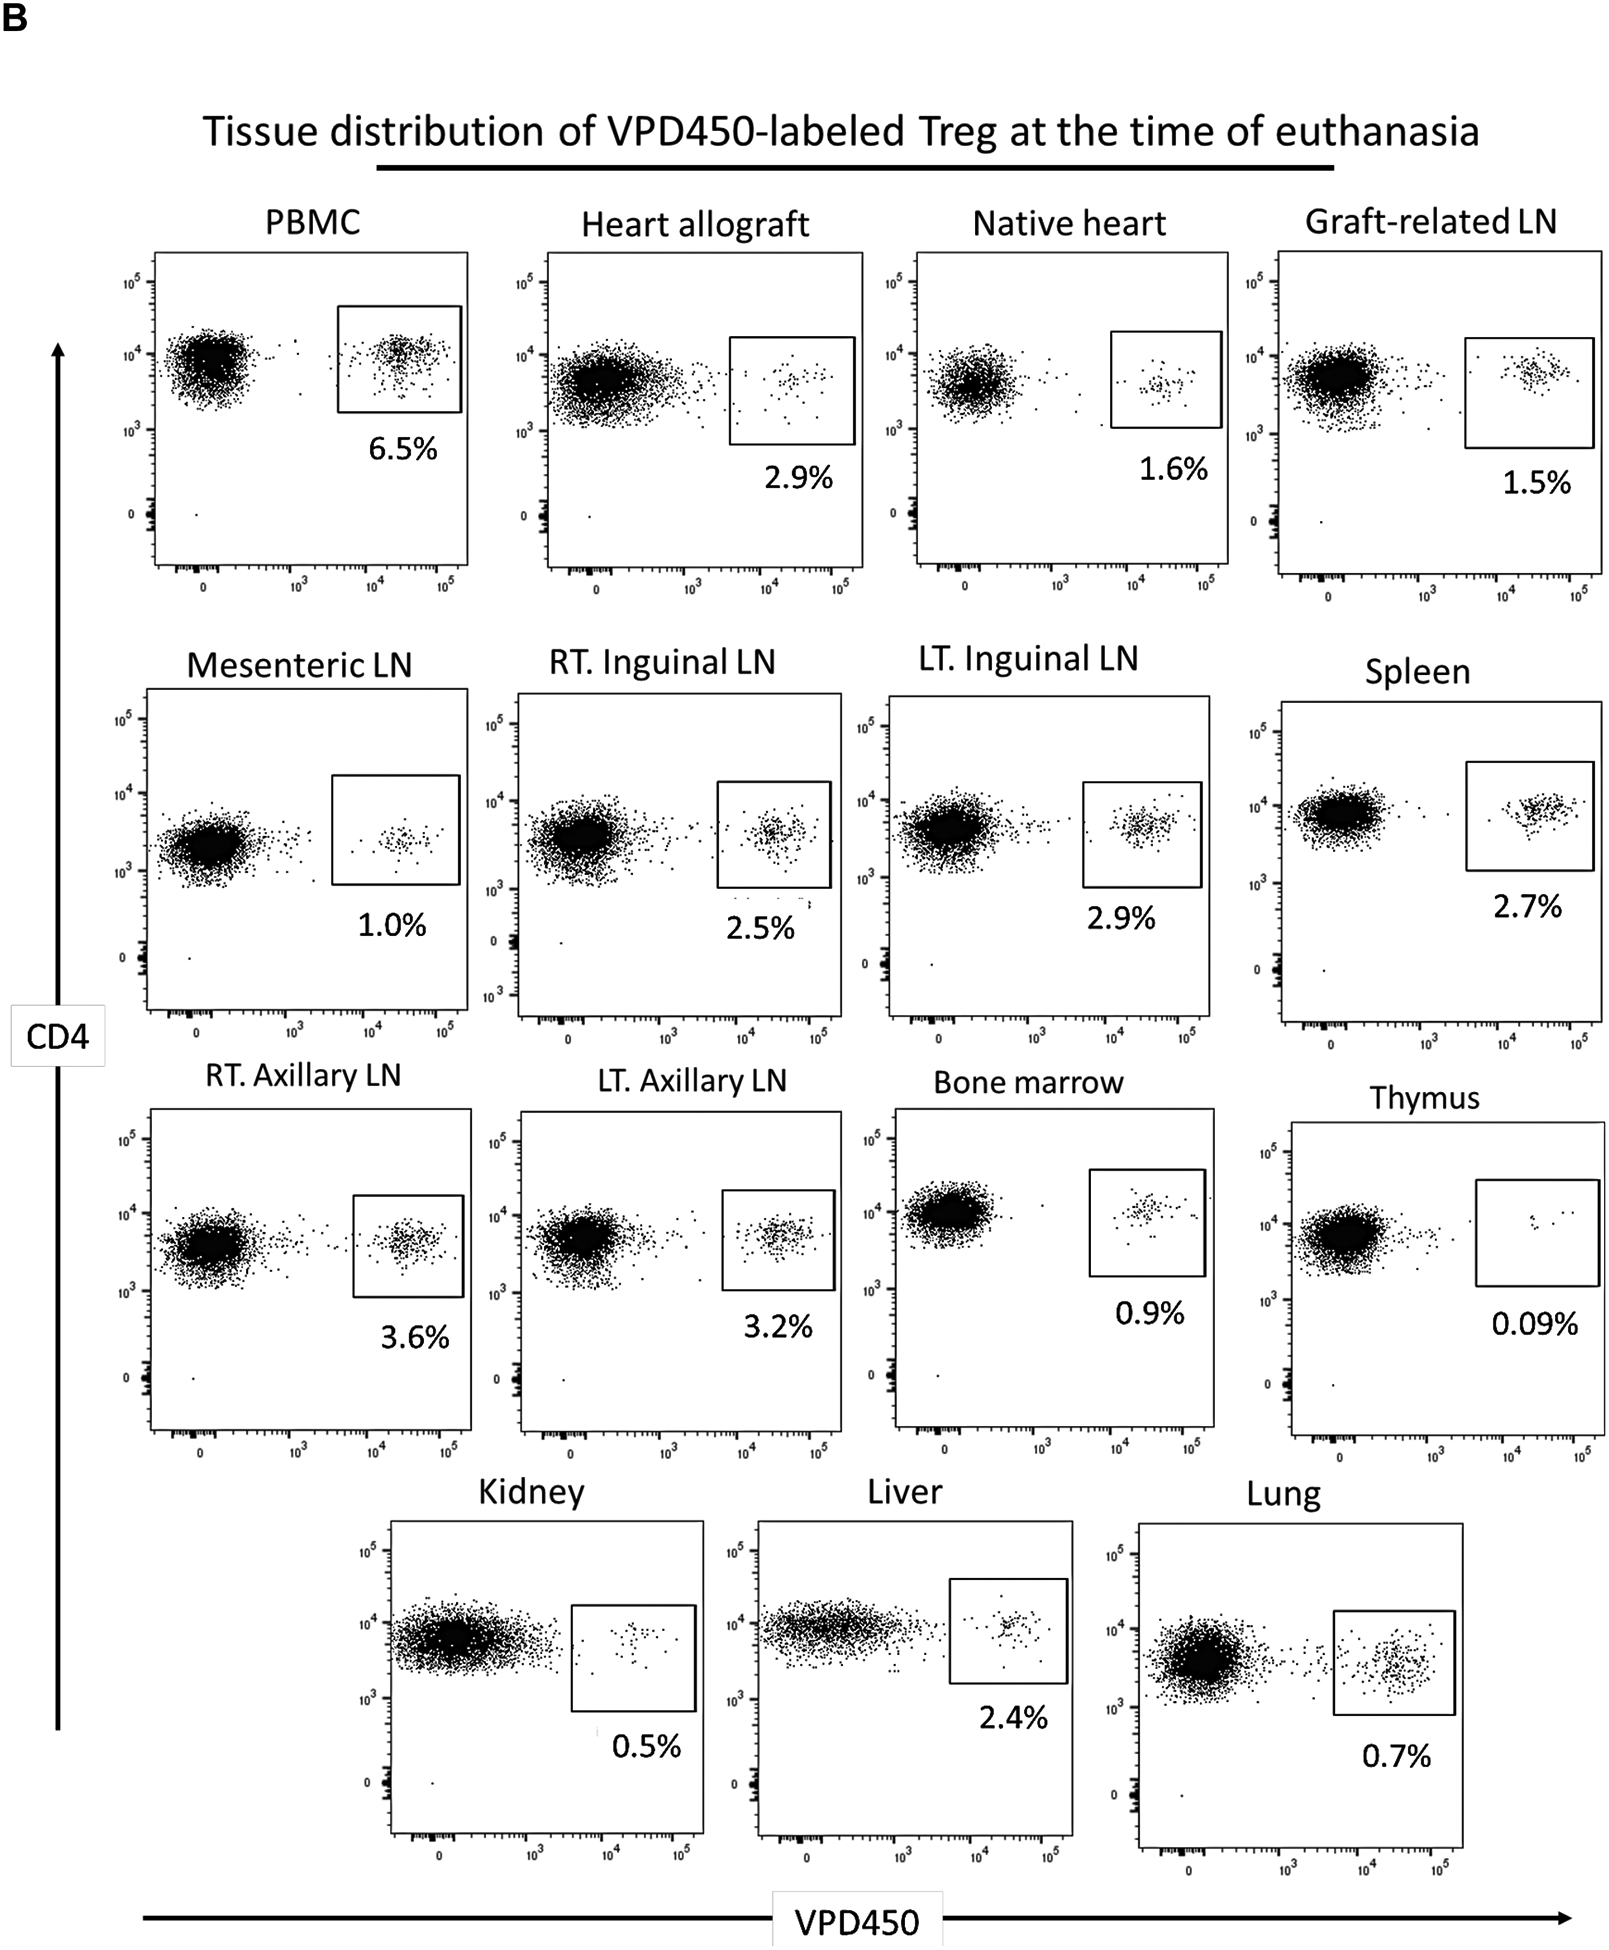
Methods: darTreg were expanded ex vivo from flow-sorted, circulating Treg using activated donor B cells and infused posttransplant into recipients of major histocompatibility complex-mismatched heart allografts. Fluorochrome-labeled darTreg were identified and characterized in peripheral blood, lymphoid, and nonlymphoid tissues and the graft by flow cytometric analysis.

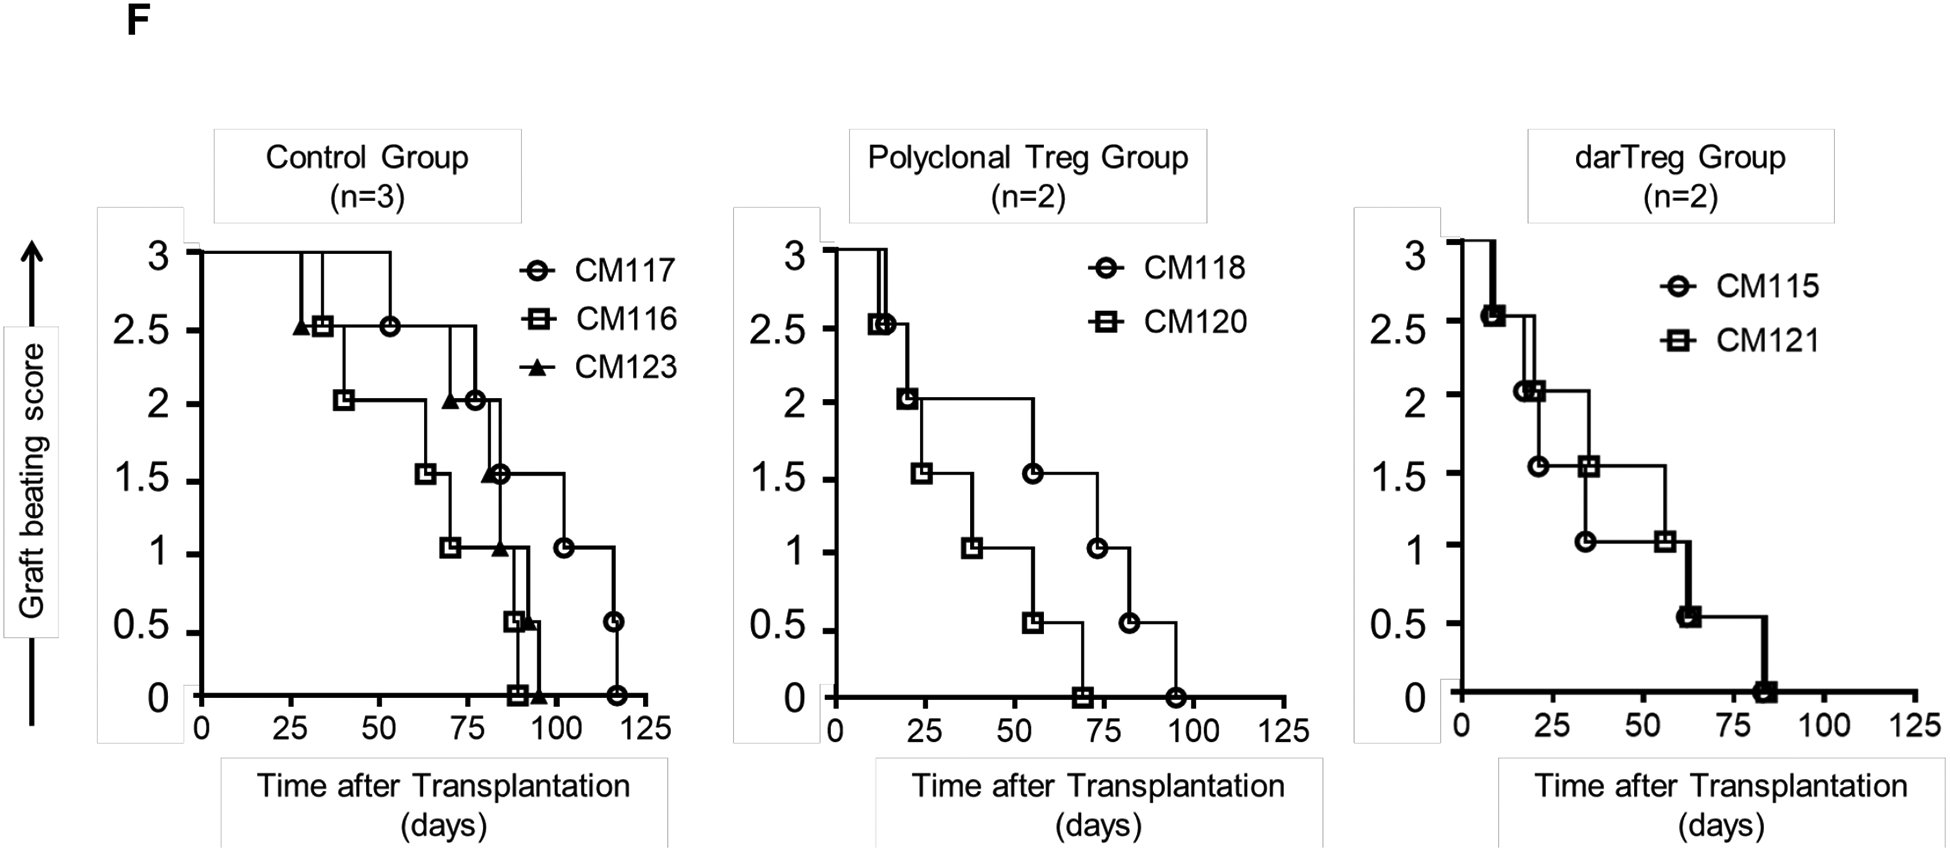
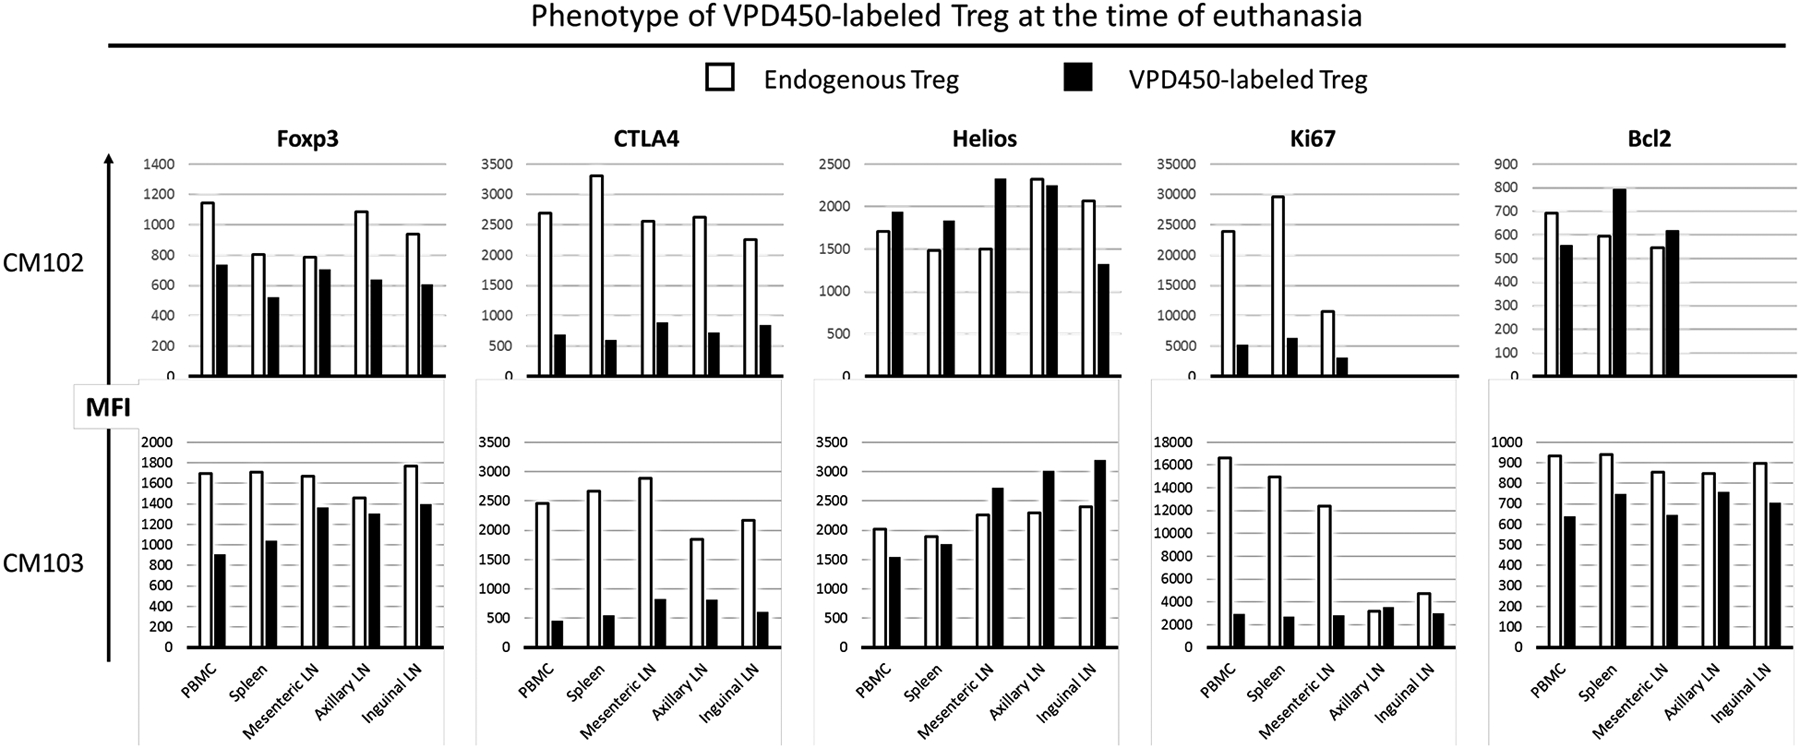
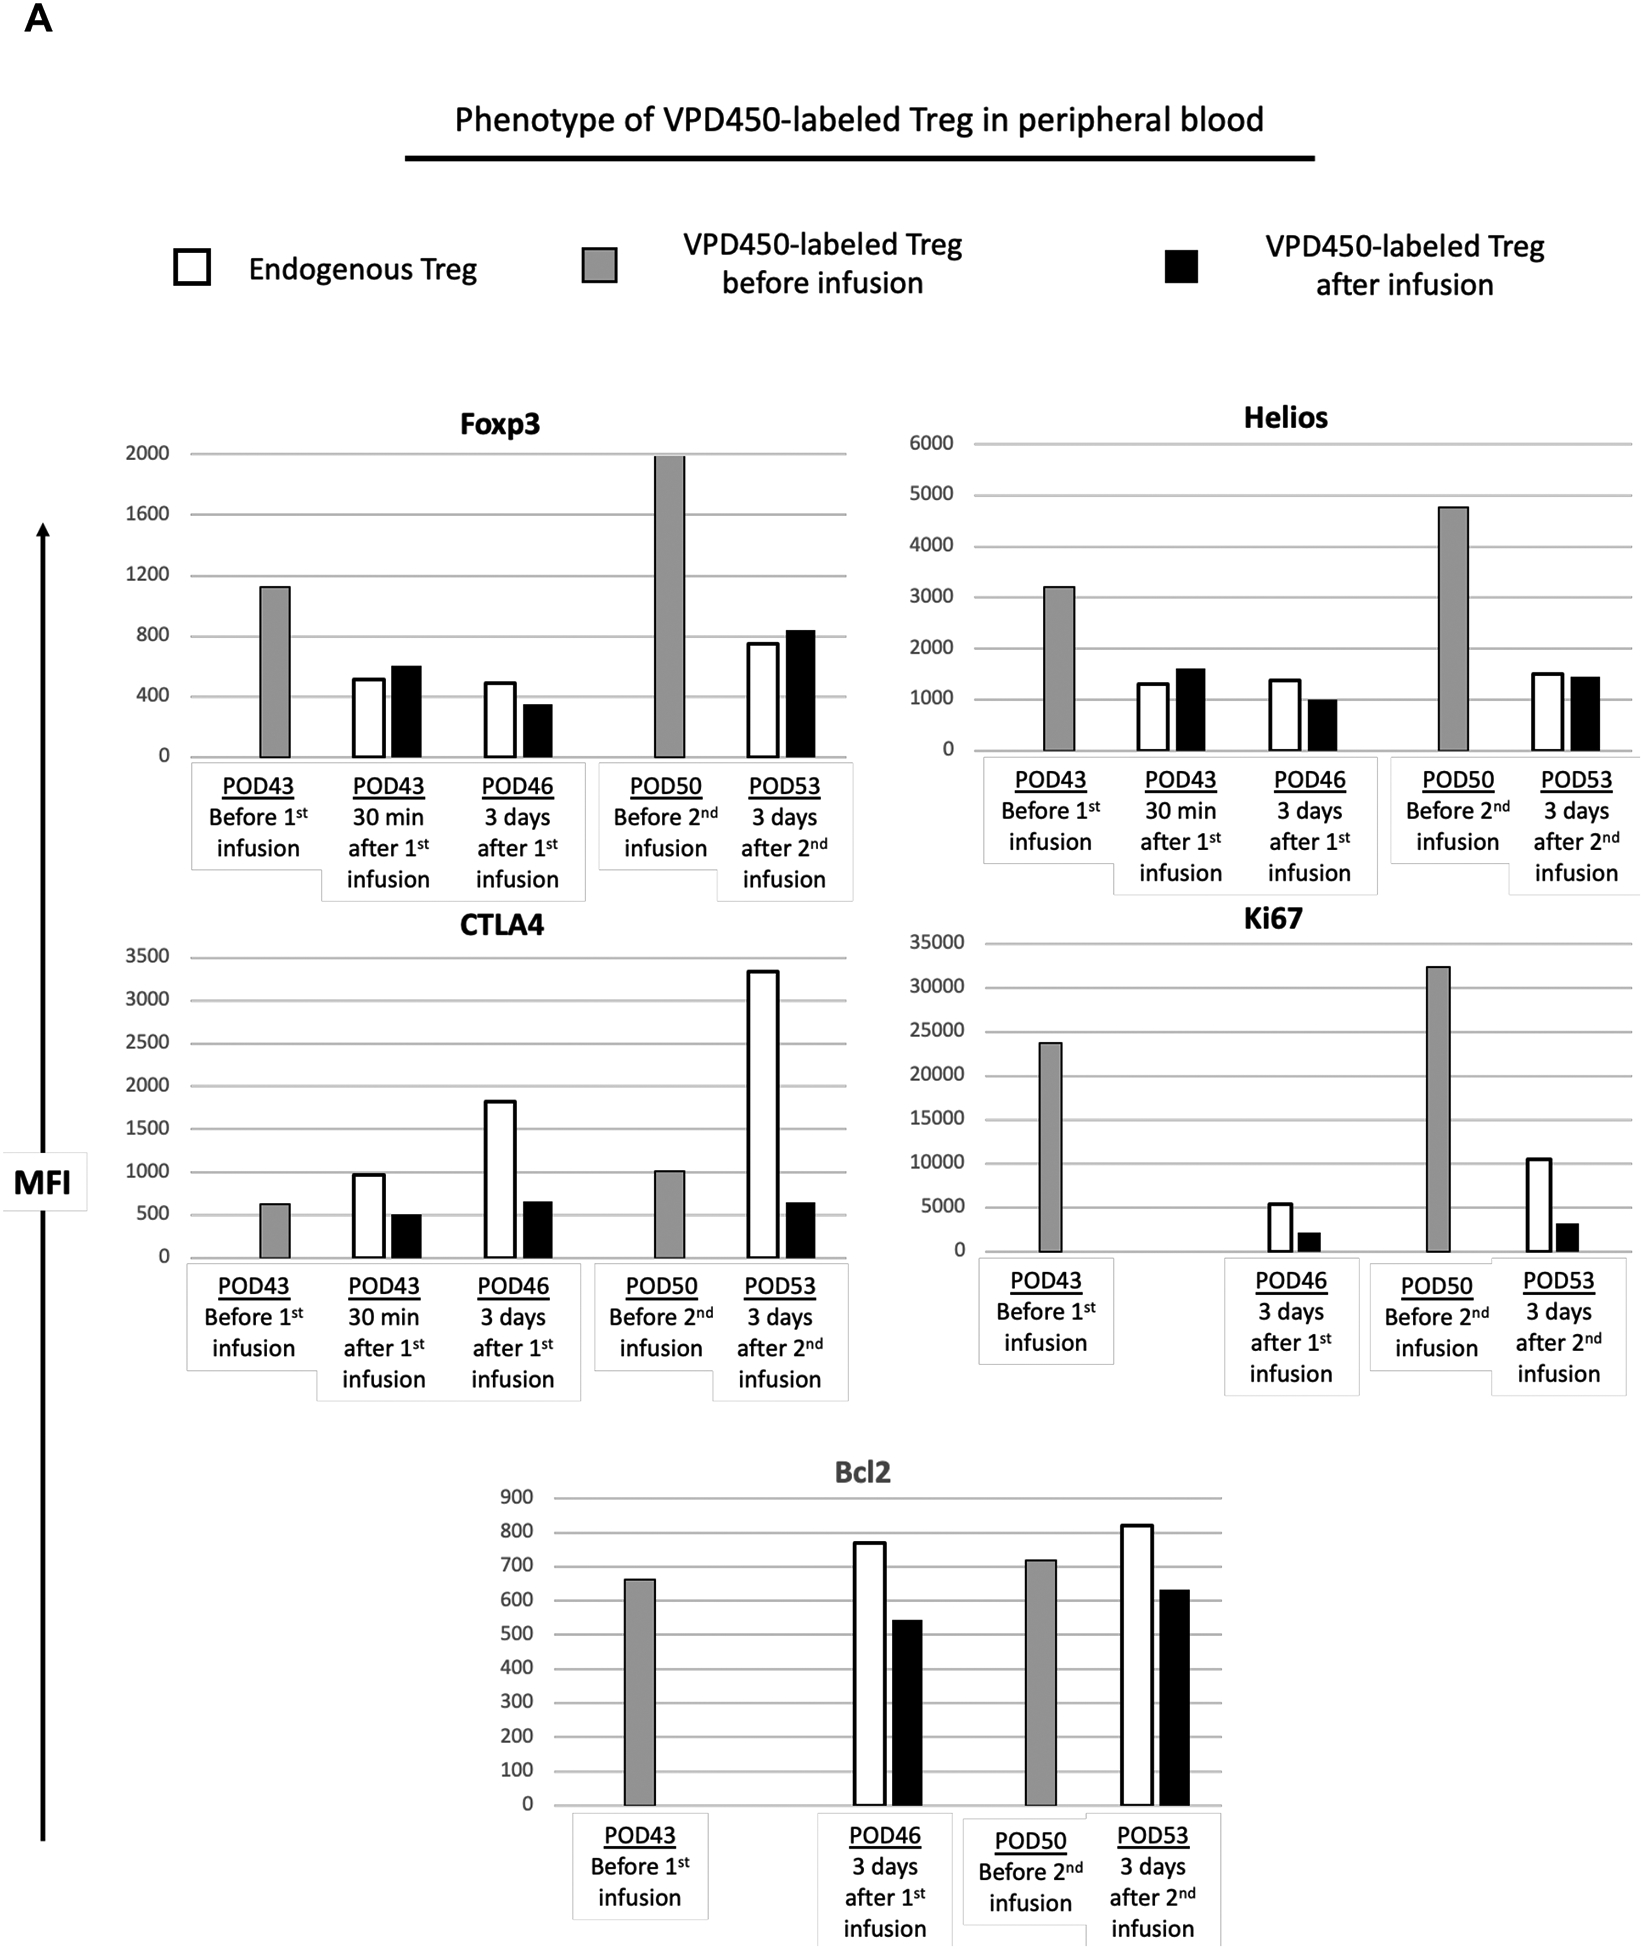
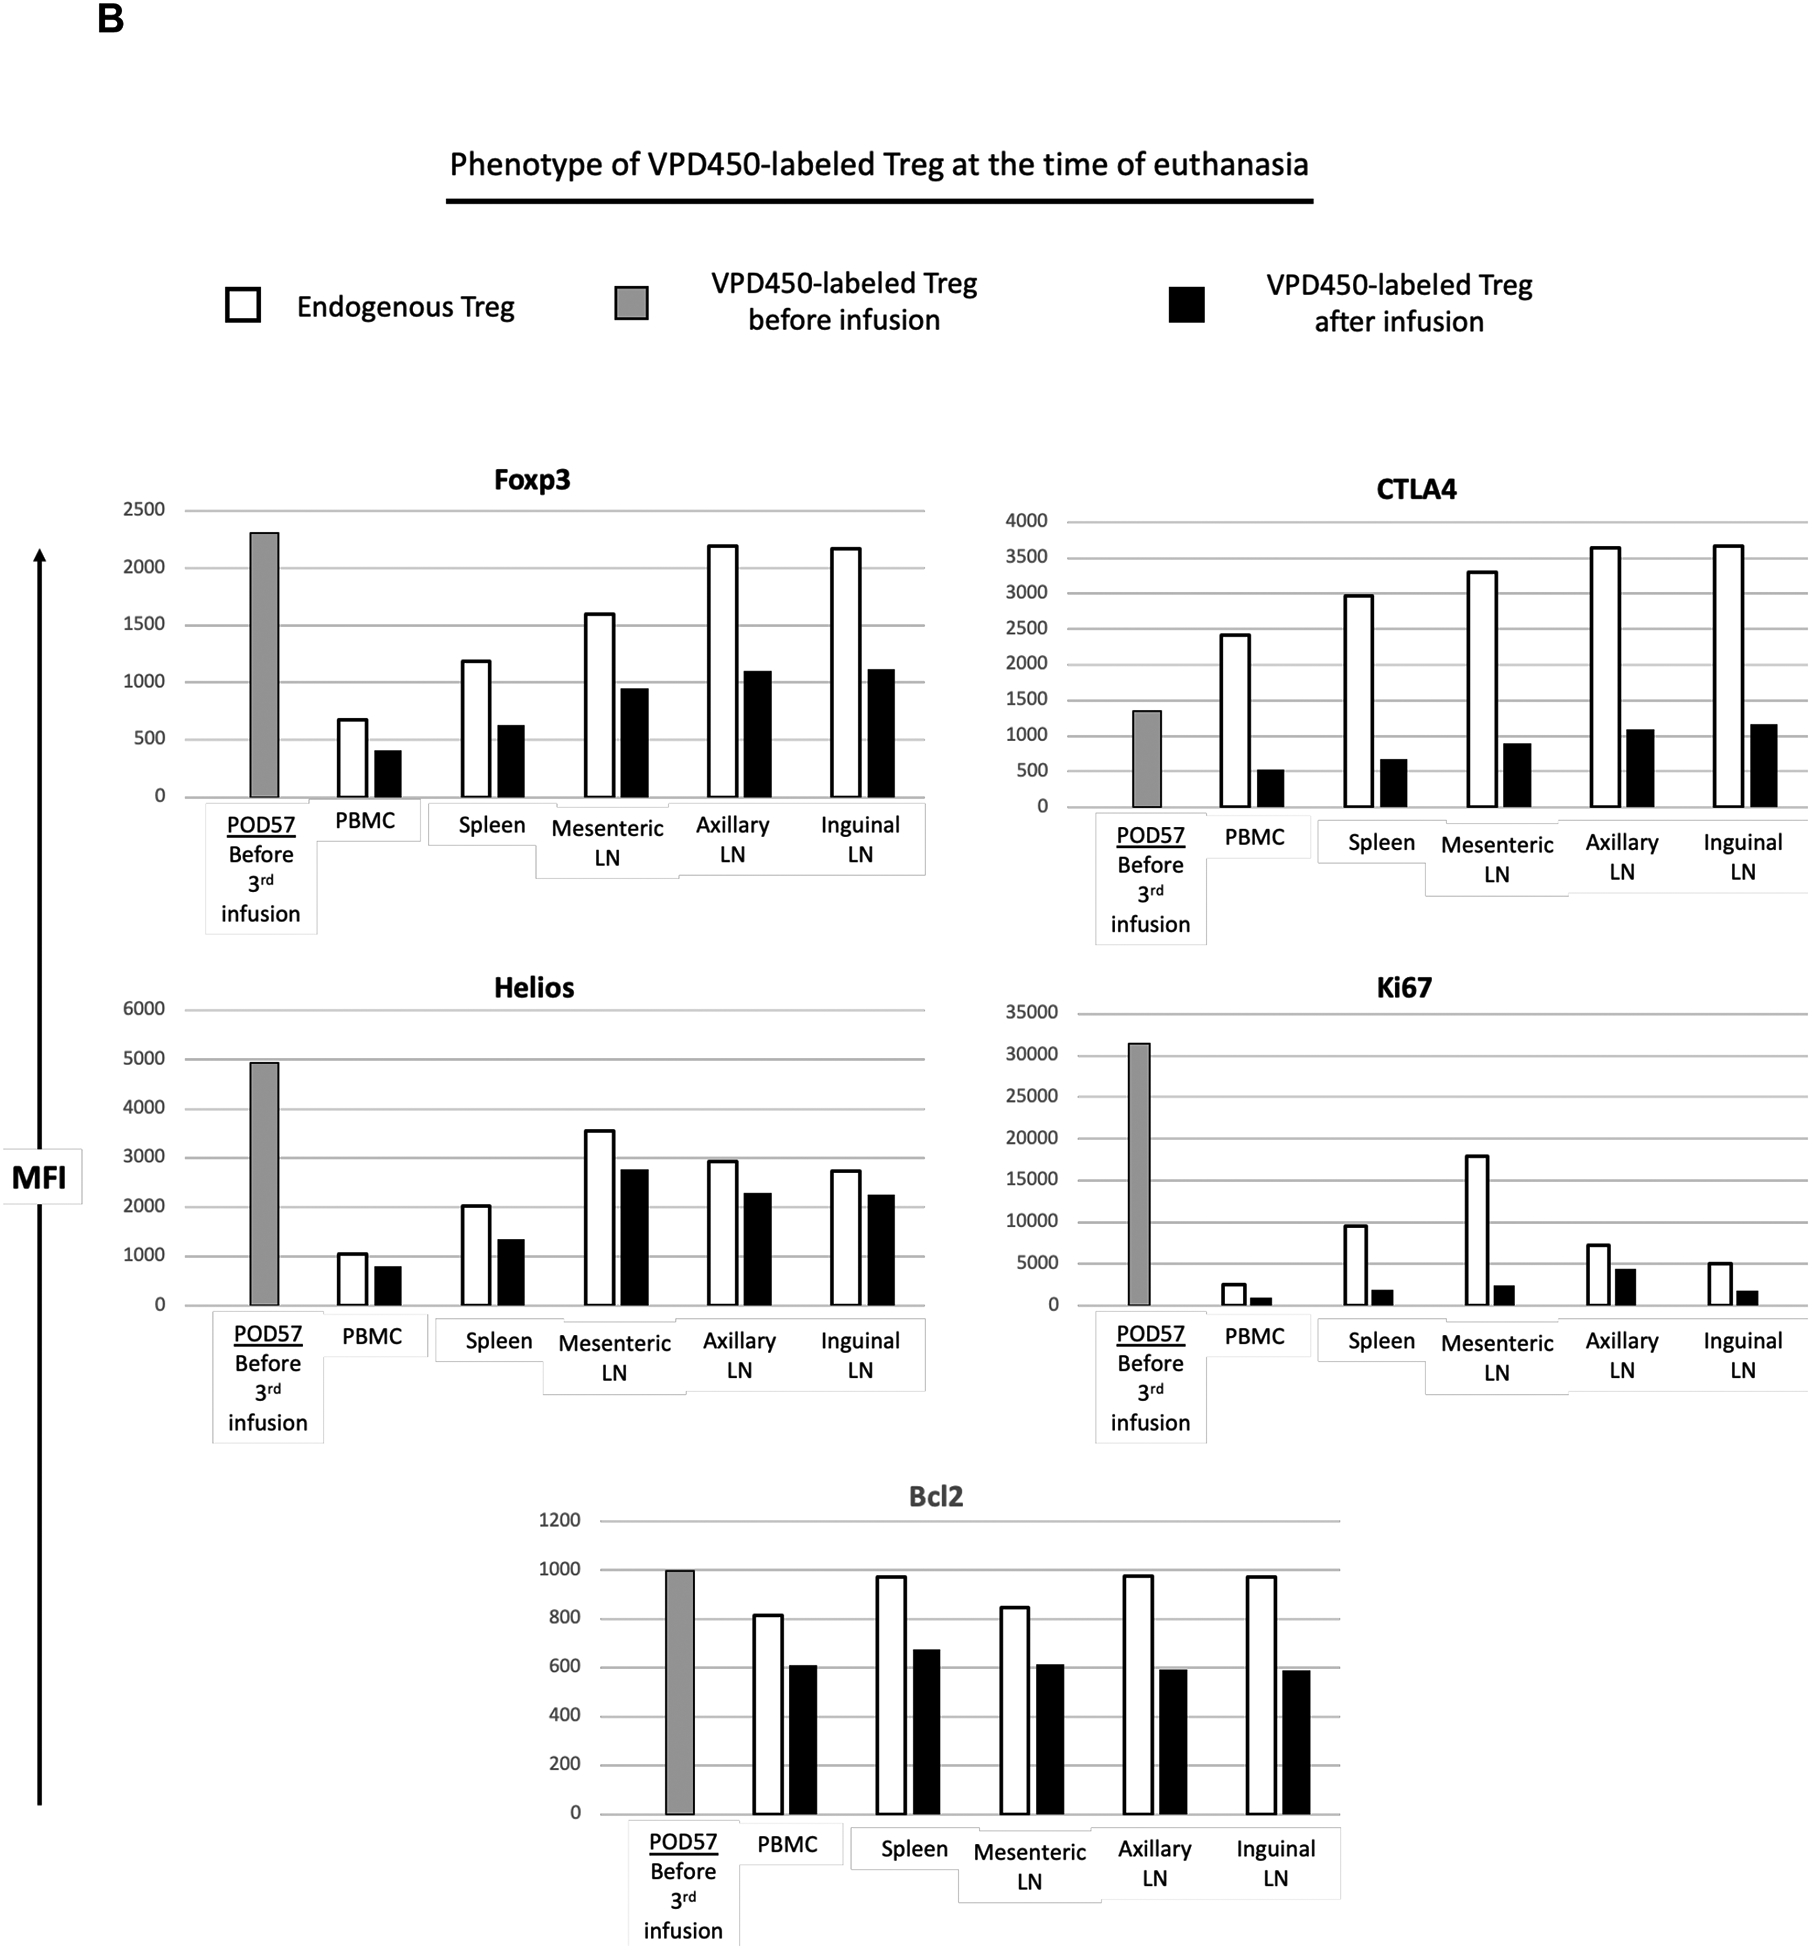
Results: darTreg selectively suppressed autologous T cell responses to donor antigens in vitro. However, following their adoptive transfer after transplantation, graft survival was not prolonged. Early (within 2 wk posttransplant; under ATG, tacrolimus, and anti-IL-6R) or delayed (6-8 wk posttransplant; under rapamycin) darTreg infusion resulted in a rapid decline in transferred darTreg in peripheral blood. Following their early or delayed infusion, labeled cells were evident in lymphoid and nonlymphoid organs and the graft at low percentages (<4% CD4+ T cells). Notably, infused darTreg showed reduced expression of immunoregulatory molecules (Foxp3 and CTLA4), Helios, the proliferative marker Ki67 and antiapoptotic Bcl2, compared with preinfusion darTreg and endogenous CD4+CD25hi Treg.

Conclusions: Lack of therapeutic efficacy of infused darTreg in lymphodepleted heart graft recipients appears to reflect loss of a regulatory signature and proliferative and survival capacity shortly after infusion.


Conflict of interest statement

The authors declare no funding or conflicts of interest.

Figures

FIGURE 1.
FIGURE 1.
Heart allograft survival in ATG-treated monkeys given autologous donor Ag alloreactive (darTreg) infusions or for comparison, polyclonal Treg infusions. A, Immunosuppressive regimen. Cynomolgus monkeys received rabbit ATG intravenously (i.v.) over 4 hours on days −3 and −1 before, and on days 6 and 13 after transplant at doses of 10, 5, 5 and 5 mg/kg, respectively. Methylprednisolone was given before each ATG infusion at doses of 5, 2.5, 2.5 and 2.5 mg/kg, respectively. Anti-IL-6 receptor antagonist mAb was administered i.v. over 1 hour at 10 mg/kg on days −1, 6, 13 and 20, and then once every 4 weeks. Tacrolimus was given by intramuscular (i.m.) injection from day −3 to 14 (target whole blood trough levels: 10–15 ng/ml), followed by rapamycin (i.m.) from days 14 to 56 (target trough levels: 10–15 ng/ml), after which rapamycin was weaned slowly and discontinued completely on day 84. B, ex vivo-expansion of darTreg (n= 4 separate ex vivo-expanded darTreg preparations); C, suppression of the proliferation of autologous T cells stimulated by donor or third-party stimulators by darTreg in MLR (top). darTreg were obtained from 2nd or 3rd rounds of expansion and are representative of 8 separate suppressive assays (bottom). Percent suppression of T cell proliferation is presented on the y-axis. x-axis shows darTreg : effector cell ratios. D, Phenotype of darTreg obtained from 2nd or 3rd rounds of ex vivo expansion. E, Timing, numbers and dosages of polyclonal (top) and darTreg (bottom). POD = post-operative day. F, Graft beating scores at various times post-transplant in monkeys infused with darTreg (n=2) and in non-infused (n=3) or polyclonal Treg-infused historical controls (n=2)
FIGURE 1.
FIGURE 1.
Heart allograft survival in ATG-treated monkeys given autologous donor Ag alloreactive (darTreg) infusions or for comparison, polyclonal Treg infusions. A, Immunosuppressive regimen. Cynomolgus monkeys received rabbit ATG intravenously (i.v.) over 4 hours on days −3 and −1 before, and on days 6 and 13 after transplant at doses of 10, 5, 5 and 5 mg/kg, respectively. Methylprednisolone was given before each ATG infusion at doses of 5, 2.5, 2.5 and 2.5 mg/kg, respectively. Anti-IL-6 receptor antagonist mAb was administered i.v. over 1 hour at 10 mg/kg on days −1, 6, 13 and 20, and then once every 4 weeks. Tacrolimus was given by intramuscular (i.m.) injection from day −3 to 14 (target whole blood trough levels: 10–15 ng/ml), followed by rapamycin (i.m.) from days 14 to 56 (target trough levels: 10–15 ng/ml), after which rapamycin was weaned slowly and discontinued completely on day 84. B, ex vivo-expansion of darTreg (n= 4 separate ex vivo-expanded darTreg preparations); C, suppression of the proliferation of autologous T cells stimulated by donor or third-party stimulators by darTreg in MLR (top). darTreg were obtained from 2nd or 3rd rounds of expansion and are representative of 8 separate suppressive assays (bottom). Percent suppression of T cell proliferation is presented on the y-axis. x-axis shows darTreg : effector cell ratios. D, Phenotype of darTreg obtained from 2nd or 3rd rounds of ex vivo expansion. E, Timing, numbers and dosages of polyclonal (top) and darTreg (bottom). POD = post-operative day. F, Graft beating scores at various times post-transplant in monkeys infused with darTreg (n=2) and in non-infused (n=3) or polyclonal Treg-infused historical controls (n=2)
FIGURE 2.
FIGURE 2.
Infusion of CFSE- and VPD450-labeled darTreg early post-transplant. A, The immunosuppressive drug regimen and darTreg infusion time points (days post-transplant) for 2 heart allograft recipient monkeys (CM102 and CM103) are shown. In each recipient, CFSE-labeled darTreg were infused on post-transplant day 3 (i.e. 3 days before ATG) and VPD450-labeled darTreg were infused on day 10 (4 days after ATG). Graft recipients were electively euthanized on day 18 (CM102) or 19 (CM103) for blood, allograft and host tissue sampling. B, Number of labeled darTeg infused at each time point into each graft recipient (top). Graft beating scores at various times post-transplant in CM102 and CM103 (bottom).
FIGURE 3.
FIGURE 3.
In vivo tracking of CFSE- and VPD450-labeled darTreg infused early post-transplant in peripheral blood. A, Peripheral blood analysis of CFSE-labeled darTreg in heart allograft recipients (CM102 and CM103) on post-operative day (POD) 5 and 6 (i.e. 2 and 3 days respectively after their infusion). B, Peripheral blood analysis of VPD450- and CFSE-labeled darTreg in the same heart allograft recipients on POD 10, 12, 13, and 15 (i.e. 30 min, and 2, 3 and 5 days respectively after infusion of the VPD450-labeled darTreg,). Dot plots represent flow data after gating on total CD4+ T cells. Absolute numbers of labeled darTreg (cells/μL) are also shown.
FIGURE 3.
FIGURE 3.
In vivo tracking of CFSE- and VPD450-labeled darTreg infused early post-transplant in peripheral blood. A, Peripheral blood analysis of CFSE-labeled darTreg in heart allograft recipients (CM102 and CM103) on post-operative day (POD) 5 and 6 (i.e. 2 and 3 days respectively after their infusion). B, Peripheral blood analysis of VPD450- and CFSE-labeled darTreg in the same heart allograft recipients on POD 10, 12, 13, and 15 (i.e. 30 min, and 2, 3 and 5 days respectively after infusion of the VPD450-labeled darTreg,). Dot plots represent flow data after gating on total CD4+ T cells. Absolute numbers of labeled darTreg (cells/μL) are also shown.
FIGURE 4.
FIGURE 4.
Incidences of CFSE- and VPD450-labeled darTreg infused early post-transplant in peripheral blood, lymphoid tissues, non-lymphoid organs and the allograft at the time of euthanasia. A, Incidences of VPD450- and CFSE-labeled darTreg infused into monkeys CM102 and CM103 were evaluated 18/19 days post-transplant in (blood, kidney, liver and the heart allograft, thymus, and B, mesenteric, axillary and inguinal lymph nodes (LN), spleen and bone marrow. Dot plots represent flow data obtained after gating on total CD4+ T cells. Absolute numbers of labeled darTreg (cells/μL) are also shown.
FIGURE 5.
FIGURE 5.
Phenotype of VPD450-labeled darTreg infused early post-transplant in peripheral blood and lymphoid tissues at the time of euthanasia. In the 2 heart graft recipients (CM102 and CM103), the phenotype of VPD450-labeled darTreg was evaluated in blood, mesenteric, axillary and inguinal lymph nodes (LN) and spleen at the time of euthanasia 18/19 days post-transplant. MFI (mean fluorescence intensity) values of VPD450-labeled darTreg were determined simultaneously with MFI of native (endogenous) CD4+CD25hi Treg.
FIGURE 6.
FIGURE 6.
Delayed infusion of darTreg post-transplant. A, Immunosuppressive drug regimen and darTreg infusion time points (days post-transplant) in one heart allograft recipient cynomolgus monkey (CM220). Infusions of VPD450-labeled darTreg were given on post-operative day (POD) 43, 50 and 57 (i.e. 30, 37 and 42 days after the final ATG infusion). B, Numbers of labeled darTeg infused at each timepoint (top). Graft beating scores at various times post-transplant in CM220 (bottom). The graft recipient was electively euthanized on POD 63 for blood, allograft and host tissue sampling.
FIGURE 7.
FIGURE 7.
Incidences of VPD450-labeled darTreg following their delayed infusion post-transplant in peripheral blood, lymphoid tissues and non-lymphoid organs at the time of euthanasia. A, Peripheral blood analysis of VPD450-labeled darTreg in CM220 on post-operative day (POD) 46, 50 and 57 (i.e. 3, 7 and 14 days respectively after their infusion). Absolute numbers of labeled darTreg (cells/μL) are also shown. B, Incidences of VPD450-labeled darTreg in blood, the heart allograft, native heart, lung, kidney, liver, graft-draining lymph node (LN), mesenteric LN, right (RT) and left (LT) inguinal LN, spleen, RT and LT axillary LN, bone marrow and thymus at the time of euthanasia, 63 days post-transplant. Dot plots represent flow data after gating on total CD4+ T cells.
FIGURE 7.
FIGURE 7.
Incidences of VPD450-labeled darTreg following their delayed infusion post-transplant in peripheral blood, lymphoid tissues and non-lymphoid organs at the time of euthanasia. A, Peripheral blood analysis of VPD450-labeled darTreg in CM220 on post-operative day (POD) 46, 50 and 57 (i.e. 3, 7 and 14 days respectively after their infusion). Absolute numbers of labeled darTreg (cells/μL) are also shown. B, Incidences of VPD450-labeled darTreg in blood, the heart allograft, native heart, lung, kidney, liver, graft-draining lymph node (LN), mesenteric LN, right (RT) and left (LT) inguinal LN, spleen, RT and LT axillary LN, bone marrow and thymus at the time of euthanasia, 63 days post-transplant. Dot plots represent flow data after gating on total CD4+ T cells.
FIGURE 8.
FIGURE 8.
Phenotype of VPD450-labeled darTreg following their delayed infusion post-transplant in peripheral blood and lymphoid tissues at the time of euthanasia. A, In monkey CM220, PBMC samples collected on POD 43, 46 and 53 were evaluated for VPD450-labeled darTreg phenotype in comparison to endogenous (native) CD4+CD25hi Treg. For comparison, VPD450-labeled darTreg were analyzed on days 43 and 50 immediately before infusion. B, At the time of euthanasia, 63 days post-transplant, the phenotype of VPD450-labeled darTreg was evaluated in mesenteric, axillary and inguinal lymph nodes (LN), and spleen. MFI (mean fluorescence intensity) values of VPD450-labeled darTreg were determined simultaneously with MFI of native (endogenous) CD4+CD25hi Treg. In A and B, white bars indicate native (endogenous) Treg; black bars indicate VPD450-labeled darTreg in blood or lymphoid tissues after infusion. Gray bars indicate VPD450-labeled darTreg before infusion.
FIGURE 8.
FIGURE 8.
Phenotype of VPD450-labeled darTreg following their delayed infusion post-transplant in peripheral blood and lymphoid tissues at the time of euthanasia. A, In monkey CM220, PBMC samples collected on POD 43, 46 and 53 were evaluated for VPD450-labeled darTreg phenotype in comparison to endogenous (native) CD4+CD25hi Treg. For comparison, VPD450-labeled darTreg were analyzed on days 43 and 50 immediately before infusion. B, At the time of euthanasia, 63 days post-transplant, the phenotype of VPD450-labeled darTreg was evaluated in mesenteric, axillary and inguinal lymph nodes (LN), and spleen. MFI (mean fluorescence intensity) values of VPD450-labeled darTreg were determined simultaneously with MFI of native (endogenous) CD4+CD25hi Treg. In A and B, white bars indicate native (endogenous) Treg; black bars indicate VPD450-labeled darTreg in blood or lymphoid tissues after infusion. Gray bars indicate VPD450-labeled darTreg before infusion.

Similar articles

Cited by

References

    1. Sicard A, Boardman DA, Levings MK. Taking regulatory T-cell therapy one step further. Curr Opin Organ Transplant 2018;23:509–515. - PubMed
    1. Romano M, Tung SL, Smyth LA, et al.Treg therapy in transplantation: a general overview. Transpl Int 2017;30:745–753. - PubMed
    1. Wood KJ, Bushell A, Hester J. Regulatory immune cells in transplantation. Nat Rev Immunol 2012;12:417–430. - PubMed
    1. Kang SM, Tang Q, Bluestone JA. CD4+CD25+ regulatory T cells in transplantation: progress, challenges and prospects. Am J Transplant 2007;7:1457–1463. - PubMed
    1. Tang Q, Vincenti F. Transplant trials with Tregs: perils and promises. J Clin Invest 2017;127:2505–2512. - PMC - PubMed

Publication types

MeSH terms