

Metabolism and global protein glycosylation are differentially expressed in healthy and osteoarthritic equine carpal synovial fluid
- PMID: 33587757
- PMCID: PMC8364562
- DOI: 10.1111/evj.13440
Metabolism and global protein glycosylation are differentially expressed in healthy and osteoarthritic equine carpal synovial fluid
Abstract
Background: Carpal osteochondral fragmentation and subsequent post-traumatic osteoarthritis (PTOA) are leading causes of wastage in the equine athlete. Identification of synovial fluid biomarkers could contribute to the diagnosis and understanding of osteoarthritis (OA) pathophysiology.
Objective: The aim of this study was to identify differentially expressed metabolic and glycosylation pathways in synovial fluid from healthy horses and horses with naturally occurring carpal OA.
Study design: Cross-sectional, in vivo metabolomics and glycomics study.
Methods: In cohort 1, carpal synovial fluid (n = 12 horses; n = 6 healthy, n = 6 OA) was analysed using high-resolution liquid chromatography mass spectrometry (LC-MS). In cohort 2 (n = 40 horses; n = 20 healthy, n = 20 OA), carpal synovial fluid was analysed using lectin microarrays and a lubricin sandwich ELISA.
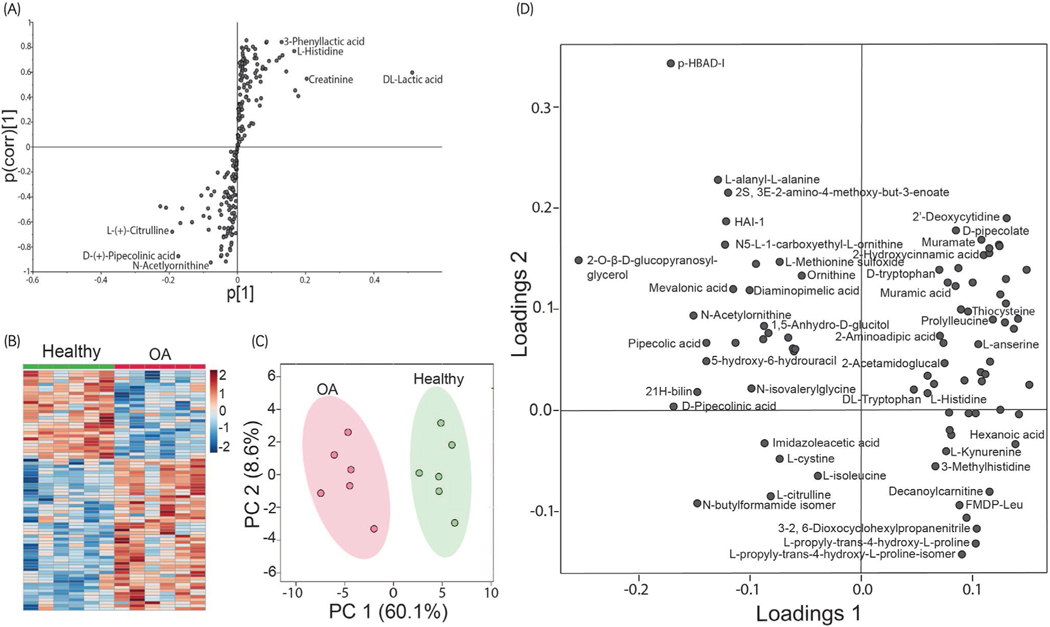
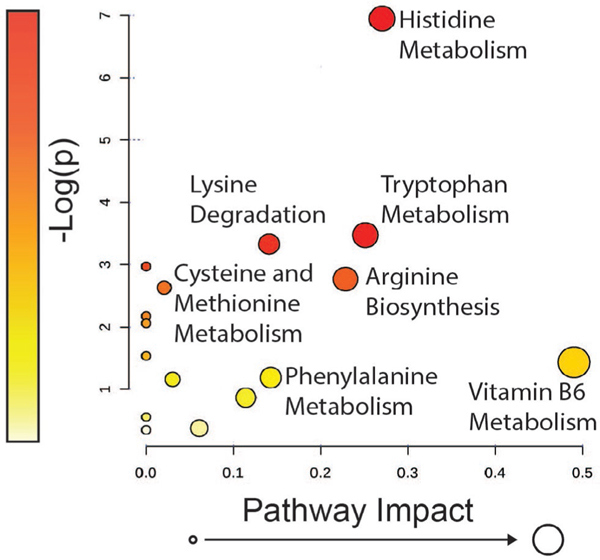
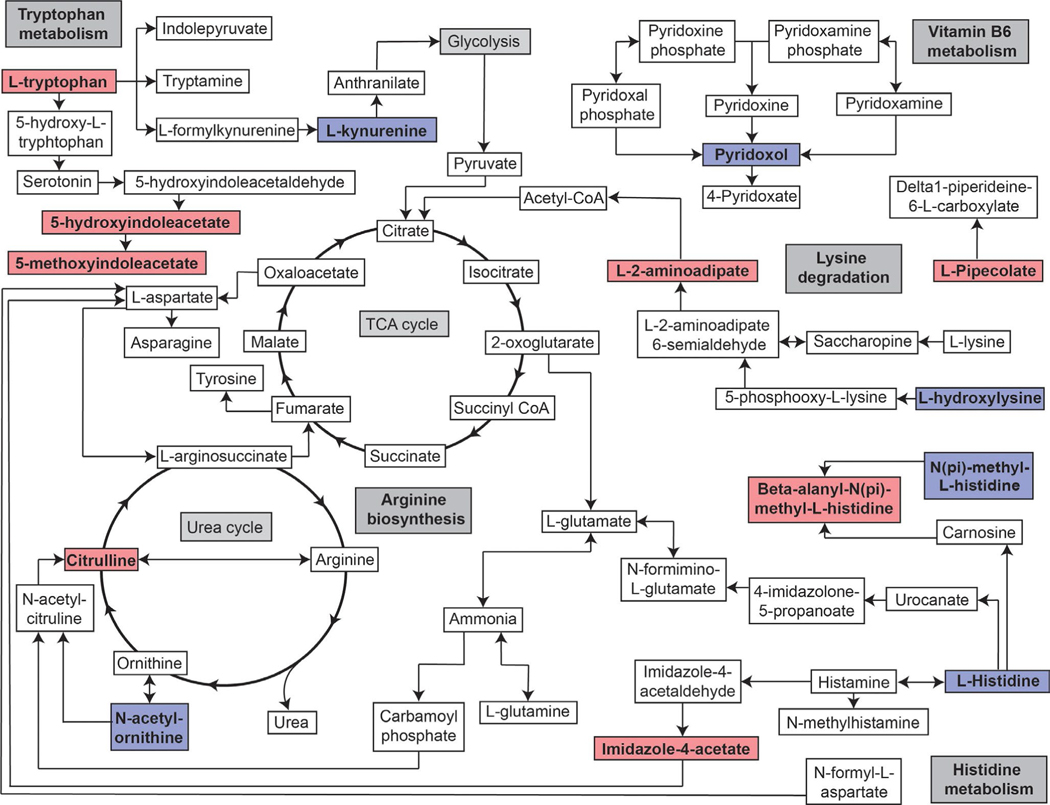
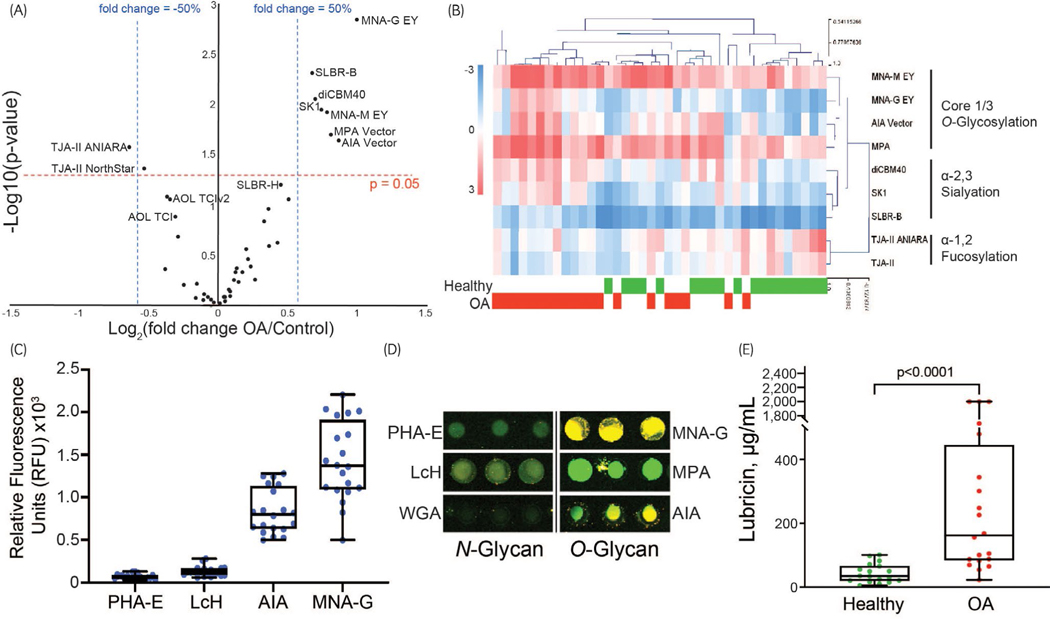
Results: Metabolomic analysis identified >4900 LC-MS features of which 84 identifiable metabolites were differentially expressed (P < .05) between healthy and OA joints, including key pathways related to inflammation (histidine and tryptophan metabolism), oxidative stress (arginine biosynthesis) and collagen metabolism (lysine metabolism). Principle Component Analysis and Partial Least Squares Discriminant Analysis demonstrated separation between healthy and OA synovial fluid. Lectin microarrays identified distinct glycosylation patterns between healthy and OA synovial fluid, including increased Core 1/Core 3 O-glycosylation, increased α-2,3 sialylation and decreased α-1,2 fucosylation in OA. O-glycans predominated over N-glycans in all synovial fluid samples, and synovial fluid lubricin was increased in OA joints as compared to controls.
Main limitations: The sample size in cohort 1 was limited, and there is inherent variation in severity and duration of joint injury in naturally occurring OA. However, LC-MS identified up to 5000 unique features.
Conclusions: These data suggest new potential diagnostic and therapeutic targets for equine OA. Future targeted metabolomic and glycomic studies should be performed to verify these results. Lectin microarrays could be investigated as a potential screening tool for the diagnosis and therapeutic monitoring of equine OA.
Keywords: O-glycosylation; glycomics; horse; lectin microarray; lubricin/proteoglycan 4; mass spectrometry; metabolomics.
© 2021 EVJ Ltd.
Conflict of interest statement
CONFLICT OF INTERESTS
No competing interests have been declared.
Figures
References
-
- McIlwraith CW. Arthroscopic surgery for osteochondral chip fragments and other lesions not requiring internal fixation in the carpal and fetlock joints of the equine athlete: what have we learned in 20 years? Clin Tech Equine Pract. 2002;1(4):200–10.
-
- McIlwraith CW, Kawcak CE, Frisbie DD, Little CB, Clegg PD, Peffers MJ, et al. Biomarkers for equine joint injury and osteoarthritis. J Orthop Res. 2018;36:823–31. - PubMed
-
- McIlwraith CW, Clegg PD. Science in brief: report on the Havemeyer Foundation workshop on equine musculoskeletal biomarkers— current knowledge and future needs. Equine Vet J. 2014;46:651–3. - PubMed
MeSH terms
Substances
Grants and funding
LinkOut - more resources
Full Text Sources
Other Literature Sources
Medical
