. 2021 May:94:437-457.
doi: 10.1016/j.bbi.2021.02.001. Epub 2021 Feb 13.

Microglia-derived interleukin-10 accelerates post-intracerebral hemorrhage hematoma clearance by regulating CD36

Affiliations

Microglia-derived interleukin-10 accelerates post-intracerebral hemorrhage hematoma clearance by regulating CD36

Qian Li et al. Brain Behav Immun. 2021 May.

Abstract

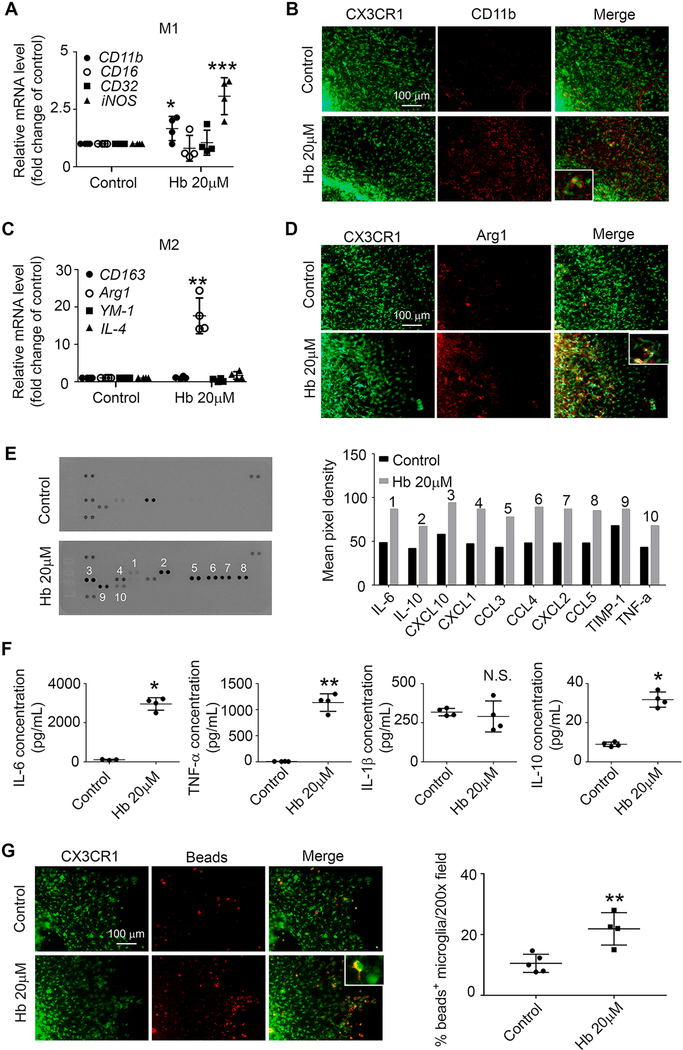
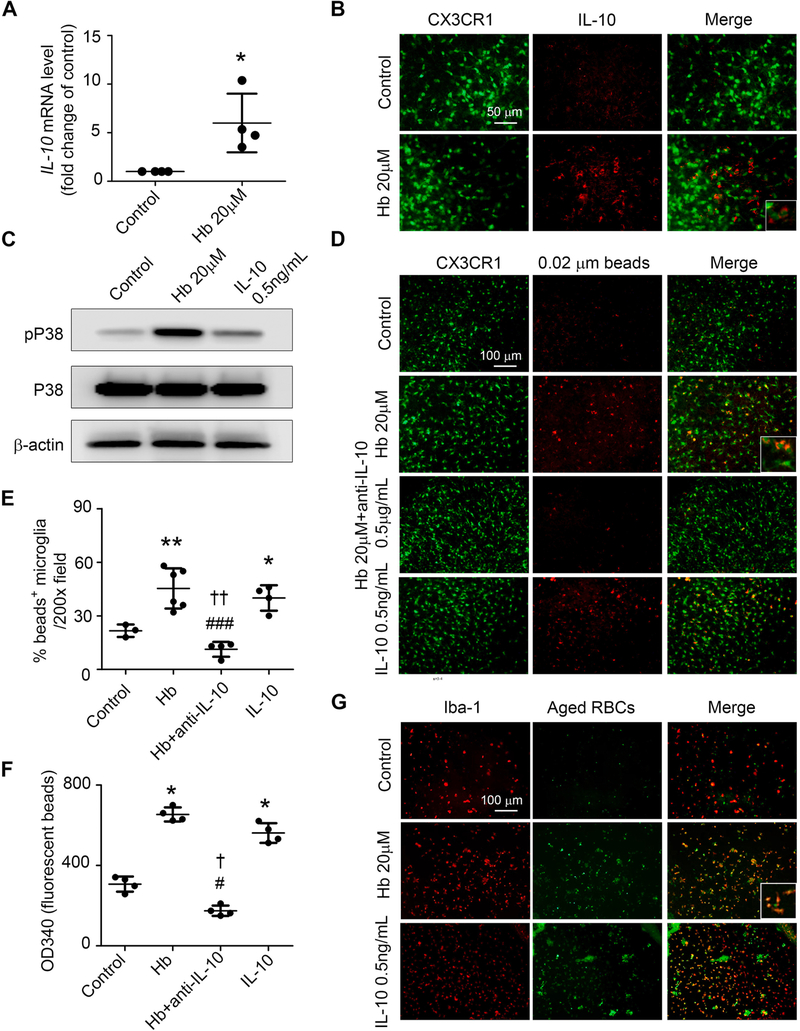
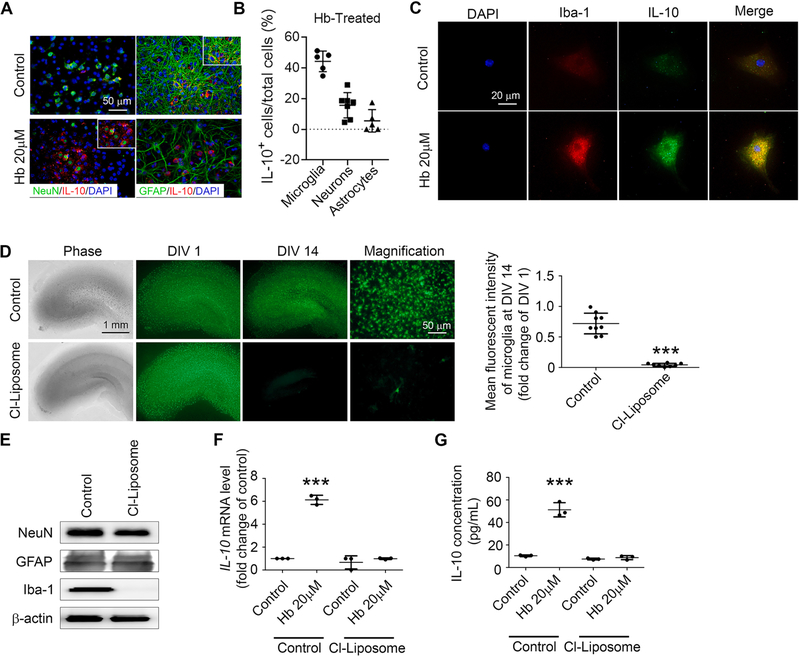
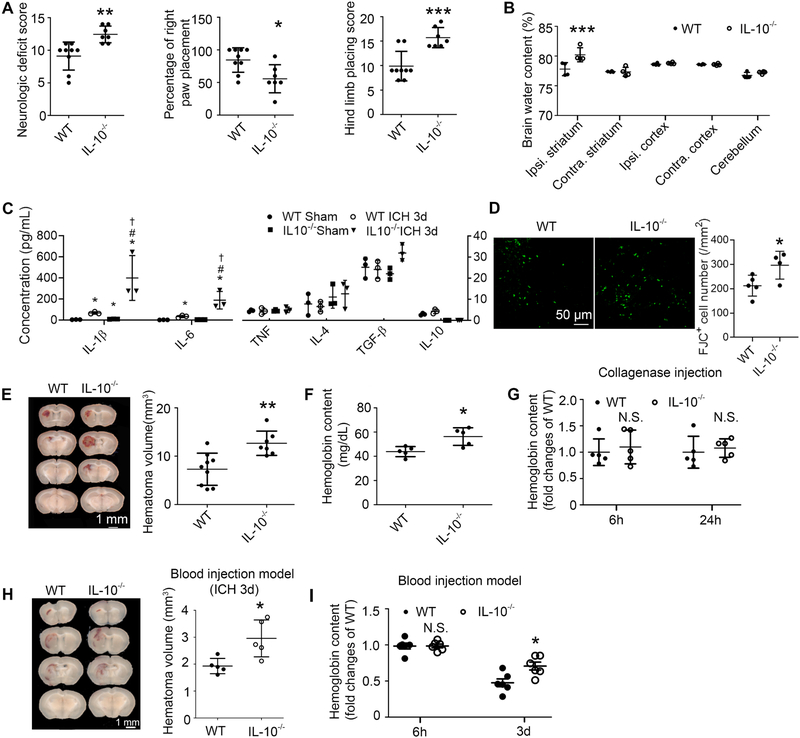
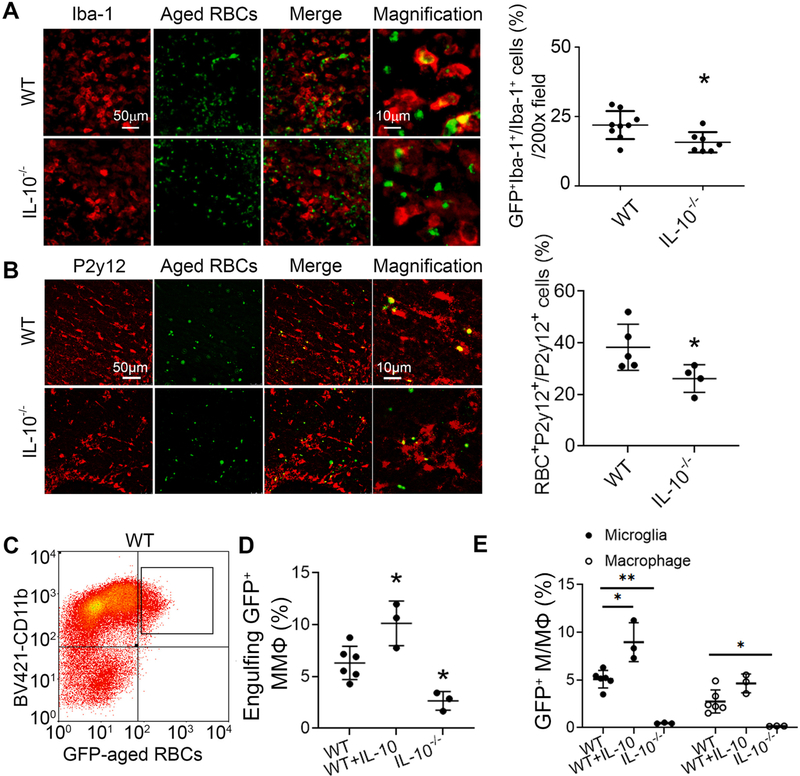
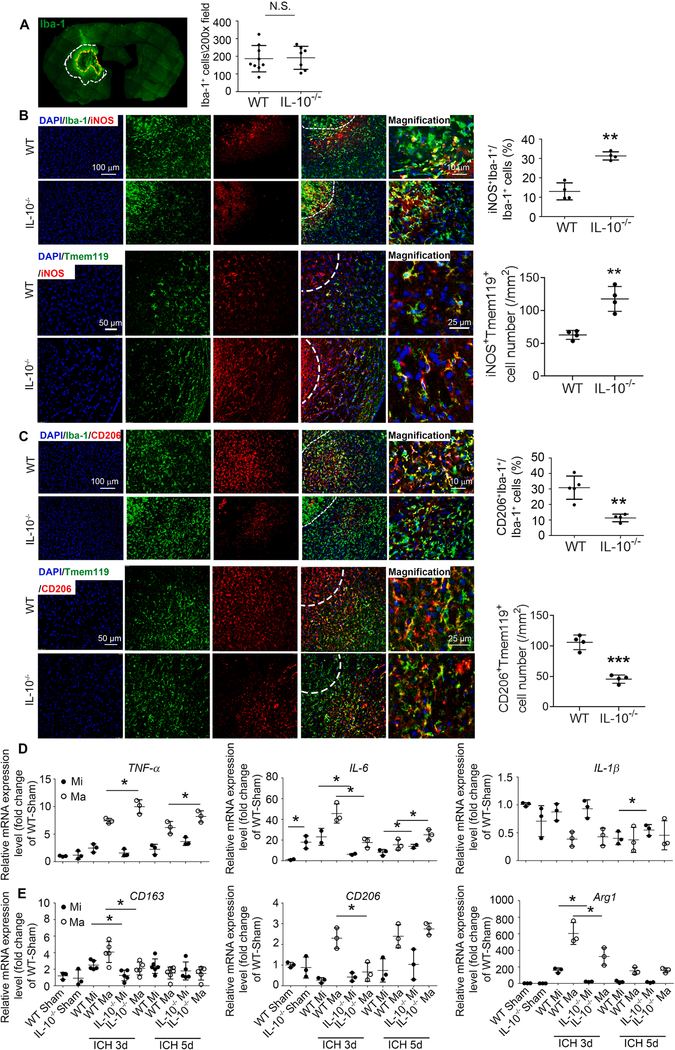
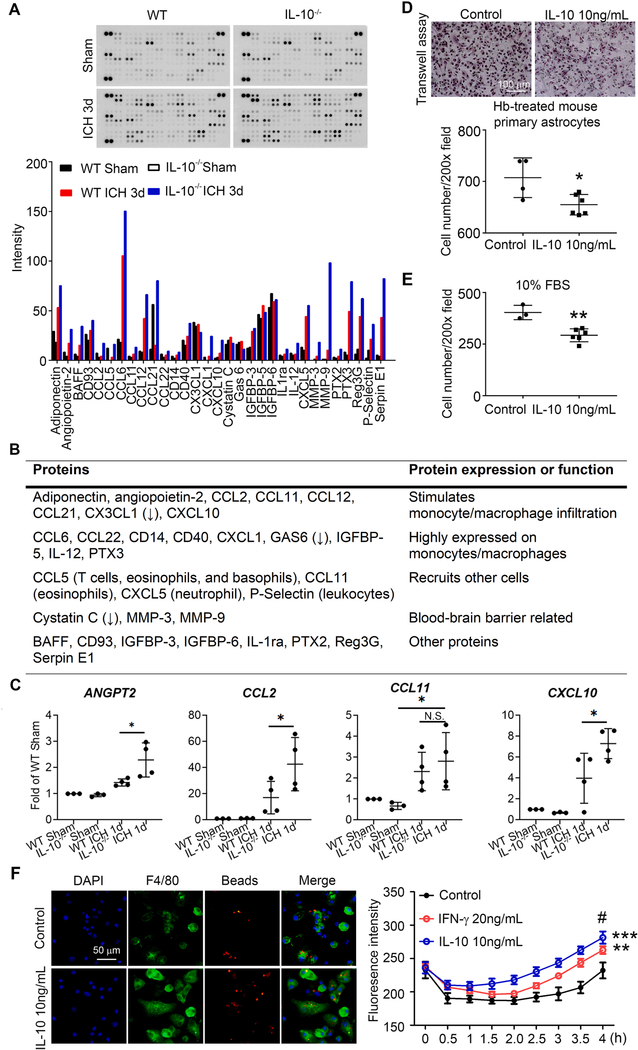
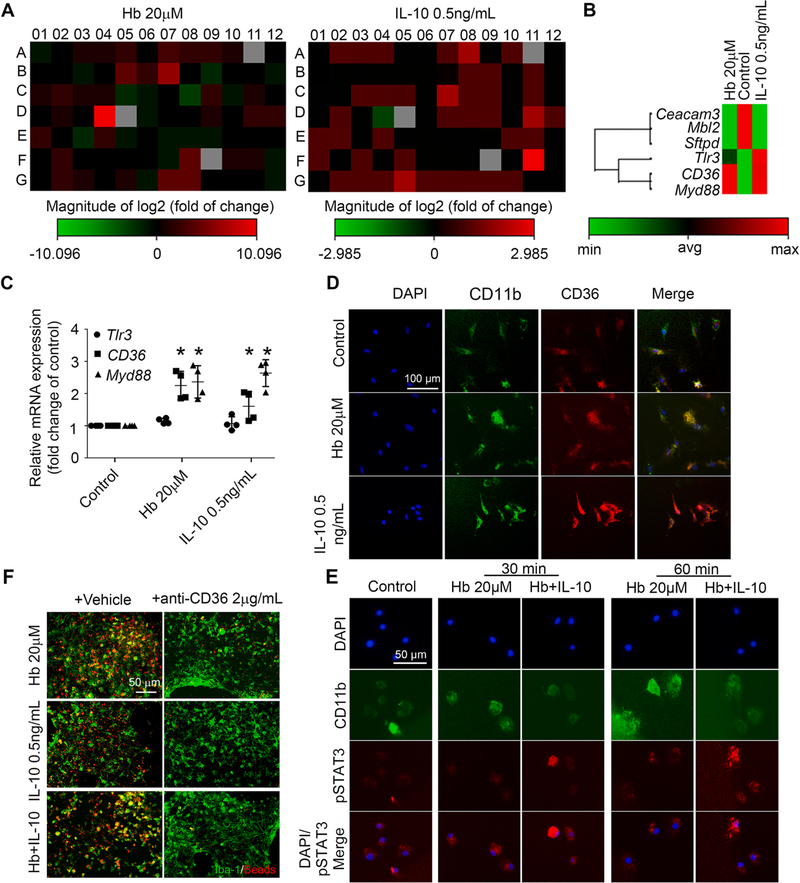
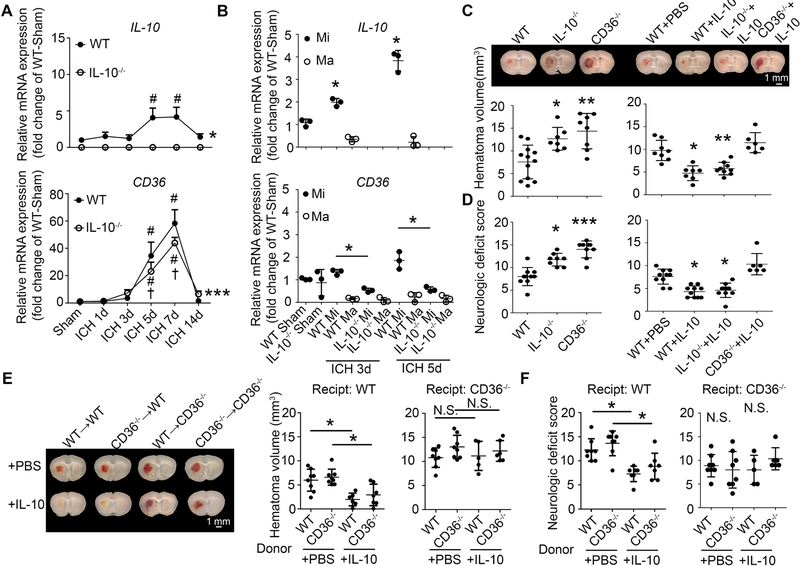
Hematoma size after intracerebral hemorrhage (ICH) significantly affects patient outcome. However, our knowledge of endogenous mechanisms that underlie hematoma clearance and the potential role of the anti-inflammatory cytokine interleukin-10 (IL-10) is limited. Using organotypic hippocampal slice cultures and a collagenase-induced ICH mouse model, we investigated the role of microglial IL-10 in phagocytosis ex vivo and hematoma clearance in vivo. In slice culture, exposure to hemoglobin induced IL-10 expression in microglia and enhanced phagocytosis that depended on IL-10-regulated expression of CD36. Following ICH, IL-10-deficient mice had more severe neuroinflammation, brain edema, iron deposition, and neurologic deficits associated with delayed hematoma clearance. Intranasal administration of recombinant IL-10 accelerated hematoma clearance and improved neurologic function. Additionally, IL-10-deficient mice had weakened in vivo phagocytic ability owing to decreased expression of microglial CD36. Moreover, loss of IL-10 significantly increased monocyte-derived macrophage infiltration and enhanced brain inflammation in vivo. These results indicate that IL-10 regulates microglial phagocytosis and monocyte-derived macrophage infiltration after ICH and that CD36 is a key phagocytosis effector regulated by IL-10. Leveraging the innate immune response to ICH by augmenting IL-10 signaling may provide a useful strategy for accelerating hematoma clearance and improving neurologic outcome in clinical translation studies.

Keywords: Hematoma clearance; IL-10; Intracerebral hemorrhage; Macrophage; Microglia.


Conflict of interest statement

Declaration of Competing Interest

The authors declare that they have no known competing financial interests or personal relationships that could have appeared to influence the work reported in this paper.

Figures

Fig. 1.
Fig. 1.
Hemoglobin (Hb) induces overexpression of both proinflammatory and anti-inflammatory microglial markers in OHSCs. OHSCs prepared from CX3CR1GFP/+ pups were treated with 20 μM Hb or vehicle for 16 h. (A, C) mRNA was extracted from the OHSCs, and real-time RT-PCR was performed. *p < 0.05, **p < 0.01, ***p < 0.001 vs. Control. n = 4. (B, D) Slices were fixed and immunostained with CD11b or Arg1 antibodies. Insets are high-power images showing colocalization of CX3CR1+/CD11b+ or CX3CR1+/Arg1+ cells. (E) Culture medium was collected and concentrated for use in a cytokine/chemokine array assay. Quantification of mean pixel density is shown; n = 1. (F) Culture medium was collected and concentrated for use in an ELISA. *p < 0.05, **p < 0.01 vs. Control; N.S., not significant. n = 3–4. (G) OHSCs were incubated with fluorescence-conjugated latex beads (4-μm diameter) for 4 h and fixed before imaging. Representative images from the CA1 region and quantification of bead+/GFP+ cells are shown. Insets are high-power images showing microglia with engulfed beads. **p < 0.01 vs. Control. n = 4–5. A, C: One-way ANOVA followed by Dunn’s multiple comparison post-hoc test; F, G: Student’s t-test followed by Welch’s correction. All results (except E) are from at least three independent experiments. Scale bars: (B), (D) and (G) 100 μm.
Fig. 2.
Fig. 2.
Hemoglobin (Hb) induces microglial phagocytosis by regulating IL-10 in OHSCs. OHSCs prepared from CX3CR1GFP/+ (A-F) or C57BL/6 (G) pups were treated as indicated for 16 h. (A) mRNA was extracted from the OHSCs, and real-time RT-PCR was carried out with IL-10 primers. *p < 0.05 vs. Control. n = 4. (B) Slices were fixed and immunostained with IL-10 antibodies. (C) OHSCs were collected and homogenized for Western blotting. β-actin served as a loading control. (D-F) OHSCs were incubated with fluorescence-conjugated latex beads (0.02-μm diameter) for 4 h and fixed before imaging. Representative images from the CA1 region (D) and quantification of bead+/GFP+ cells (E) are shown. Insets are high-power images showing microglia with engulfed beads. Tissue from another experimental group was collected and lysed to detect fluorescence intensity on a plate reader (F). *p < 0.05, **p < 0.01 vs. Control; #p < 0.05, ###p < 0.001 vs. Hb; †p < 0.05, ††p < 0.01 vs. IL-10. n = 3–6. (G) OHSCs were incubated for 4 h with aged RBCs prepared from GFP-UBC mice, fixed, and immunostained with Iba-1 antibodies. Representative images from the CA1 region are shown. Insets are high-power images showing colocalization of GFP-RBCs and microglia. A: Student’s t-test followed by Welch’s correction; E, F: One-way ANOVA followed by Dunn’s multiple comparison post-hoc test. Results are from at least three independent experiments. Scale bars: (B) 50 μm; (D) and (G) 100 μm.
Fig. 3.
Fig. 3.
Hemoglobin (Hb) upregulates microglial IL-10 in OHSCs. (A) OHSCs prepared from C57BL/6 pups were treated as indicated for 16 h. Slices were fixed and immunostained with IL-10 and NeuN or GFAP antibodies. Nuclei were stained with DAPI. Representative images from the CA1 region are shown. Insets are high-power images showing colocalization of IL-10+/NeuN+ cells but not colocalization of IL-10+ and GFAP+ cells. (B) Quantifications of percentage of IL-10+ microglia/neurons/astrocytes in Hb-treated OHSCs are shown. n = 5–7. (C) Mouse primary microglia were treated as indicated for 16 h, fixed, and immunostained with IL-10 antibodies. Nuclei were stained with DAPI. (D-G) OHSCs prepared from CX3CR1GFP/+ pups were treated with control-liposome (Control) (Pichler et al., 2013) or clodronate-liposome (Cl-Liposome) for 14 days. DIV, days in vitro. (D) Representative images from the slices and mean fluorescence intensity are shown. ***p < 0.001 vs. Control. n = 8. (E) Slices were collected and homogenized for Western blotting. β-actin served as a loading control. (F, G) OHSCs were treated with control-liposome (Pichler et al., 2013) or Cl-Liposome for 14 days and further incubated with either Hb or vehicle for 16 h. (F) Culture medium was collected and concentrated for use in an ELISA. ***p < 0.001 vs. Control. n = 3. (G) mRNA was extracted from the OHSCs, and real-time RT-PCR was carried out with IL-10 primers. GAPDH was used as an internal control. ***p < 0.001 vs. Control. n = 3. D: Student’s t-test followed by Welch’s correction; F, G: One-way ANOVA followed by Dunn’s multiple comparison post-hoc test. Results are from at least three independent experiments. Scale bars: (A) and right panels for (D) 50 μm; (C) 20 μm; left panels for (D) 1 mm.
Fig. 4.
Fig. 4.. IL-10 deficiency aggravates acute ICH outcomes and delays hematoma clearance in vivo.
(A-G) Male C57BL/6 (WT) or IL-10−/− mice underwent collagenase injection or sham procedure. (A) Neurologic deficit score, right front paw placement, and hind limb placing scores preference tested at day 5. *p < 0.05, **p < 0.01, ***p < 0.001 vs. WT. n = 7–9. (B) Ipsilateral (Ipsi.) and contralateral (Contra.) regional water content measured at day 5. Cerebellum served as an internal control. ***p < 0.001 vs. WT Ipsi. striatum. n = 4. (C) ELISA-based cytokine measurements from homogenates of 4-mm slices from hematoma core and perihematoma region at 3-day post-surgery. *p < 0.05 vs. corresponding WT Sham; #p < 0.05 vs. WT ICH 3d, †p < 0.05 vs. IL-10−/− Sham. n = 3–4. (D) Mice were sacrificed at day 5 post-ICH and brain sections were stained with Fluoro-Jade C (FJC). Representative images from perihematomal region and quantification of FJC+ cells are shown. *p < 0.05 vs. WT. n = 4–5. (E) Representative images from fresh coronal sections harvested at day 5 and quantified hematoma volume. **p < 0.01 vs. WT. n = 7–9. (F, G) Hemoglobin content measured at hour 6, hour 24 (G) and day 5 (F) post-ICH in injured hemisphere after PBS perfusion. *p < 0.05 vs. WT. n = 5. (H, I) Male WT or IL-10−/− mice (8–10 weeks old) underwent injection with 8 μL of autologous whole arterial blood. (H) Mice were sacrificed at day 3 post-ICH. Left: Representative images of fresh brain coronal sections; Right: Quantification of hematoma volume. *p < 0.05 vs. WT. n = 5. (I) Mice were perfused with PBS at 6 h or 3 days post-ICH. Tissue from the injured hemisphere was homogenized for measuring hemoglobin content. N.S., not significant; *p < 0.05 vs. corresponding WT. n = 6. Results are presented as scatter plots (mean ± SD). A, D, E, F, H: Student’s t-test followed by Welch’s correction. B, G, I: Two-way ANOVA followed by Bonferroni post-hoc test. C: One-way ANOVA followed by Dunn’s multiple comparison post-hoc test. Results are from at least three independent experiments. Scale bars: (D) 50 μm; (E) and (H) 1 mm.
Fig. 5.
Fig. 5.. IL-10 deficiency decreases engulfing red blood cells (RBCs) phagocytes after ICH in vivo.
(A, B) Male C57BL/6 (WT) or IL-10−/− mice (8–10 weeks old) were injected with aged RBCs. Brain slices obtained at day 5 were stained with Iba-1 (A) or P2y12 (B) antibodies. Representative images from the perihematomal region and the percentage of Iba-1+/GFP+ and P2y12+/GFP+ cells are shown. *p < 0.05 vs. WT. n = 4–9. (C-E) WT, IL-10−/−, or WT that were administered IL-10 (WT + IL-10) mice were injected with aged RBCs. Mouse brain was perfused with PBS and dissociated into single cells. Cells were stained with different antibodies for flow cytometry. (C) Representative flow plot shows the CD11b+ GFP+ population after gating the PI cells (population inside the solid line). Graphs show the percentage of GFP+CD11b+ cells (D) and percentage of phagocytes with engulfed RBCs (E). D: *p < 0.05, **p < 0.01 from corresponding WT group. n = 3–6. Results are presented as scatter plots (mean ± SD). A, B: Student’s t-test followed by Welch’s correction. D: One-way ANOVA followed by Dunn’s multiple comparison post-hoc test E: Two-way ANOVA followed by Bonferroni post-hoc tests. Results are from at least three independent experiments. Scale bars: (A) and (B) left panels 50 μm; (A) and (B) right panels 10 μm. MMФ: microglia and macrophages; M/MФ: microglia/macrophages. (For interpretation of the references to colour in this figure legend, the reader is referred to the web version of this article.)
Fig. 6.
Fig. 6.. IL-10 deficiency increases monocyte-derived macrophage infiltration and changes its surface marker expression in vivo.
Male C57BL/6 (WT) and IL-10−/− mice underwent collagenase injection or sham procedure. Brains were perfused with PBS and dissociated into single cells that were stained with antibodies for flow cytometry. (A) Representative flow plots show the CD11b+CD45+ population after gating the PI cells (population inside the solid line). Ma, macrophage; Mi, microglia. (B) Percentages of CD11b+ cells. *p < 0.05 vs. corresponding Sham; N.S., not significant; n = 3–4. (C) Percentages of CD45highCD11b+/CD11b+ cells (macrophage) and CD45intCD11b+/CD11b+ cells (microglia). *p < 0.05, **p < 0.01 vs. corresponding WT group; n = 3–4. (D-I) Cells were stained with different antibodies for flow cytometry. The absolute cell counts of CD86+CD11b+ (E) and CD206+CD11b+ (G) were quantified based on the total events. The percentages of CD86+CD11b+ (D, H) and CD206+CD11b+ (F, I) cells were quantified. Representative flow plots show CD45+CD86+ (D) and CD45+CD206+ (F) populations after gating the CD11b+PI cells. (E, G): *p < 0.05 vs. corresponding Sham; N.S., not significant. (H, I): *p < 0.05 vs. corresponding WT. n = 3–4. Results are presented as scatter plots (mean ± SD). B, E, G: One-way ANOVA followed by Dunn’s multiple comparison post-hoc test; C, H, I: Two-way ANOVA followed by Bonferroni post-hoc tests. All results are from at least three independent experiments. M/MФ: microglia/macrophages.
Fig. 7.
Fig. 7.. IL-10 deficiency changes microglia and monocyte-derived macrophage activation status in vivo.
Male C57BL/6 (WT) and IL-10−/− mice (8–10 weeks old) underwent collagenase injection or sham procedure. (A-C) Mice were sacrificed at day 5 post-ICH. Brain slices were stained with different antibodies. DAPI indicates nuclei. (A) Yellow dash line indicates hematoma core, and the area between white dash line and yellow dash line indicates perihematoma area. Quantification of the numbers of Iba-1+ cells is shown. N.S., not significant; n = 7–9. (B, C) Representative images from the perihematomal region and quantification of the percentages/numbers iNOS+Iba-1+, CD206+Iba-1+, iNOS+Tmem119+, and CD206+Tmem119+ cells are shown. **p < 0.01, ***p < 0.001 vs. WT. n = 4. (D, E) Brains were perfused with PBS and dissociated into single cells that were stained with antibodies for flow cytometry. CD11b+ cells in sham mice and CD45highCD11b+ (macrophage) and CD45intCD11b+ (microglia) cells in ICH mice were sorted after gating the PI cells. mRNA was extracted from sorted cells, and real-time RT-PCR was carried out with different primers. *p < 0.05 vs. corresponding WT group. n = 3–5. Results are presented as scatter plots (mean ± SD). A-C: Student’s t-test followed by Welch’s correction. D, E: Two-way ANOVA followed by Bonferroni post-hoc tests. All results are from at least three independent experiments. Scale bars: (B) and (C) left panels 100 μm for Iba-1 staining and 50 μm for Tmem119 staining; (B) and (C) right panels 10 μm for Iba-1 staining and 25 μm for Tmem119 staining. (For interpretation of the references to colour in this figure legend, the reader is referred to the web version of this article.)
Fig. 8.
Fig. 8.. IL-10 deficiency upregulates macrophage-infiltration–related cytokines in vivo and enhances macrophage phagocytosis in vitro.
(A-C) Male C57BL/6 (WT) and IL-10−/− mice (8–10 weeks old) underwent collagenase injection or sham procedure. Four-millimeter tissue slices were collected from the hematoma core and perihematomal region of 3 day post-ICH and sham animals. Tissue was homogenized for cytokine/chemokine array. (A) Representative images and quantification of mean pixel density are shown. n = 1. (B) Functions of proteins identified by cytokine/chemokine assay are listed in table. (C) mRNA was extracted at 1 day after ICH, and real-time RT-PCR was carried out with different primers. *p < 0.05 vs. corresponding WT or Sham group; N.S., not significant. n = 4. (D-F) Bone marrow-derived macrophages from C57BL/6 mice were cultured. Cells were treated as indicated for 48 h. Migration of macrophages was assessed by Transwell assay in Transwell chambers plated with hemoglobin (Hb)-treated astrocytes (D) or medium containing 10% FBS (E). Representative images are shown and number of migrating macrophages was quantified. *p < 0.05, **p < 0.01 vs. control. n = 3–6. (F) Cells were incubated with fluorescence conjugated latex beads (4 μm in diameter) for 4 h. Fluorescence intensity was measured every 30 min in a plate reader. Fluorescence intensity from beads engulfed by macrophages was quantified. Another set of cells was incubated with beads for 4 h, fixed, and immunostained with F4/80. Representative images are shown. **p < 0.01, ***p < 0.001 vs. control; #p < 0.05 vs. IFN-γ. Results are presented as bar graph, line chart (mean ± SD), or scatter plots (mean ± SD). C: One-way ANOVA followed by Dunn’s multiple comparison post-hoc test. D, E: Student’s t-test followed by Welch’s correction. F: Repeated measurement followed by Tukey’s multiple comparison. Results are from at least three independent experiments except for A. Scale bars: (D) 100 μm; (F) 50 μm.
Fig. 9.
Fig. 9.. IL-10 and CD36 are required for microglial phagocytosis activity in vitro.
(A, B) OHSCs prepared from C57BL/6 pups were treated as indicated for 16 h, mRNA was extracted, and real-time RT-PCR was carried out with a phagocytosis PCR array. (A) Heat map of gene changes compared with control group. (B) Hemoglobin (Hb)- and IL-10–co-regulated gene sets. (C, D) Mouse primary microglia were treated as indicated for 16 h. (C) mRNA was extracted from the mouse primary microglia, and real-time RT-PCR was carried out with different primers. *p < 0.05 vs. corresponding Control; n = 3–4. (D) Cells were fixed and immunostained with CD11b and CD36 antibodies. Nuclei were stained with DAPI. Representative images are shown. (E) Mouse primary microglia were treated as indicated. Cells were fixed and immunostained with CD11b and pSTAT3 antibodies. Nuclei were stained with DAPI. Representative images are shown. (F) OHSCs were treated as indicated for 16 h and then incubated with fluorescence-conjugated latex beads (4-μm diameter) for 4 h, fixed, and immunostained with Iba-1 antibodies. Representative images are shown. C: One-way ANOVA followed by Dunn’s multiple comparison post-hoc test. All results are from at least three independent experiments except for A and B. Scale bars: (D) 100 μm; (E) and (F) 50 μm.
Fig. 10.
Fig. 10.. IL-10−/− mice exhibit delayed hematoma clearance due to decreased microglial CD36 expression.
(A, B) Male C57BL/6 (WT) and IL-10−/− mice underwent collagenase injection or sham procedure. Brains were perfused with PBS, and 4-millimeter tissue slices were collected from the hematoma core and perihematoma region of injured and sham animals. (A) Tissues were homogenized, mRNA was extracted, and real-time RT-PCR was performed. *p < 0.05, ***p < 0.001 vs. WT; #p < 0.05 vs. corresponding Sham; †p < 0.05 vs. corresponding WT; n = 3–4. (B) Tissue was dissociated into single cells that were stained with antibodies for flow cytometry. CD11b+ cells in sham animals and CD45highCD11b+ cells (macrophage) and CD45intCD11b+ cells (microglia) in injured animals were sorted after gating the PI cells. mRNA was extracted from sorted cells, and real-time RT-PCR was performed and normalized by the WT sham microglia expression for each run. *p < 0.05 vs. Sham (upper panel), or *p < 0.05 vs. corresponding WT group (lower panel). n = 3. (C, D) At 2 h after collagenase injection, male WT, IL-10−/−, and CD36−/− mice received recombinant IL-10 protein or PBS via intranasal administration. (C) Hematoma volume was measured on fresh brain coronal sections and representative images are shown. *p < 0.05, **p < 0.01 vs. WT or WT + PBS. n = 6–12. (D) Neurologic deficit score was assessed at day 5. *p < 0.05, ***p < 0.001 vs. WT or WT + PBS. n = 6–10. (E, F) WT and CD36−/− mice received transplanted bone marrow as indicated. After recovery, mice underwent collagenase injection followed 2 h later by intranasal administration of recombinant IL-10 protein or PBS. (E) Hematoma volume was measured on fresh brain coronal sections, and representative images are shown. *p < 0.05 vs. WT + PBS; N.S., not significant. n = 5–8. (F) Neurologic deficit score was assessed at day 5. *p < 0.05 vs. WT or WT + PBS. n = 6–10. A: Two-way ANOVA followed by Bonferroni post-hoc test; B-F: One-way ANOVA followed by Dunn’s multiple comparison post-hoc test; Results are from at least three independent experiments. Scale bars: (C) and (E) 1 mm.

References

    1. Awad IA, Polster SP, Carrion-Penagos J, Thompson RE, Cao Y, Stadnik A, Money PL, Fam MD, Koskimaki J, Girard R, Lane K, McBee N, Ziai W, Hao Y, Dodd R, Carlson AP, Camarata PJ, Caron JL, Harrigan MR, Gregson BA, Mendelow AD, Zuccarello M, Hanley DF and M. I. T. Investigators (2019). Surgical Performance Determines Functional Outcome Benefit in the Minimally Invasive Surgery Plus Recombinant Tissue Plasminogen Activator for Intracerebral Hemorrhage Evacuation (MISTIE) Procedure. Neurosurgery 84(6): 1157–1168. - PMC - PubMed
    1. Bian Z, Shi L, Guo YL, Lv Z, Tang C, Niu S, Tremblay A, Venkataramani M, Culpepper C, Li L, Zhou Z, Mansour A, Zhang Y, Gewirtz A, Kidder K, Zen K, Liu Y, 2016. Cd47-Sirpalpha interaction and IL-10 constrain inflammation-induced macrophage phagocytosis of healthy self-cells. Proc. Natl. Acad. Sci. U.S.A 113 (37), E5434–E5443. - PMC - PubMed
    1. Braun DA, Fribourg M, Sealfon SC, 2013. Cytokine response is determined by duration of receptor and signal transducers and activators of transcription 3 (STAT3) activation. J. Biol. Chem 288 (5), 2986–2993. - PMC - PubMed
    1. Chang C-F, Cai L.i., Wang J, 2015. Translational intracerebral hemorrhage: a need for transparent descriptions of fresh tissue sampling and preclinical model quality. Transl Stroke Res. 6 (5), 384–389. - PMC - PubMed
    1. Chang CF, Wan J, Li Q, Renfroe SC, Heller NM, Wang J, 2017. Alternative activation-skewed microglia/macrophages promote hematoma resolution in experimental intracerebral hemorrhage. Neurobiol. Dis 103, 54–69. - PMC - PubMed

Publication types

LinkOut - more resources