. 2021 Apr:234:110195.
doi: 10.1016/j.vetimm.2021.110195. Epub 2021 Feb 4.

Differential gene expression and Ingenuity Pathway Analysis of bronchoalveolar lavage cells from horses with mild/moderate neutrophilic or mastocytic inflammation on BAL cytology

Affiliations

Differential gene expression and Ingenuity Pathway Analysis of bronchoalveolar lavage cells from horses with mild/moderate neutrophilic or mastocytic inflammation on BAL cytology

Kaori Uchiumi Davis et al. Vet Immunol Immunopathol. 2021 Apr.

Abstract

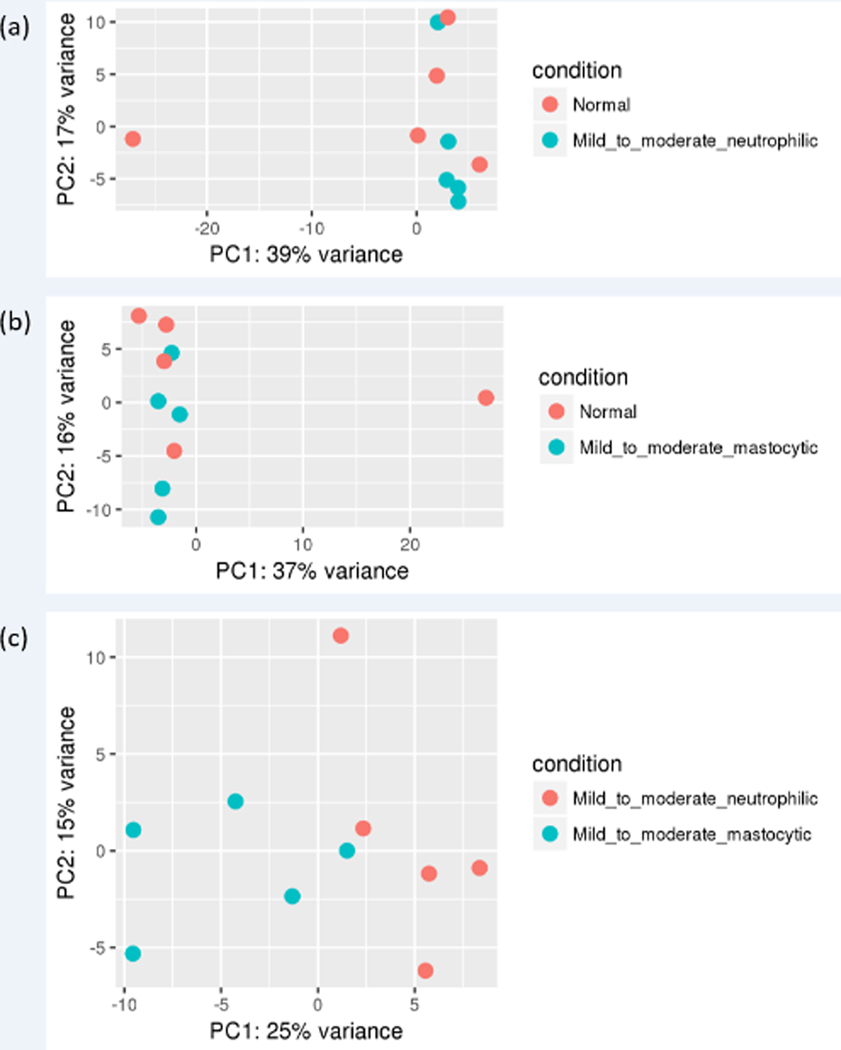
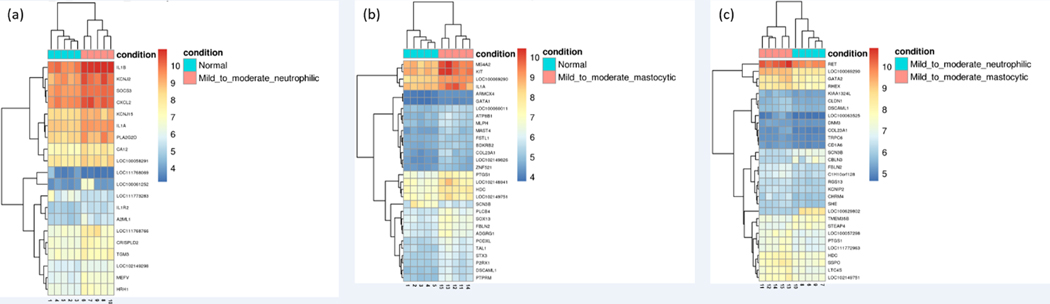
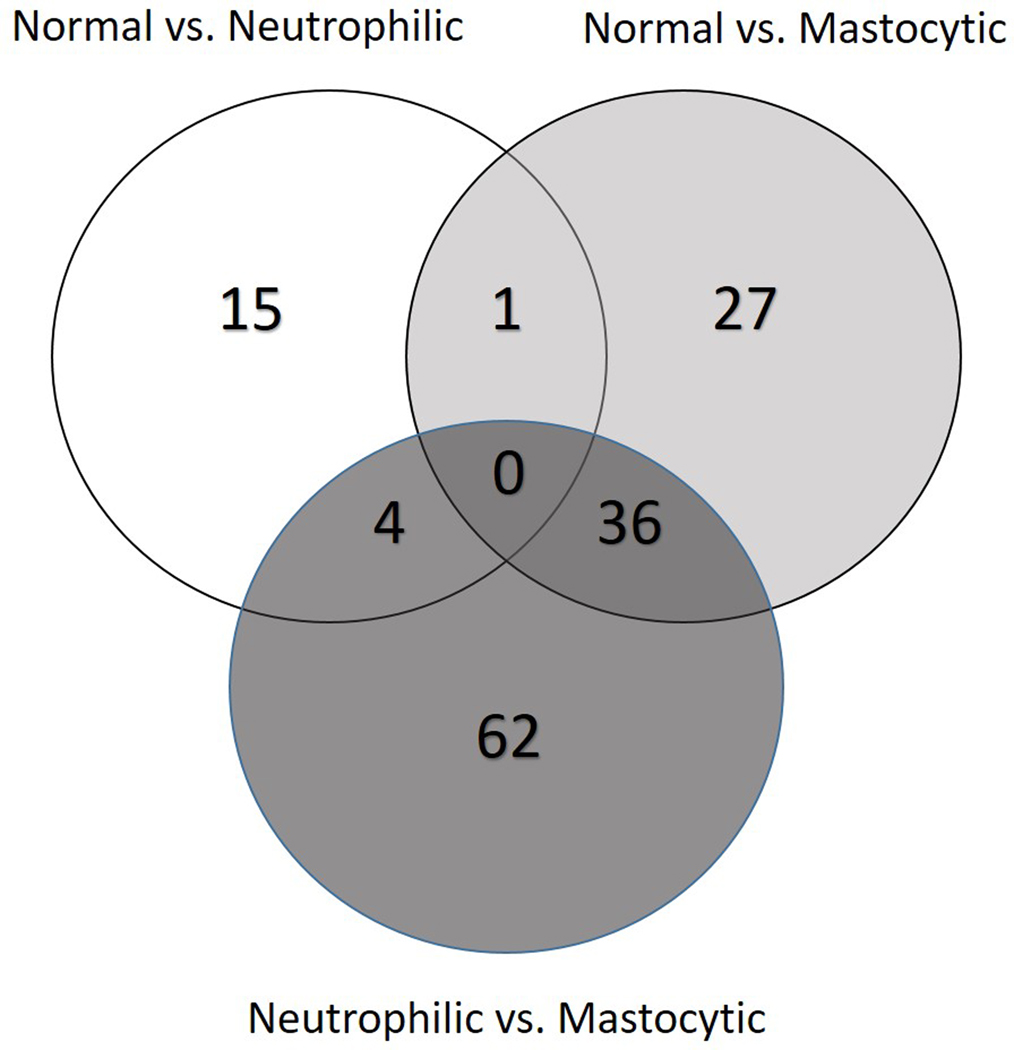
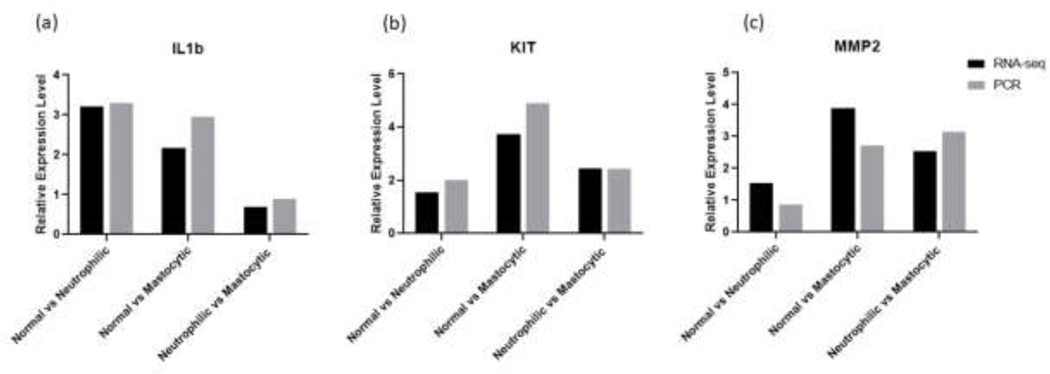
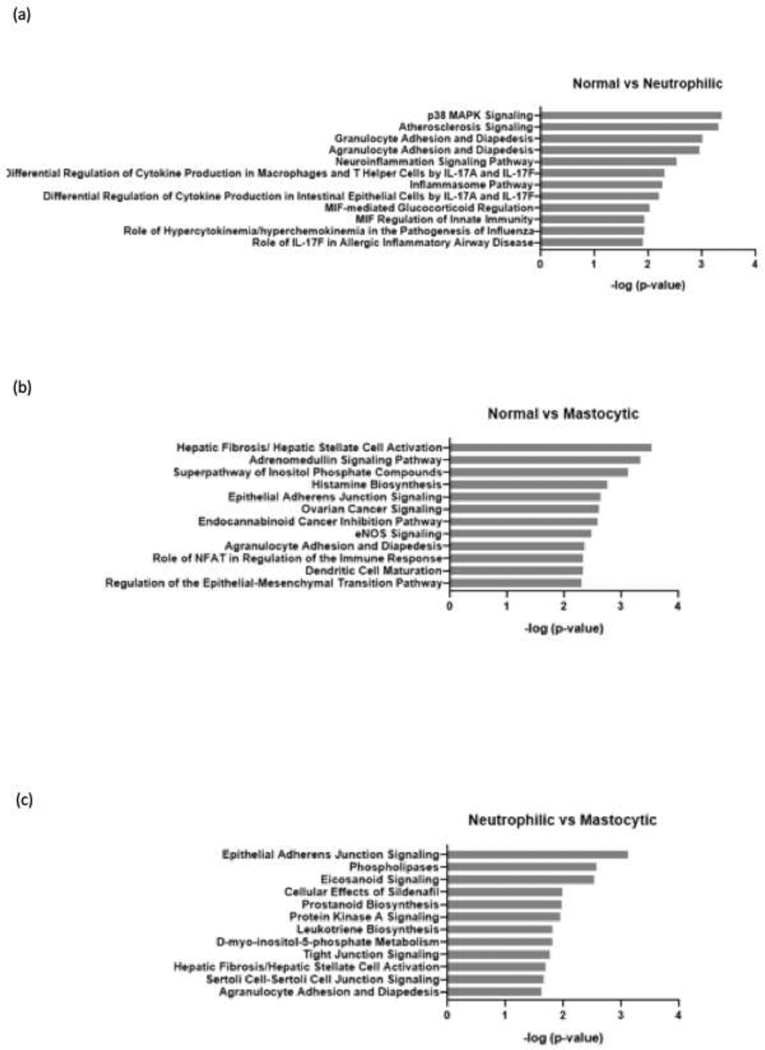
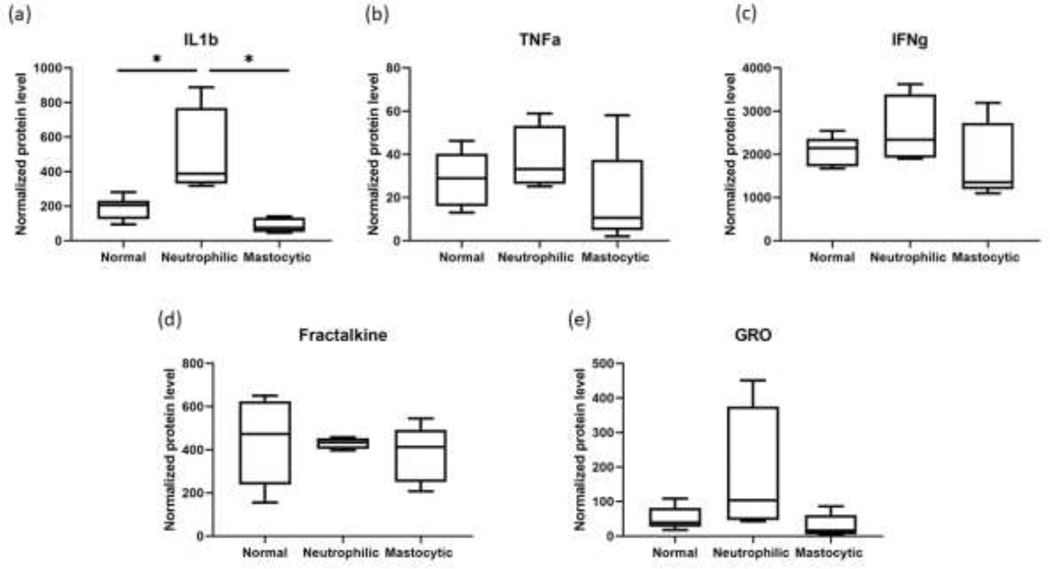
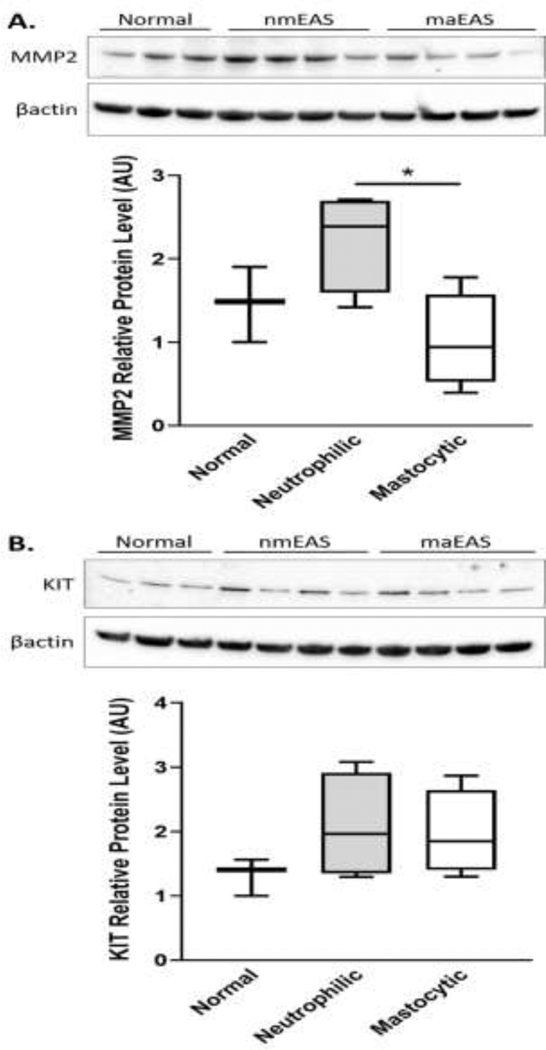
Mild to moderate equine asthma syndrome (mEAS) affects horses of all ages and breeds. To date, the etiology and pathophysiology of mEAS are active areas of research, and it remains incompletely understood whether mEAS horses with different immune cell 'signatures' on BAL cytology represent different phenotypes, distinct pathobiological mechanisms (endotypes), varied environmental conditions, disease severity, genetic predispositions, or all of the above. In this descriptive study, we compared gene expression data from BAL cells isolated from horses with normal BALF cytology (n = 5), to those isolated from horses with mild/moderate neutrophilic inflammation (n = 5), or mild/moderate mastocytic inflammation (n = 5). BAL cell protein lysates were analyzed for cytokine/chemokine levels using Multiplex Bead Immunoassay, and for select proteins using immunoblot. The transcriptome, determined by RNA-seq and analyzed with DEseq2, contained 20, 63, and 102 significantly differentially expressed genes in horses with normal vs. neutrophilic, normal vs. mastocytic, and neutrophilic vs. mastocytic BALF cytology, respectively. Pathway analyses revealed that BAL-isolated cells from horses with neutrophilic vs. normal cytology showed enrichment in inflammation pathways, and horses with mastocytic vs. normal cytology showed enrichment in pathways involved in fibrosis and allergic reaction. BAL cells from horses with mastocytic mEAS, compared to neutrophilic mEAS, showed enrichment in pathways involved in alteration of tissue structures. Cytokine analysis determined that IL-1β was significantly different in the lysates from horses with neutrophilic inflammation compared to those with normal or mastocytic BAL cytology. Immunoblot revealed significant difference in the relative level of MMP2 in horses with neutrophilic vs. mastocytic mEAS. Upregulation of mRNA transcripts involved in the IL-1 family cytokine signaling axis (IL1a, IL1b, and IL1R2) in neutrophilic mEAS, as well as KIT mRNA in mastocytic mEAS, are novel, potentially clinically relevant, findings of this study. These findings further inform our understanding of inflammatory cell subtypes in mEAS.

Keywords: Asthma phenotype; BAL; Equine asthma syndrome; Gene expression; Heaves; Inflammatory airway disease; RNA-seq; Recurrent airway obstruction.


Conflict of interest statement

Conflict of interest

The authors have no conflict of interest.

Figures

Figure 1.
Figure 1.
Principal component analysis plots of RNA-seq data from BAL cells isolated from horses with normal vs. neutrophilic (a), normal vs. mastocytic (b), and neutrophilic vs. mastocytic (c), BAL cytology. These plots show the characteristics of samples according to gene expression (FPKM) levels. FPKM, fragments per kilobase of transcript per million mapped reads.
Figure 2.
Figure 2.
Bi-clustering heat map of top statistically significant differentially expressed genes between normal vs. neutrophilic (a), normal vs. mastocytic (b), and neutrophilic vs. mastocytic (c). Color intensity was normalized to log2 (fragments per kilobase of transcript per million mapped reads +1), with red colors representing more highly expressed genes and blue colors representing less highly expressed genes. Hierarchial clustering is based on the Manhattan distance among samples and is intended to highlight relative differences in expression between groups.
Figure 3.
Figure 3.
Venn diagram of the three sets of differentially expressed genes between the three comparisons: ‘Normal vs. Neutrophilic’, ‘Normal vs. Mastocytic’, and ‘Neutrophilic vs. Mastocytic’. The three overlapping sets shared between two contrasts varied from 1 to 36 genes (Table 2, S4, S5).
Figure 4.
Figure 4.
Fold change of IL1b (a), KIT (b) and MMP2 (c) mRNA, determined via RNA-seq differential gene expression analysis (black bars, n=5 per group) and qRT-PCR (white bars, n=2 per group) performed on BAL cell RNA samples. For RNA-seq, Log2fold change was calculated as Log2 (Group 2 mean normalized counts/Group 1 mean normalized counts). For the qRT-PCR assays, relative quantification was calculated as dCT with equine succinate dehydrogenase complex, subunit A, flavoprotein (SDHA) used as an endogenous control, and ΔΔCT was used to calculate fold change.
Figure 5.
Figure 5.
Summary of pathway analysis for differentially expressed genes. The differentially expressed genes were compared between normal vs. neutrophilic phenotype (a), normal vs. masotytic phenotype (b), and neutrophilic vs. mastocytic phenotype (c). Functional annotation was performed using Ingenuity Pathway Analysis using predefined pathways and functional categories of the Ingenuity Knowledge Base. Fisher’s exact test was applied to identify significantly enriched differentially expressed genes as members of pathways and functional categories. Relevant gene regulatory networks were identified using the Ingenuity Knowledge Base.
Figure 6.
Figure 6.
IL-1β(a), TNFα(𝑏), IFNγ (c), Fractalkine (d) and GRO (e) levels in BAL cell lysates determined by Multiplex Bead Immunoassay. 6 normal horses, 4 mild/moderate neutrophilic horses and 4 mild/moderate mastocytic horses were sampled. Protein concentrations normalized to total protein concentrations were averaged and compared between groups shown on the x-axis.
Figure 7.
Figure 7.
MMP2 (a) and KIT (b) immunoblot results from horses with normal BALF cytology (n=3), neutrophilic inflammation (n=4), and mastocytic inflammation (n=4). Box-and-whisker plot (arbitrary units) for the relative protein levels of MMP2 and KIT in BAL cells, respectively. *p<0.05.

References

    1. Afonina IS, Müller C, Martin SJ, Beyaert R, 2015. Proteolytic Processing of Interleukin-1 Family Cytokines: Variations on a Common Theme. Immunity 42, 991–1004. - PubMed
    1. Al-Alwan LA, Chang Y, Mogas A, Halayko AJ, Baglole CJ, Martin JG, Rousseau S, Eidelman DH, Hamid Q, 2013. Differential roles of CXCL2 and CXCL3 and their receptors in regulating normal and asthmatic airway smooth muscle cell migration. J Immunol 191, 2731–2741. - PMC - PubMed
    1. Barton AK, Shety T, Bondzio A, Einspanier R, Gehlen H, 2015. Metalloproteinases and Their Tissue Inhibitors in Comparison between Different Chronic Pneumopathies in the Horse. Mediators Inflamm 2015, 569512. - PMC - PubMed
    1. Bedenice D, Mazan MR, Hoffman AM, 2008. Association between cough and cytology of bronchoalveolar lavage fluid and pulmonary function in horses diagnosed with inflammatory airway disease. J Vet Intern Med 22, 1022–1028. - PubMed
    1. Beekman L, Tohver T, Dardari R, Léguillette R, 2011. Evaluation of suitable reference genes for gene expression studies in bronchoalveolar lavage cells from horses with inflammatory airway disease. BMC Mol Biol 12, 5. - PMC - PubMed

MeSH terms

LinkOut - more resources