. 2021 Mar;591(7851):652-658.
doi: 10.1038/s41586-021-03326-4. Epub 2021 Feb 15.

CTLA-4 blockade drives loss of Treg stability in glycolysis-low tumours

Affiliations

CTLA-4 blockade drives loss of Treg stability in glycolysis-low tumours

Roberta Zappasodi et al. Nature. 2021 Mar.

Abstract

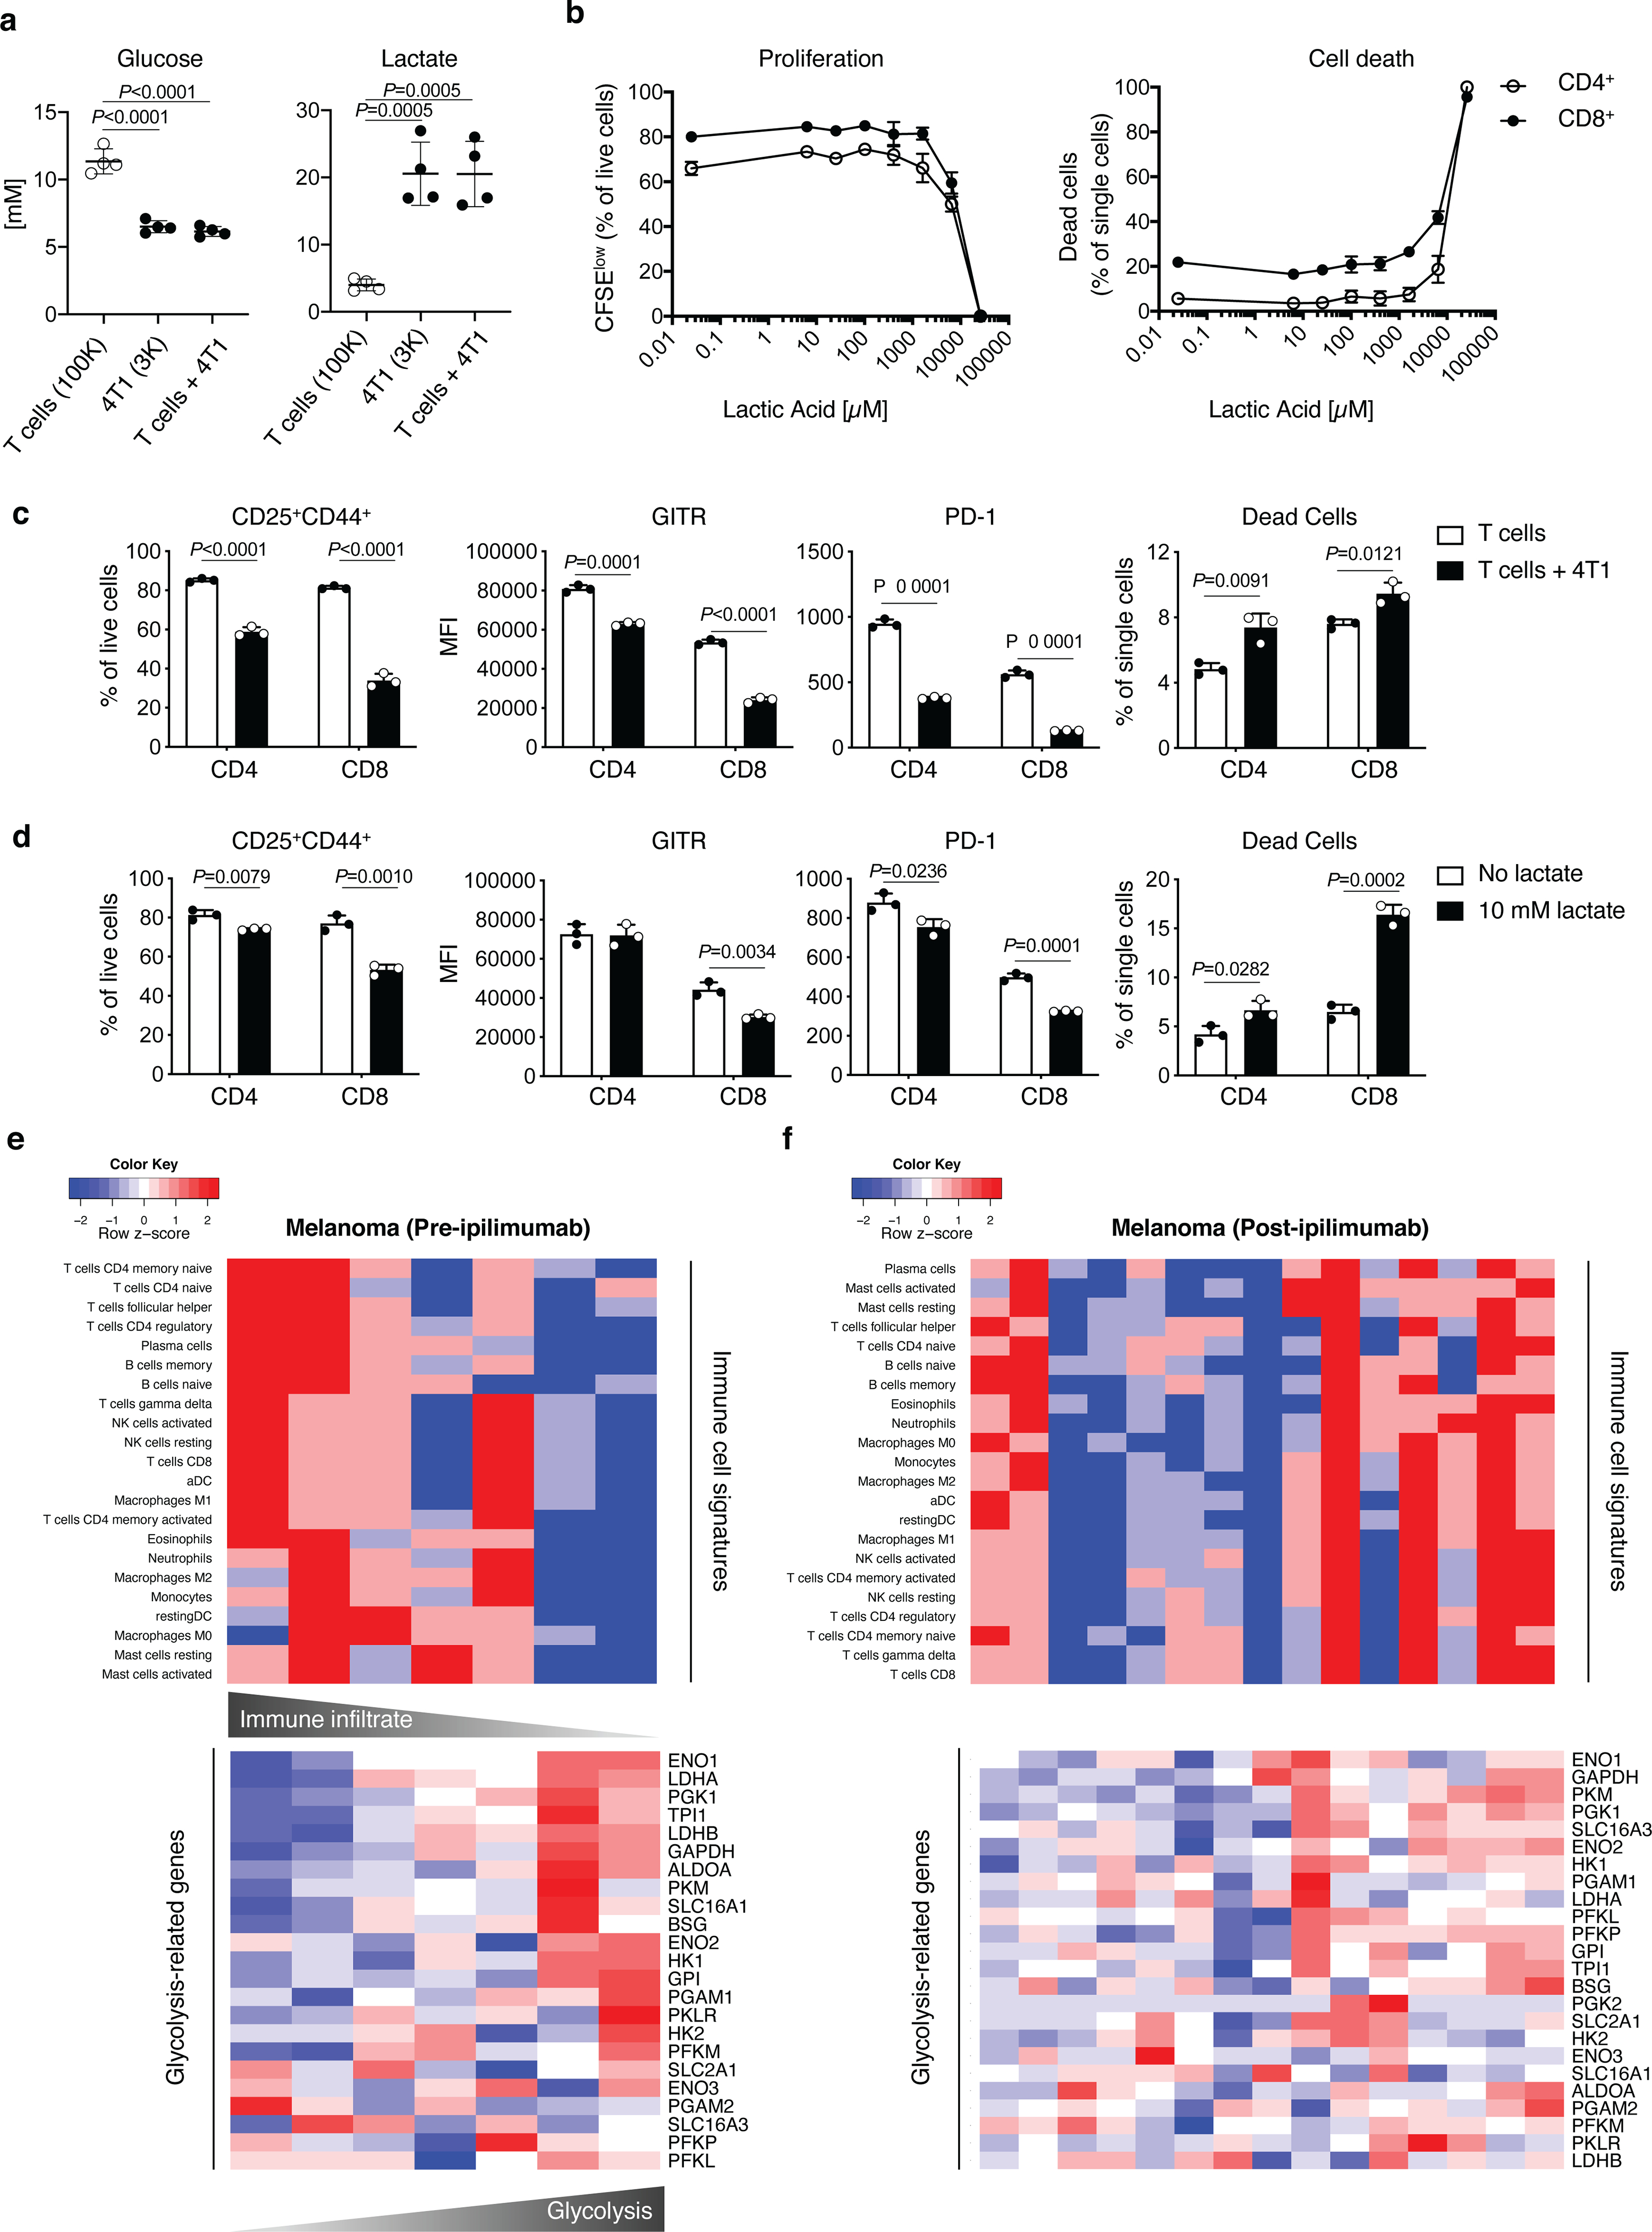
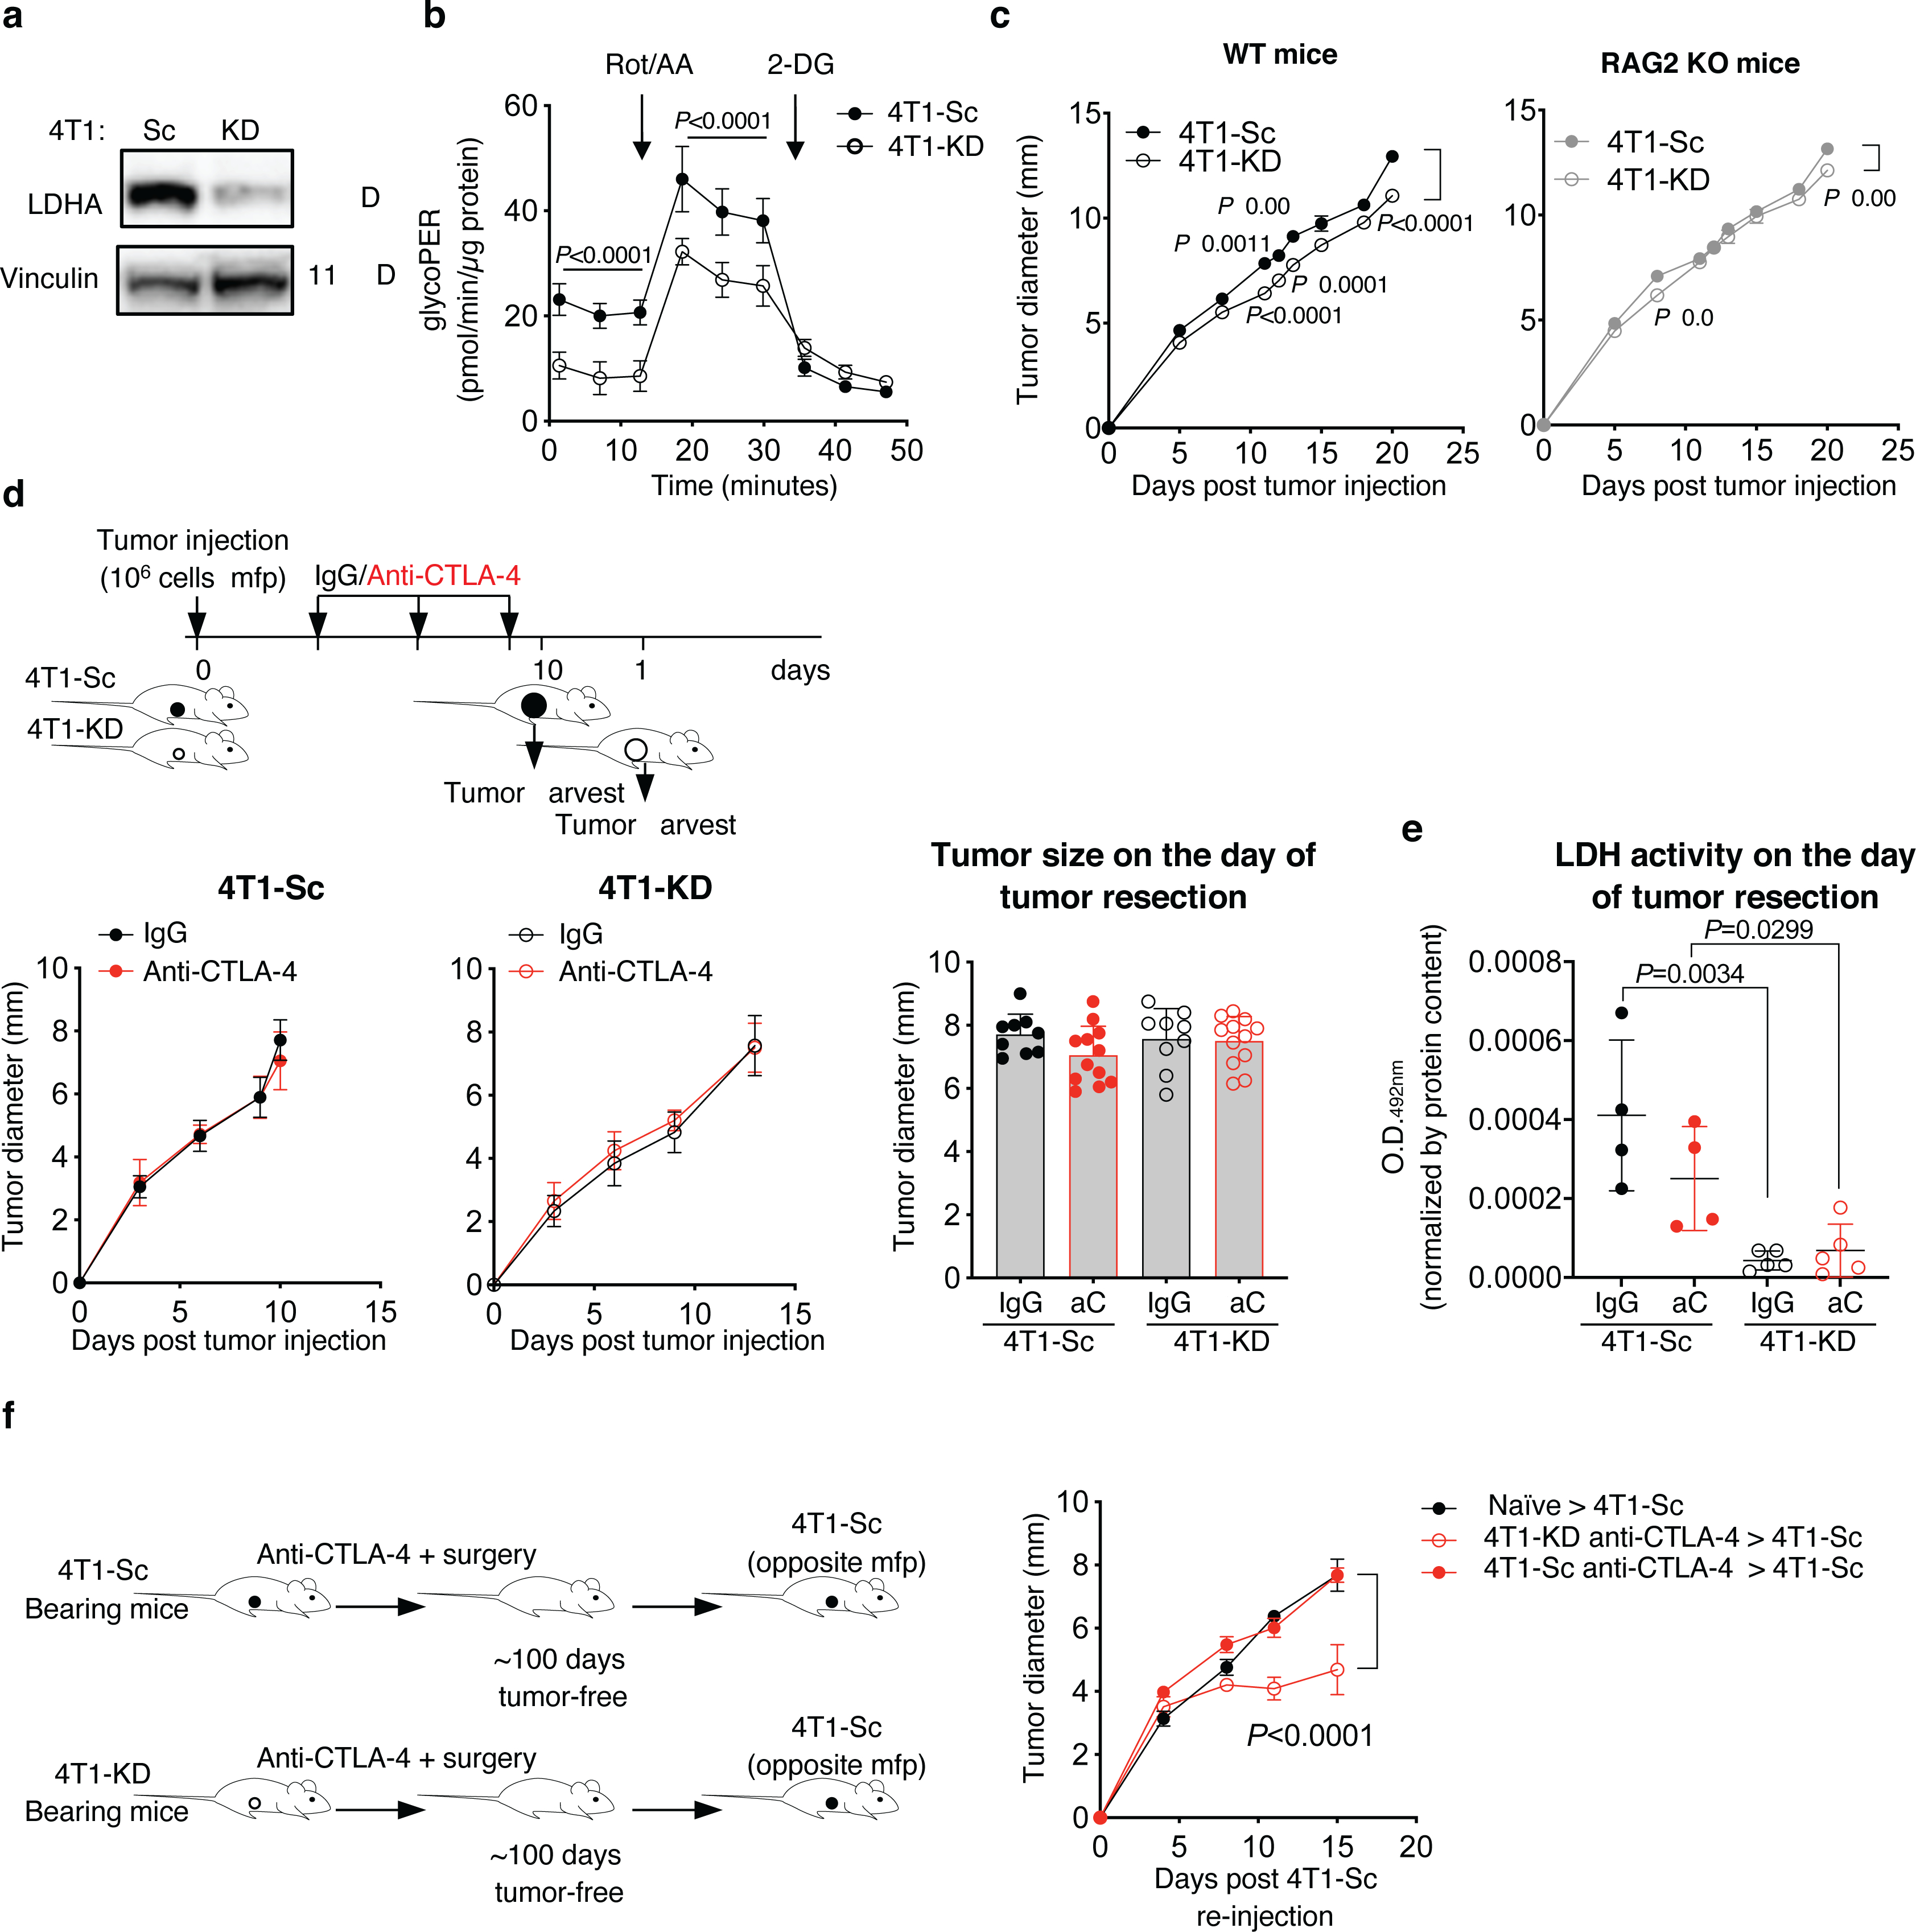
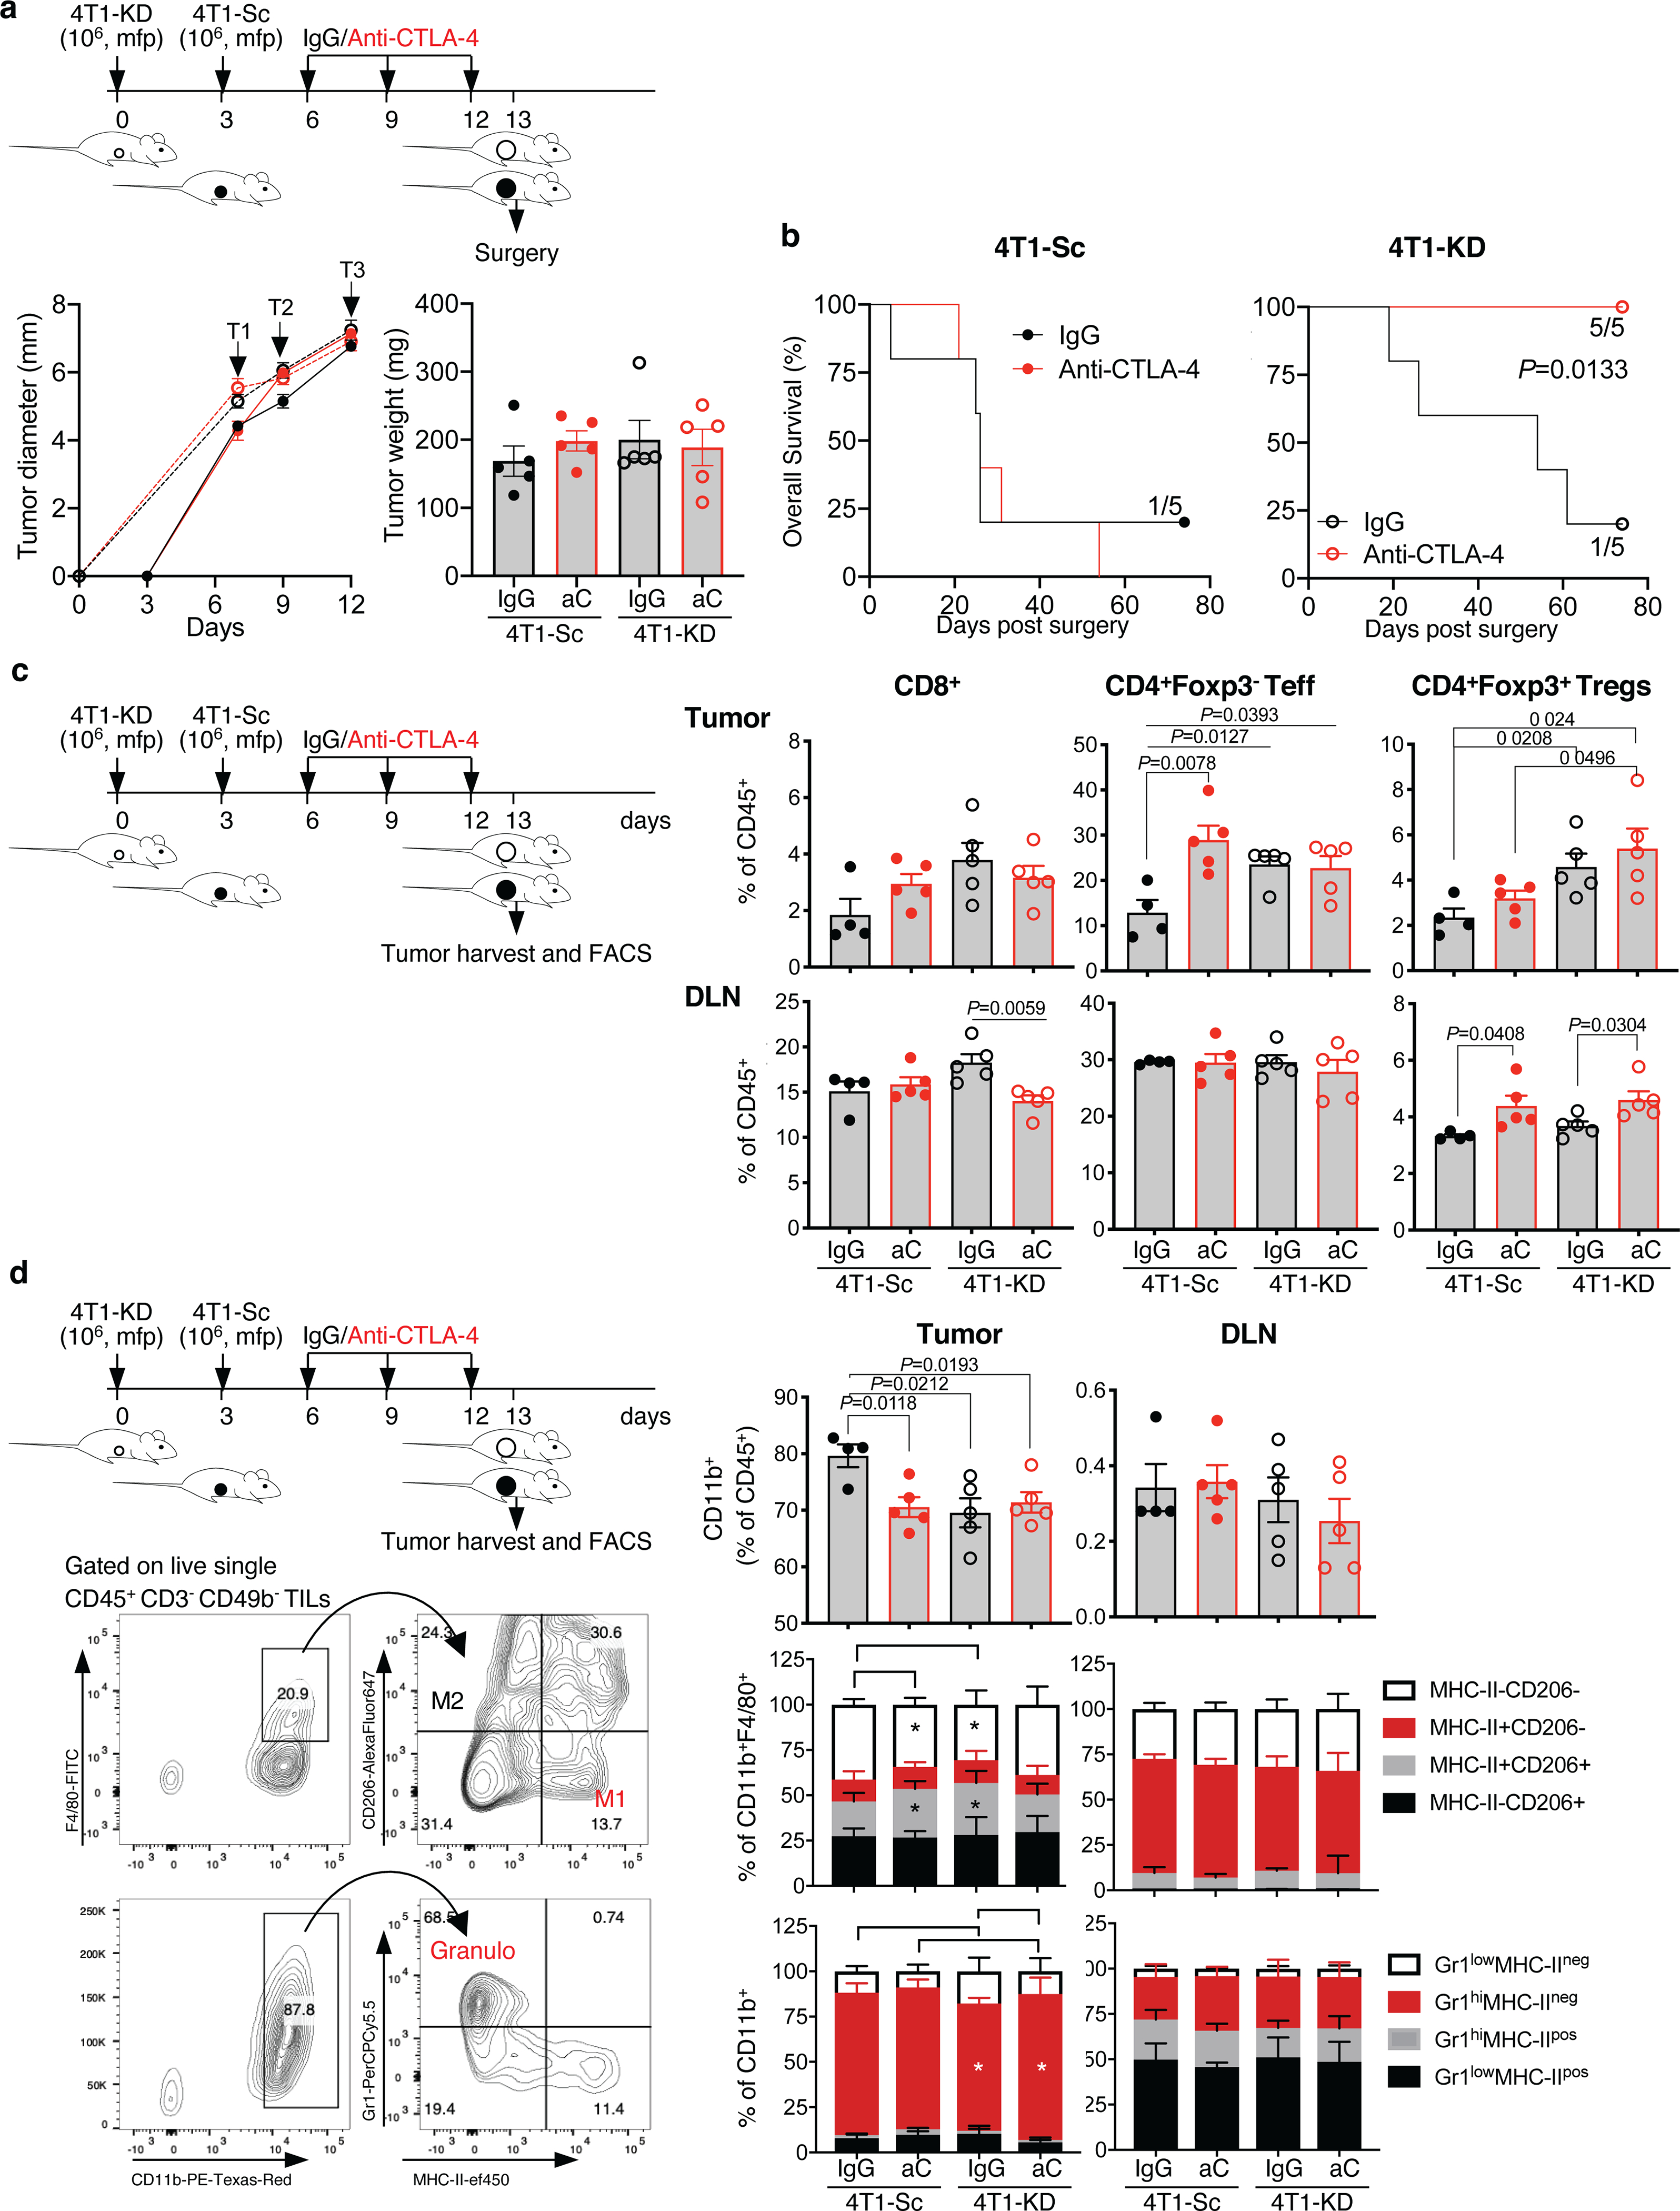
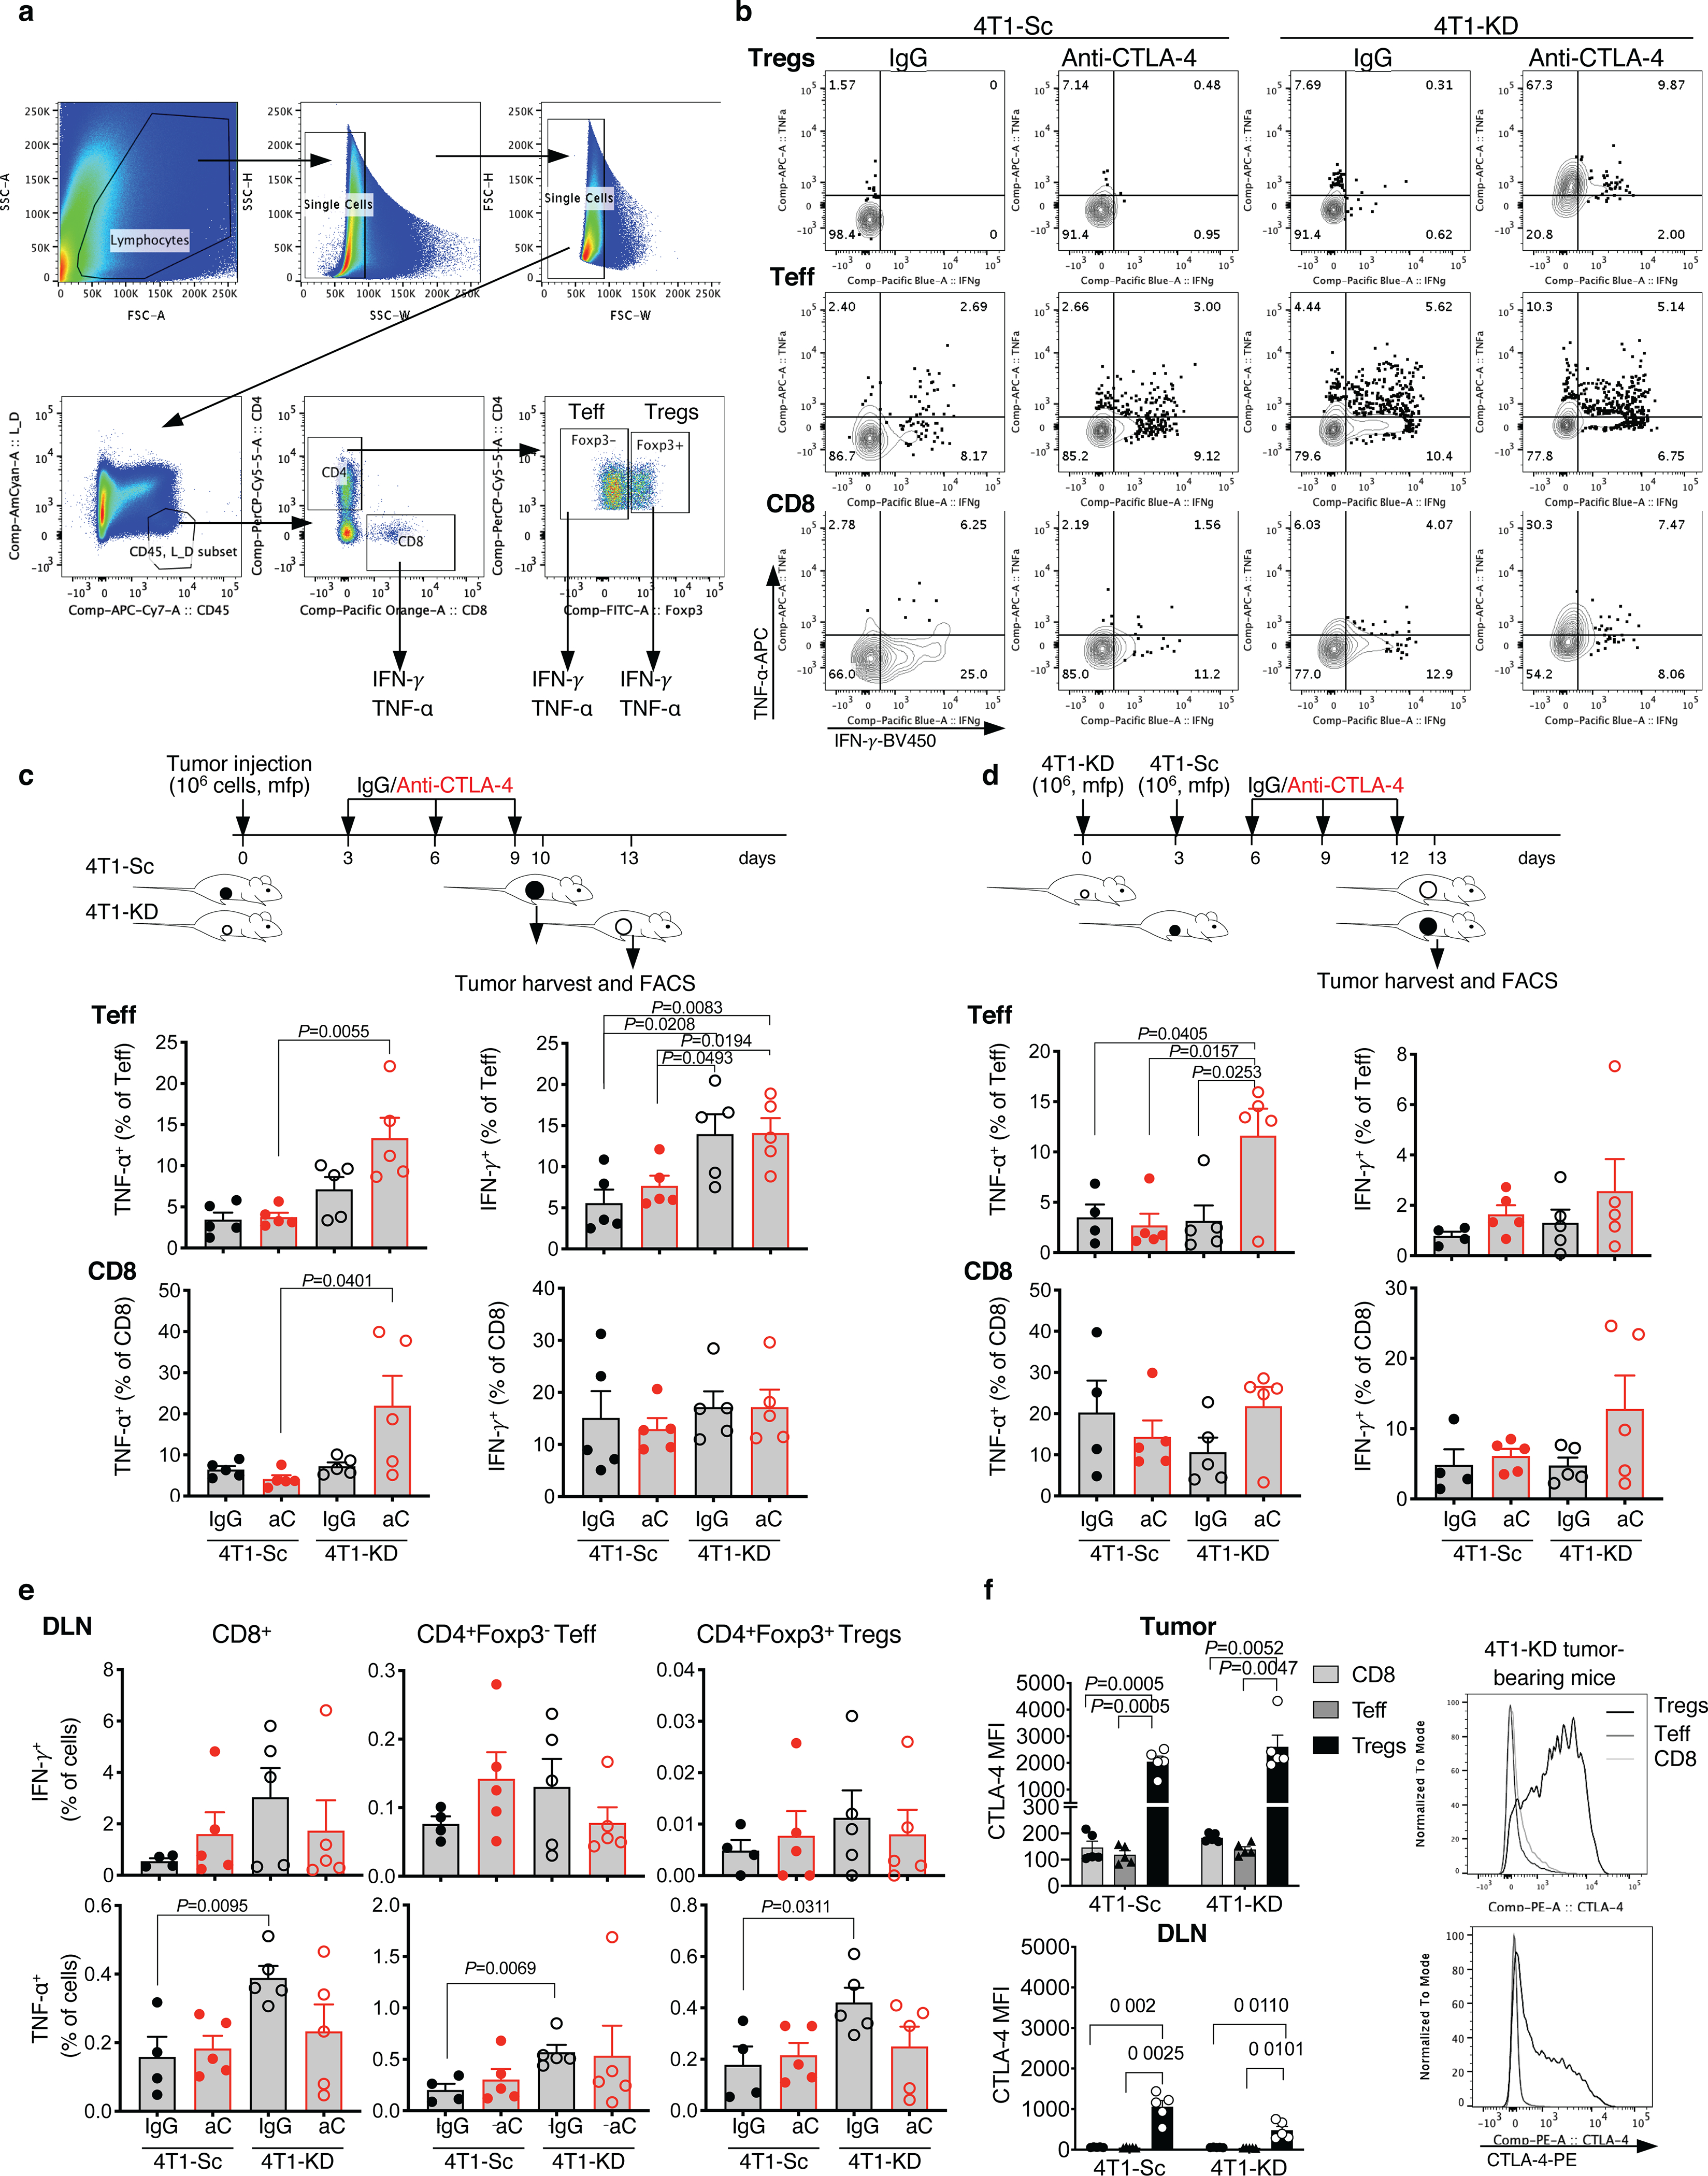
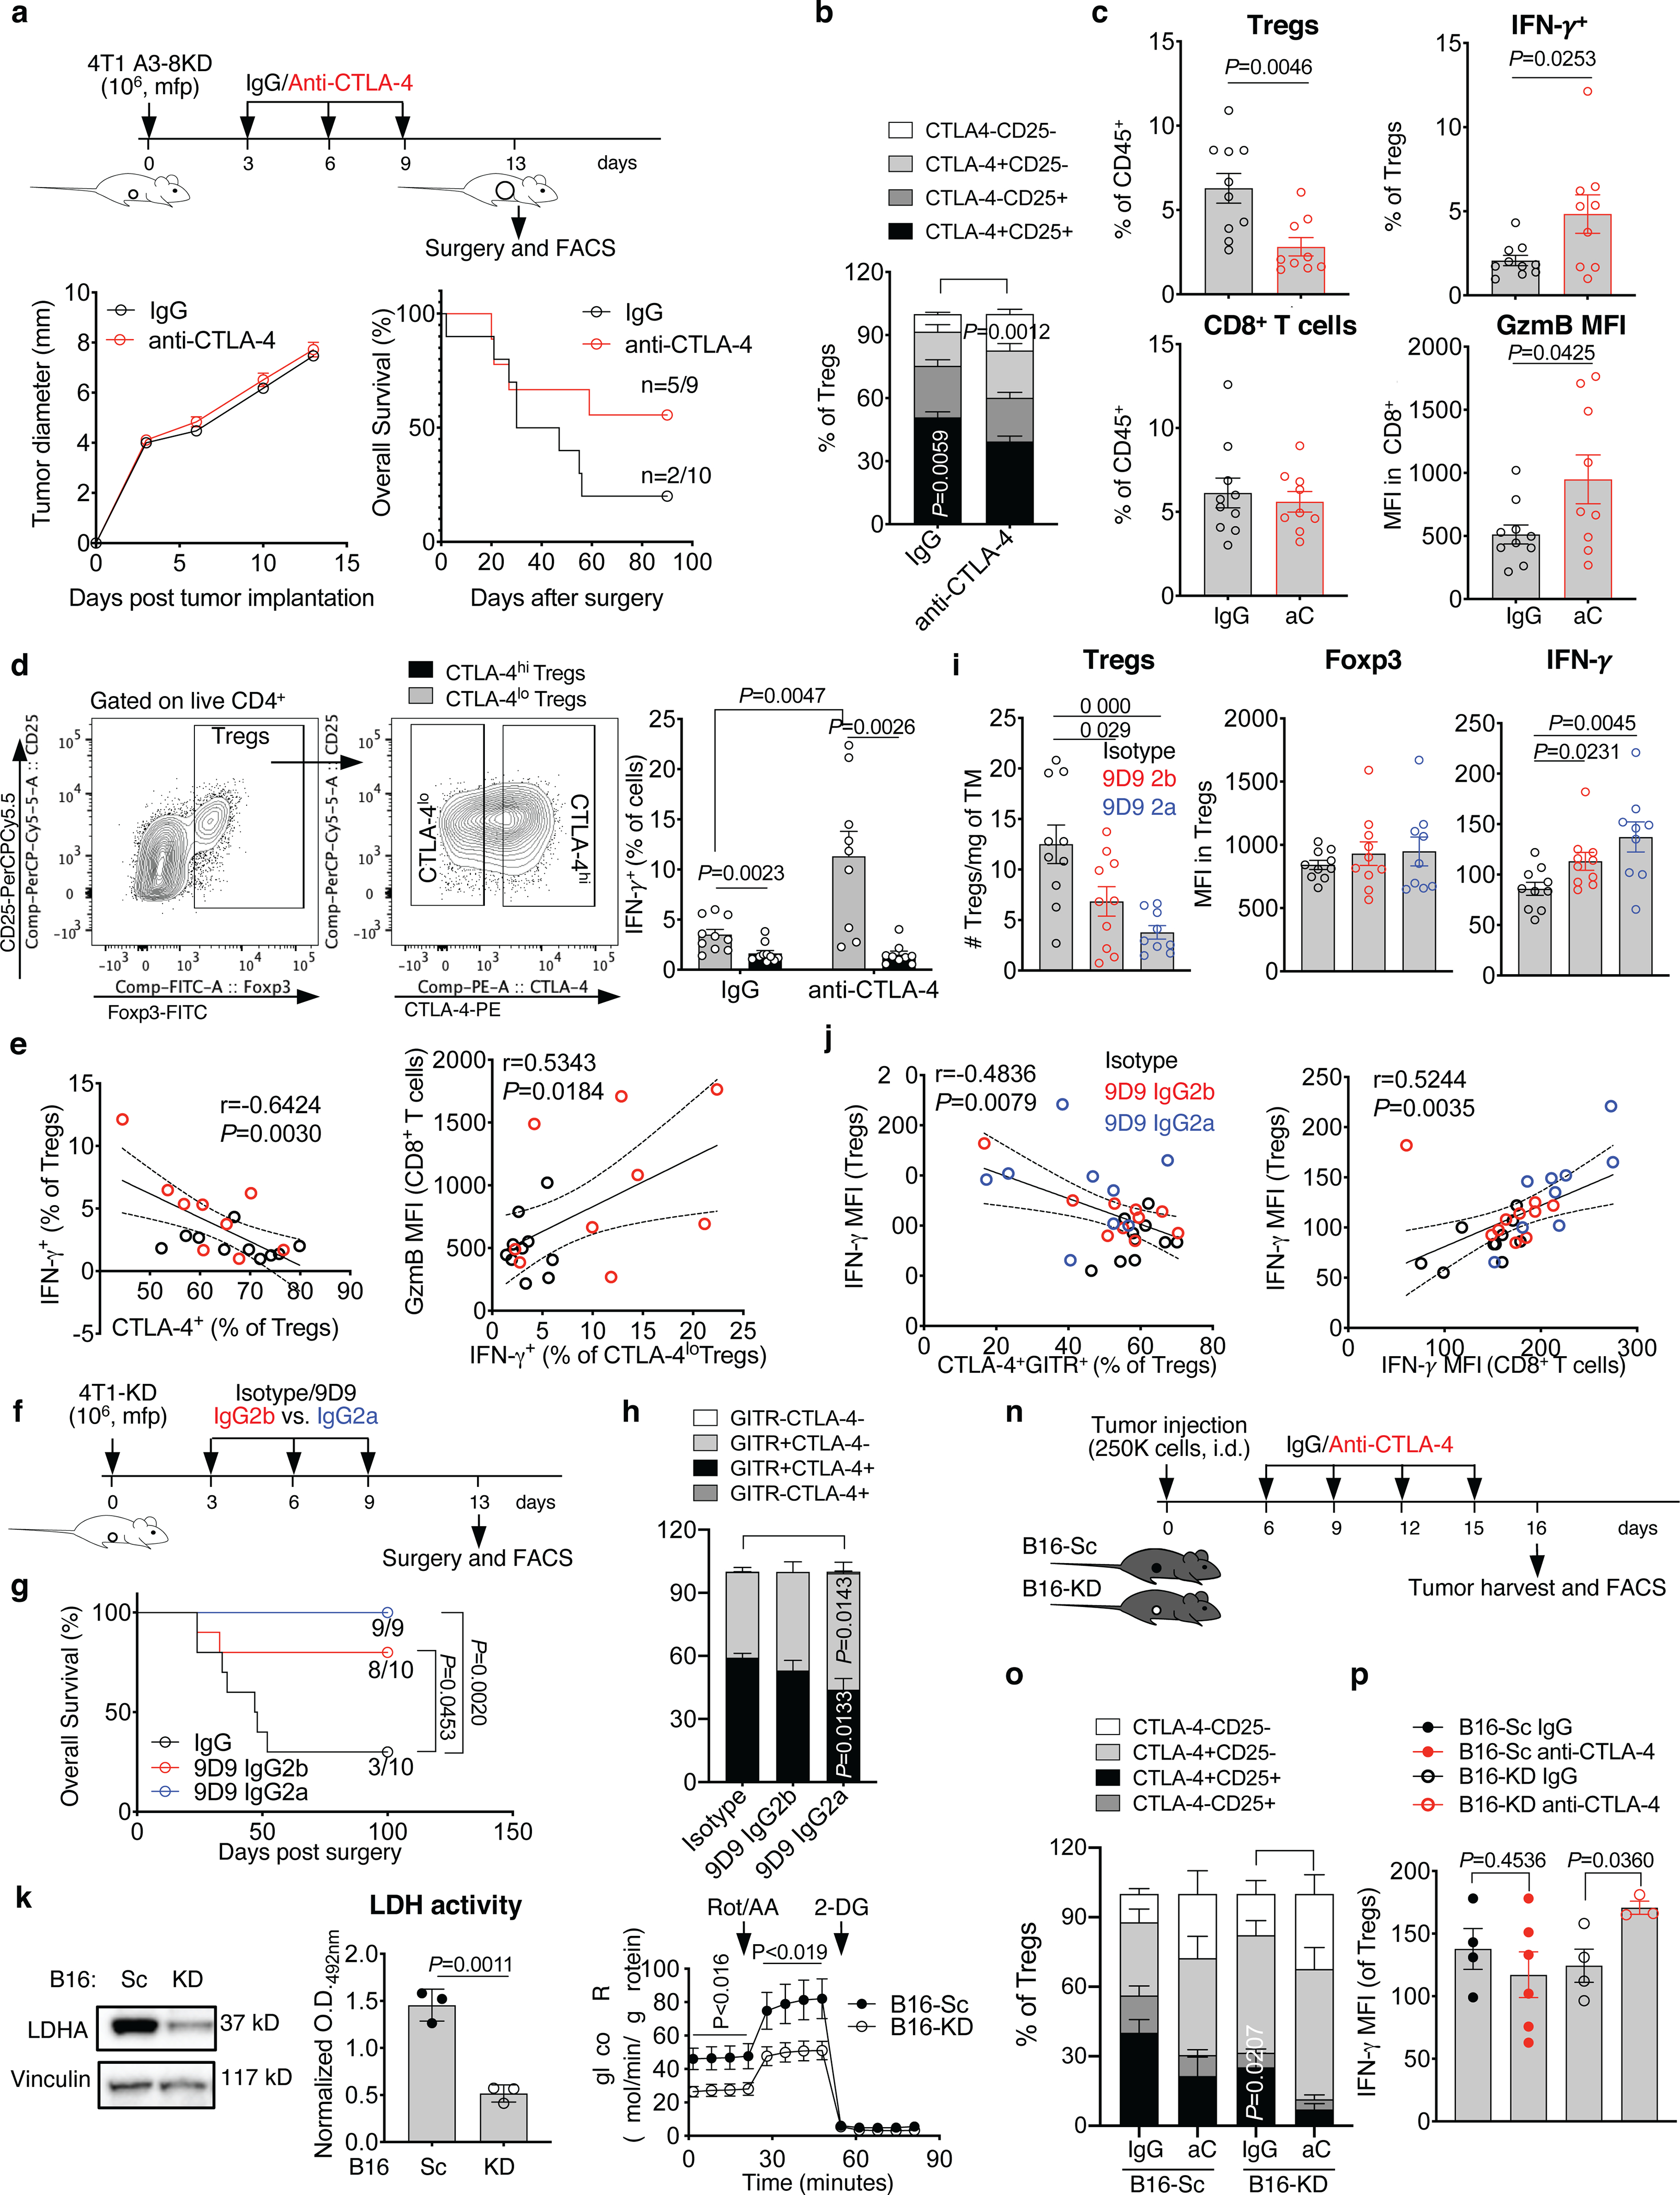
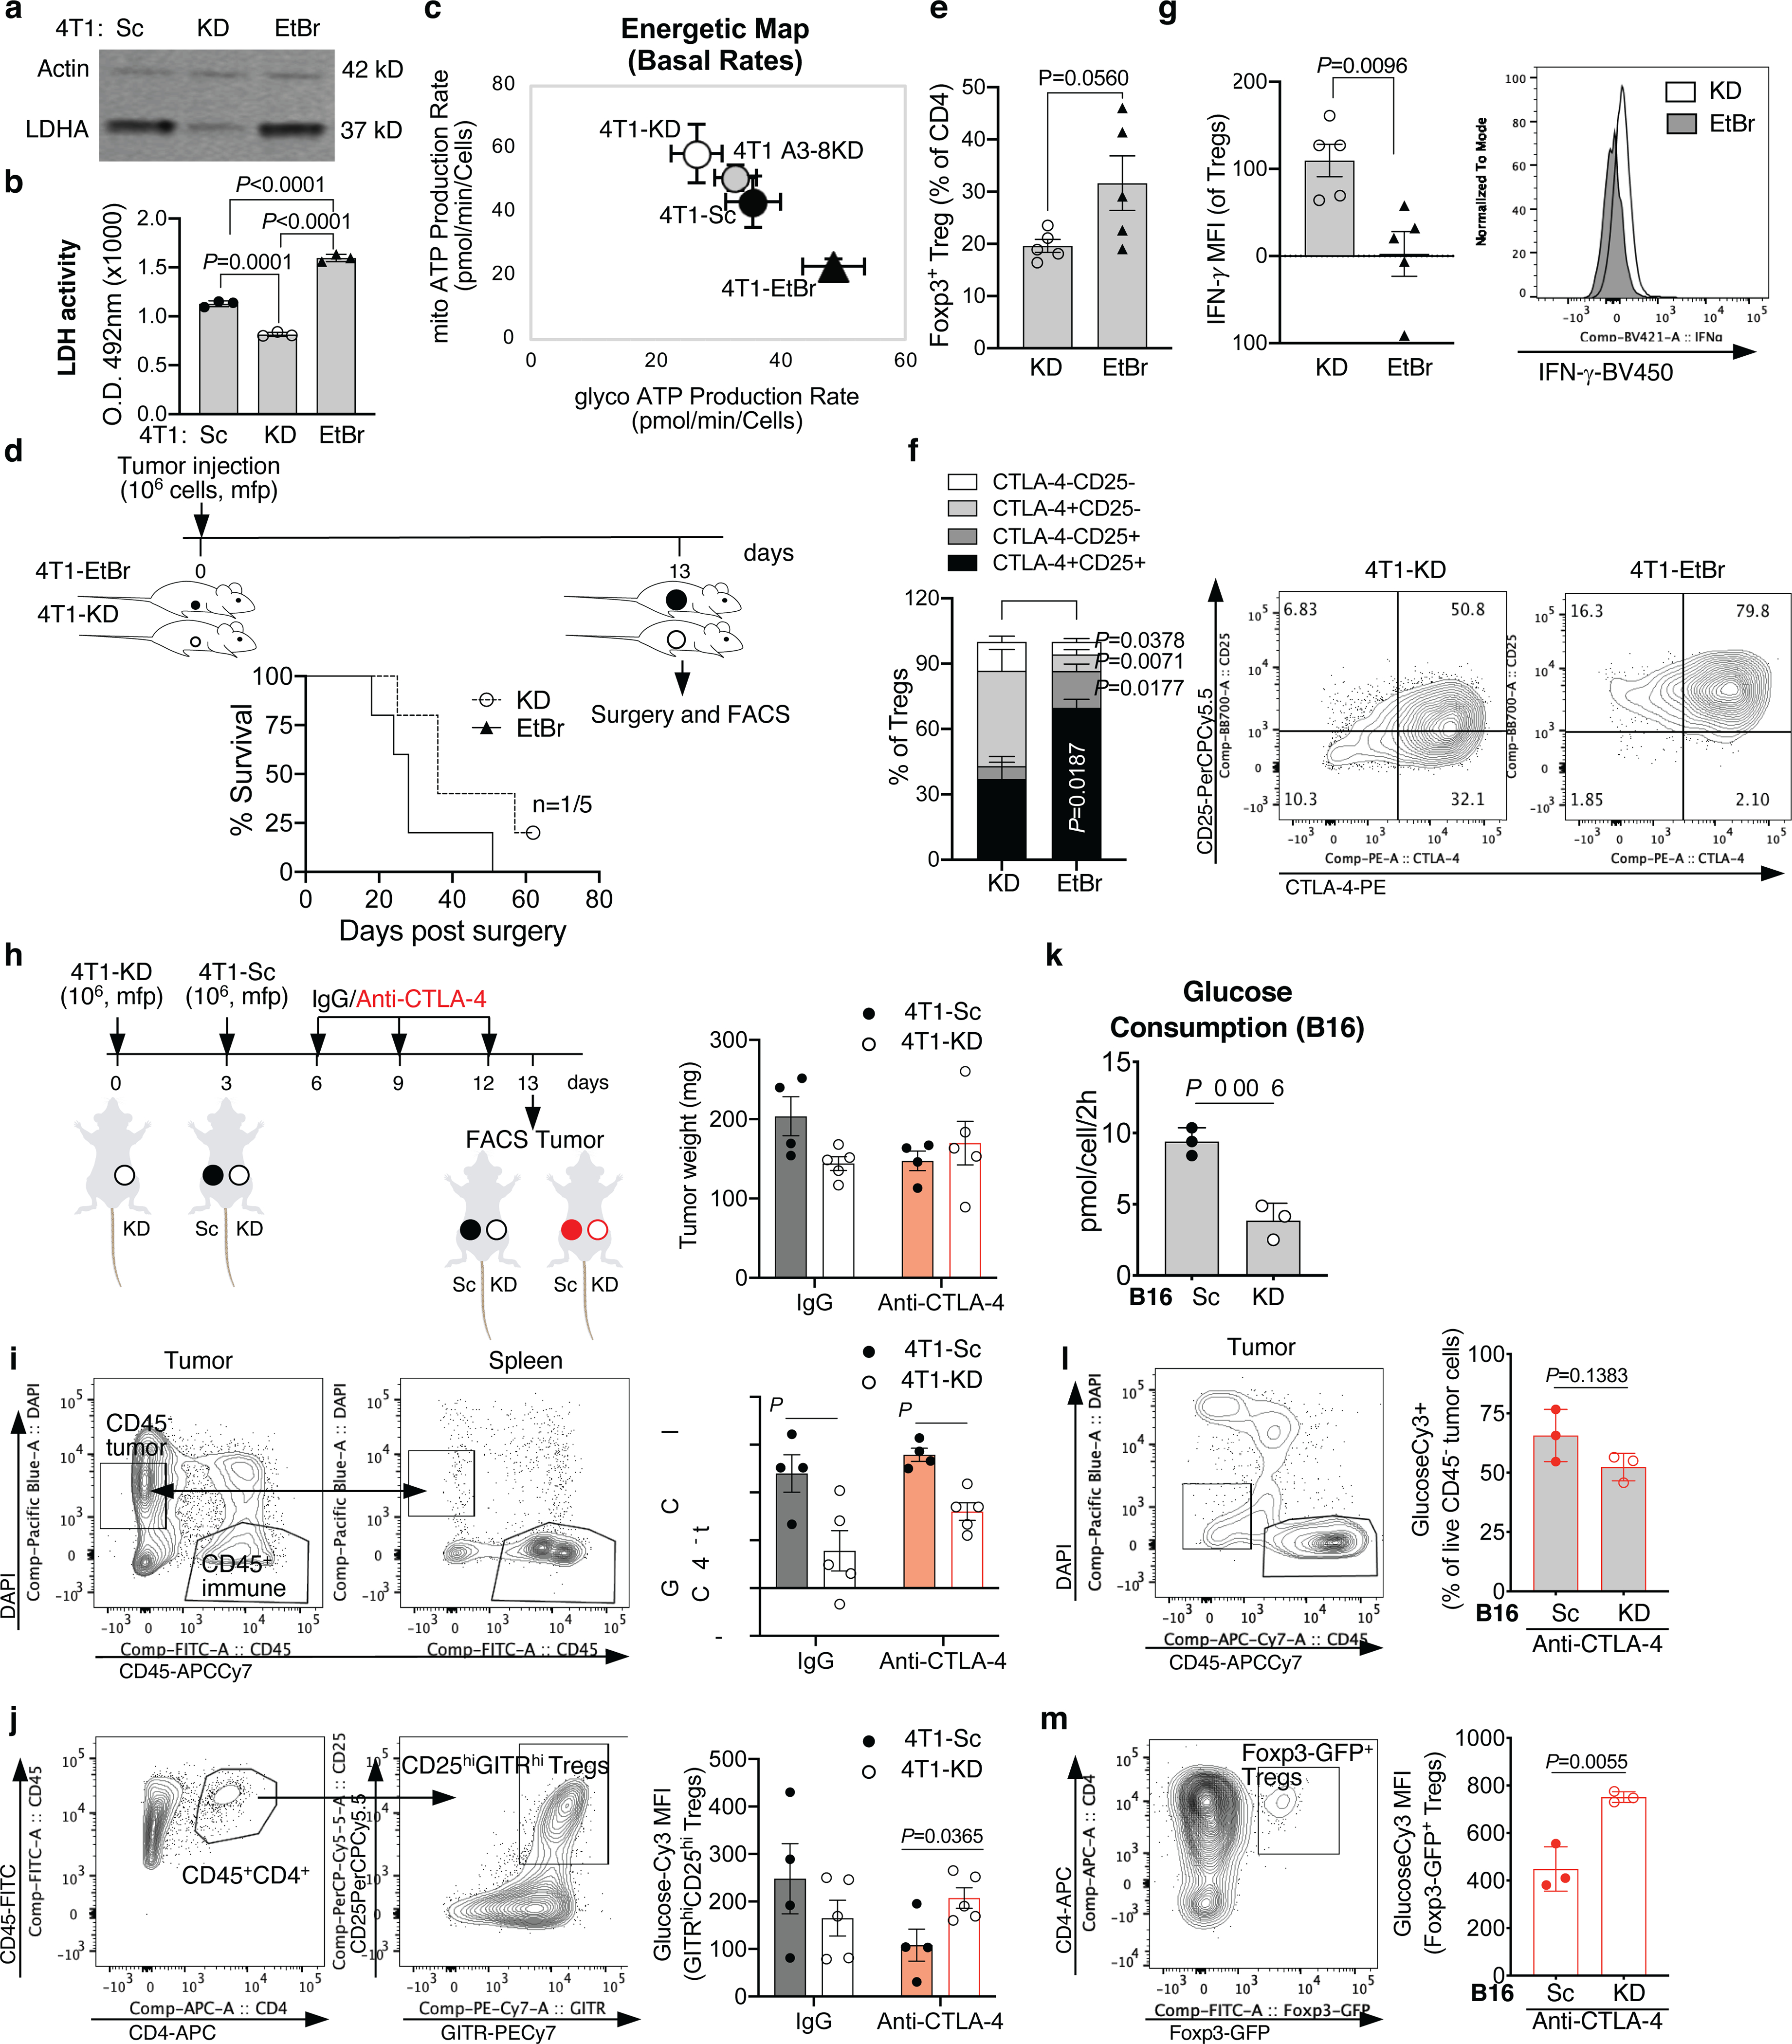
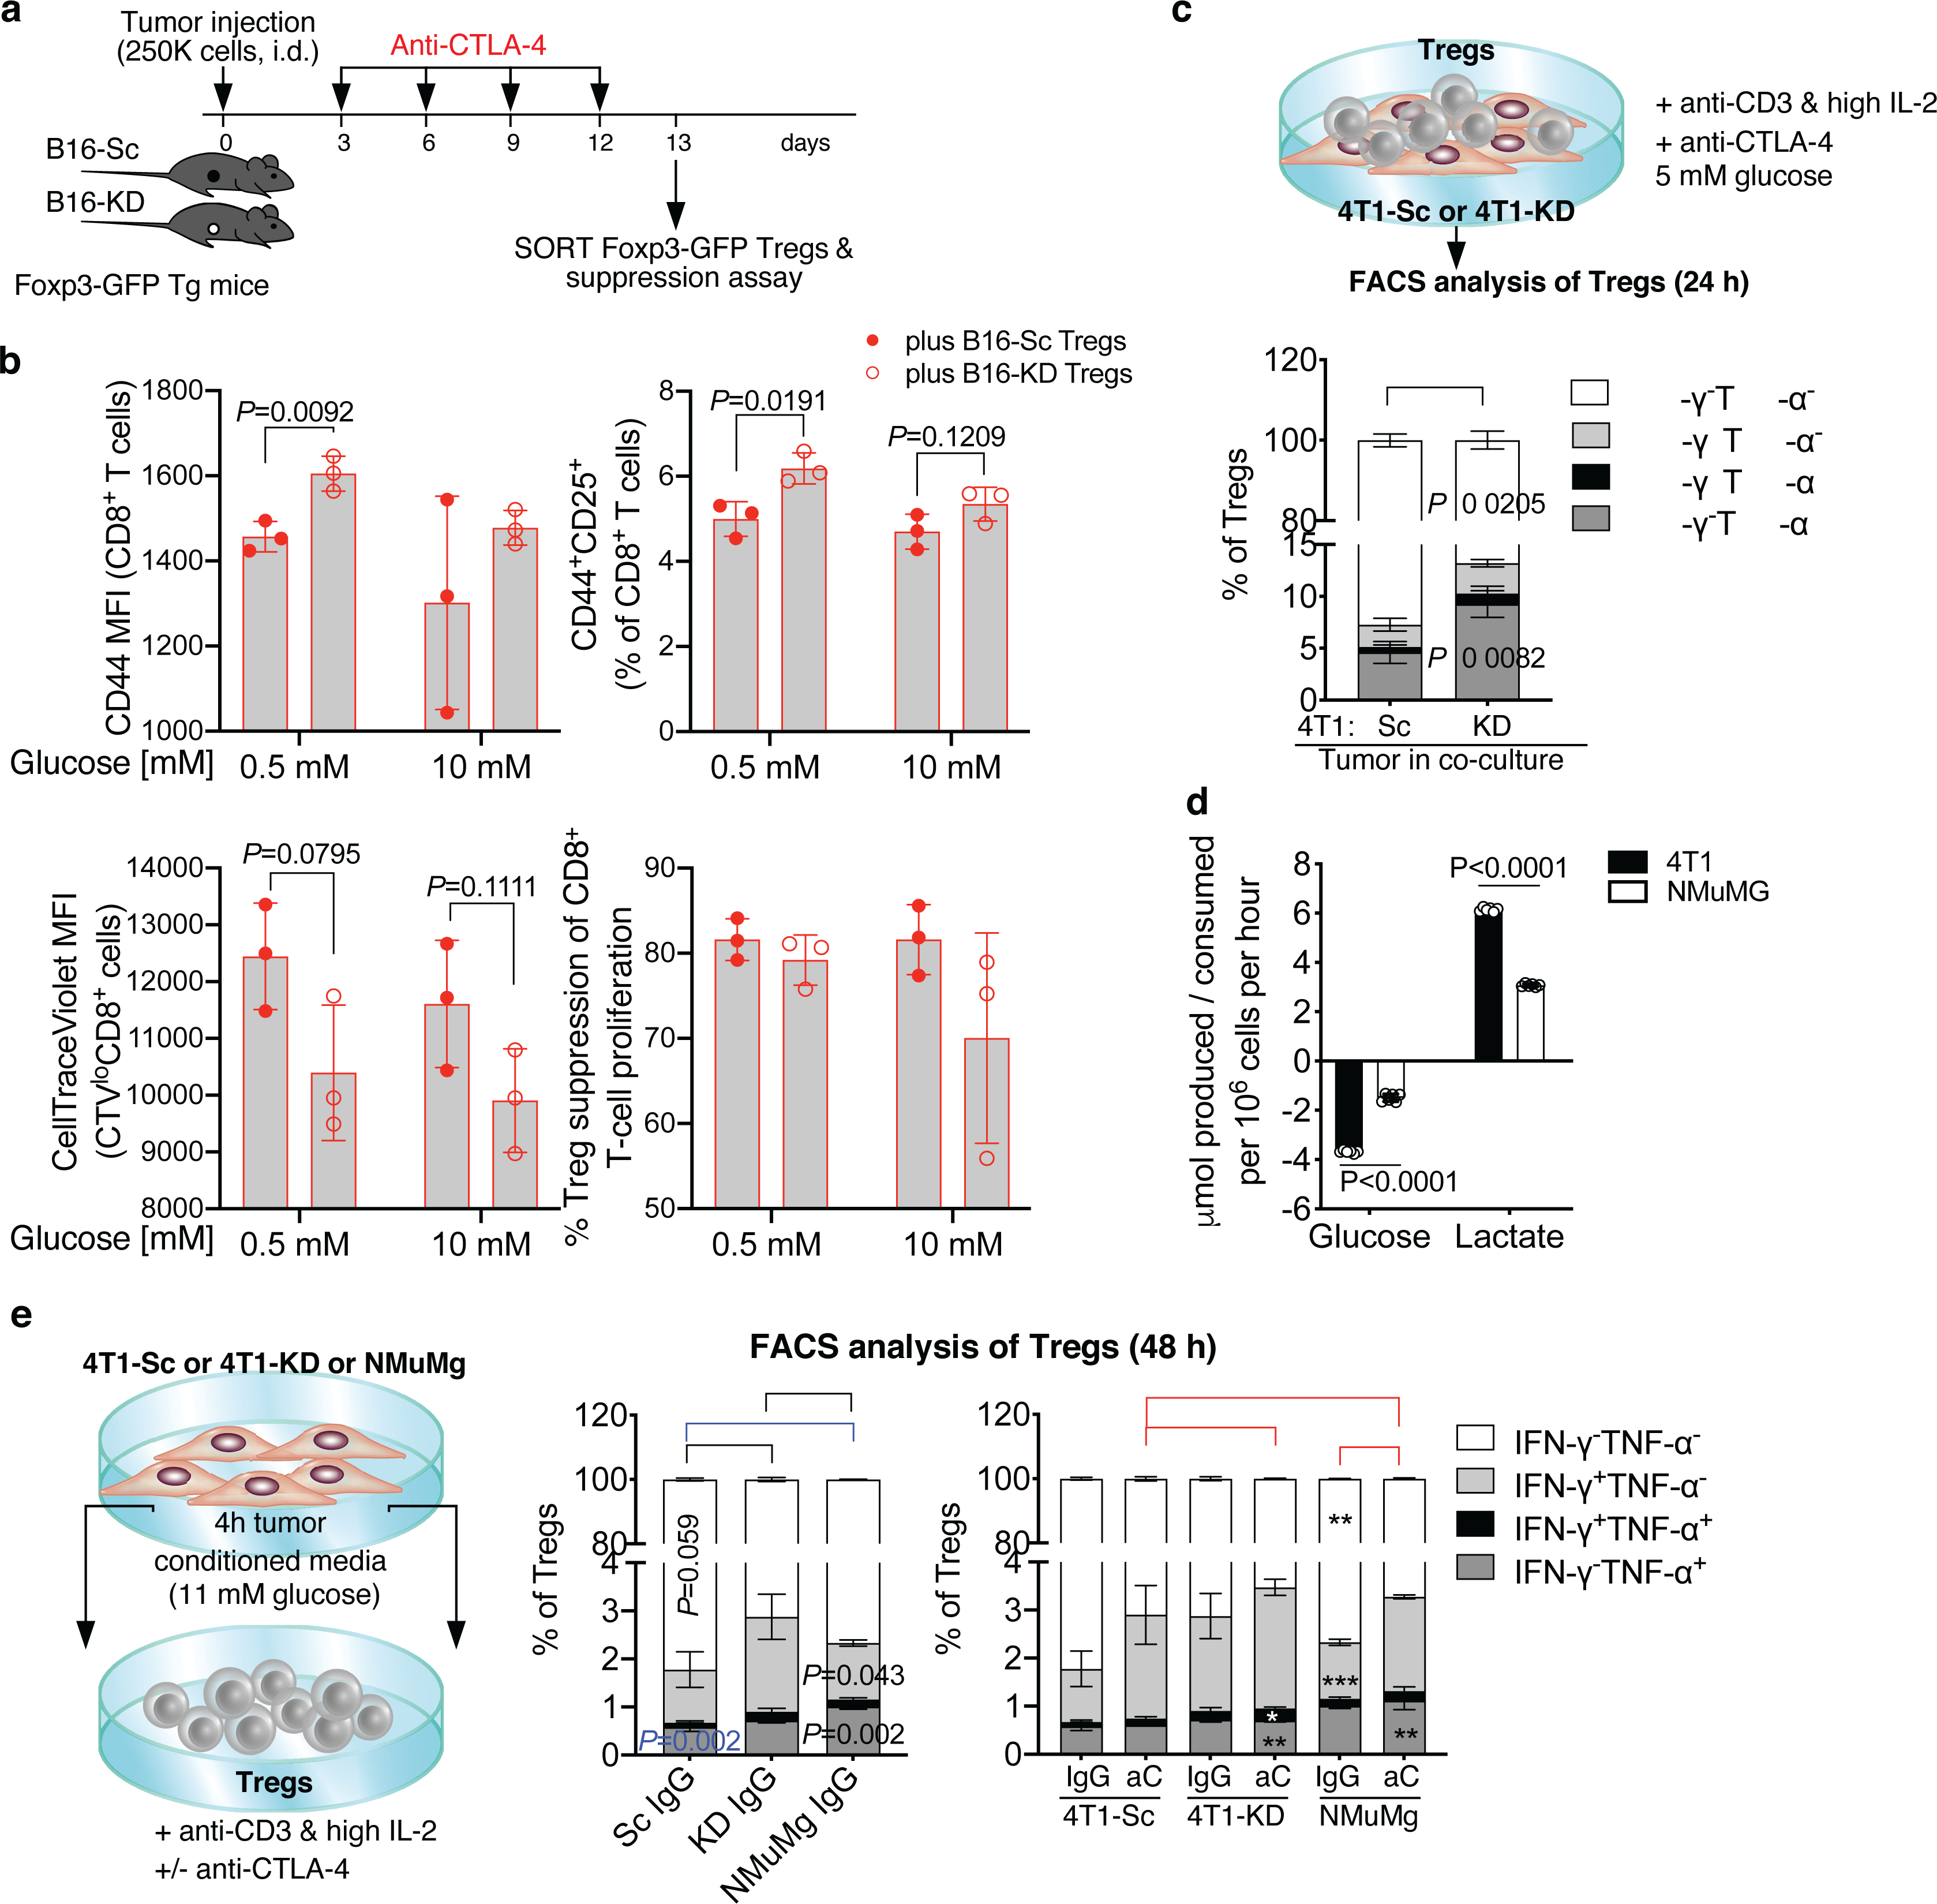
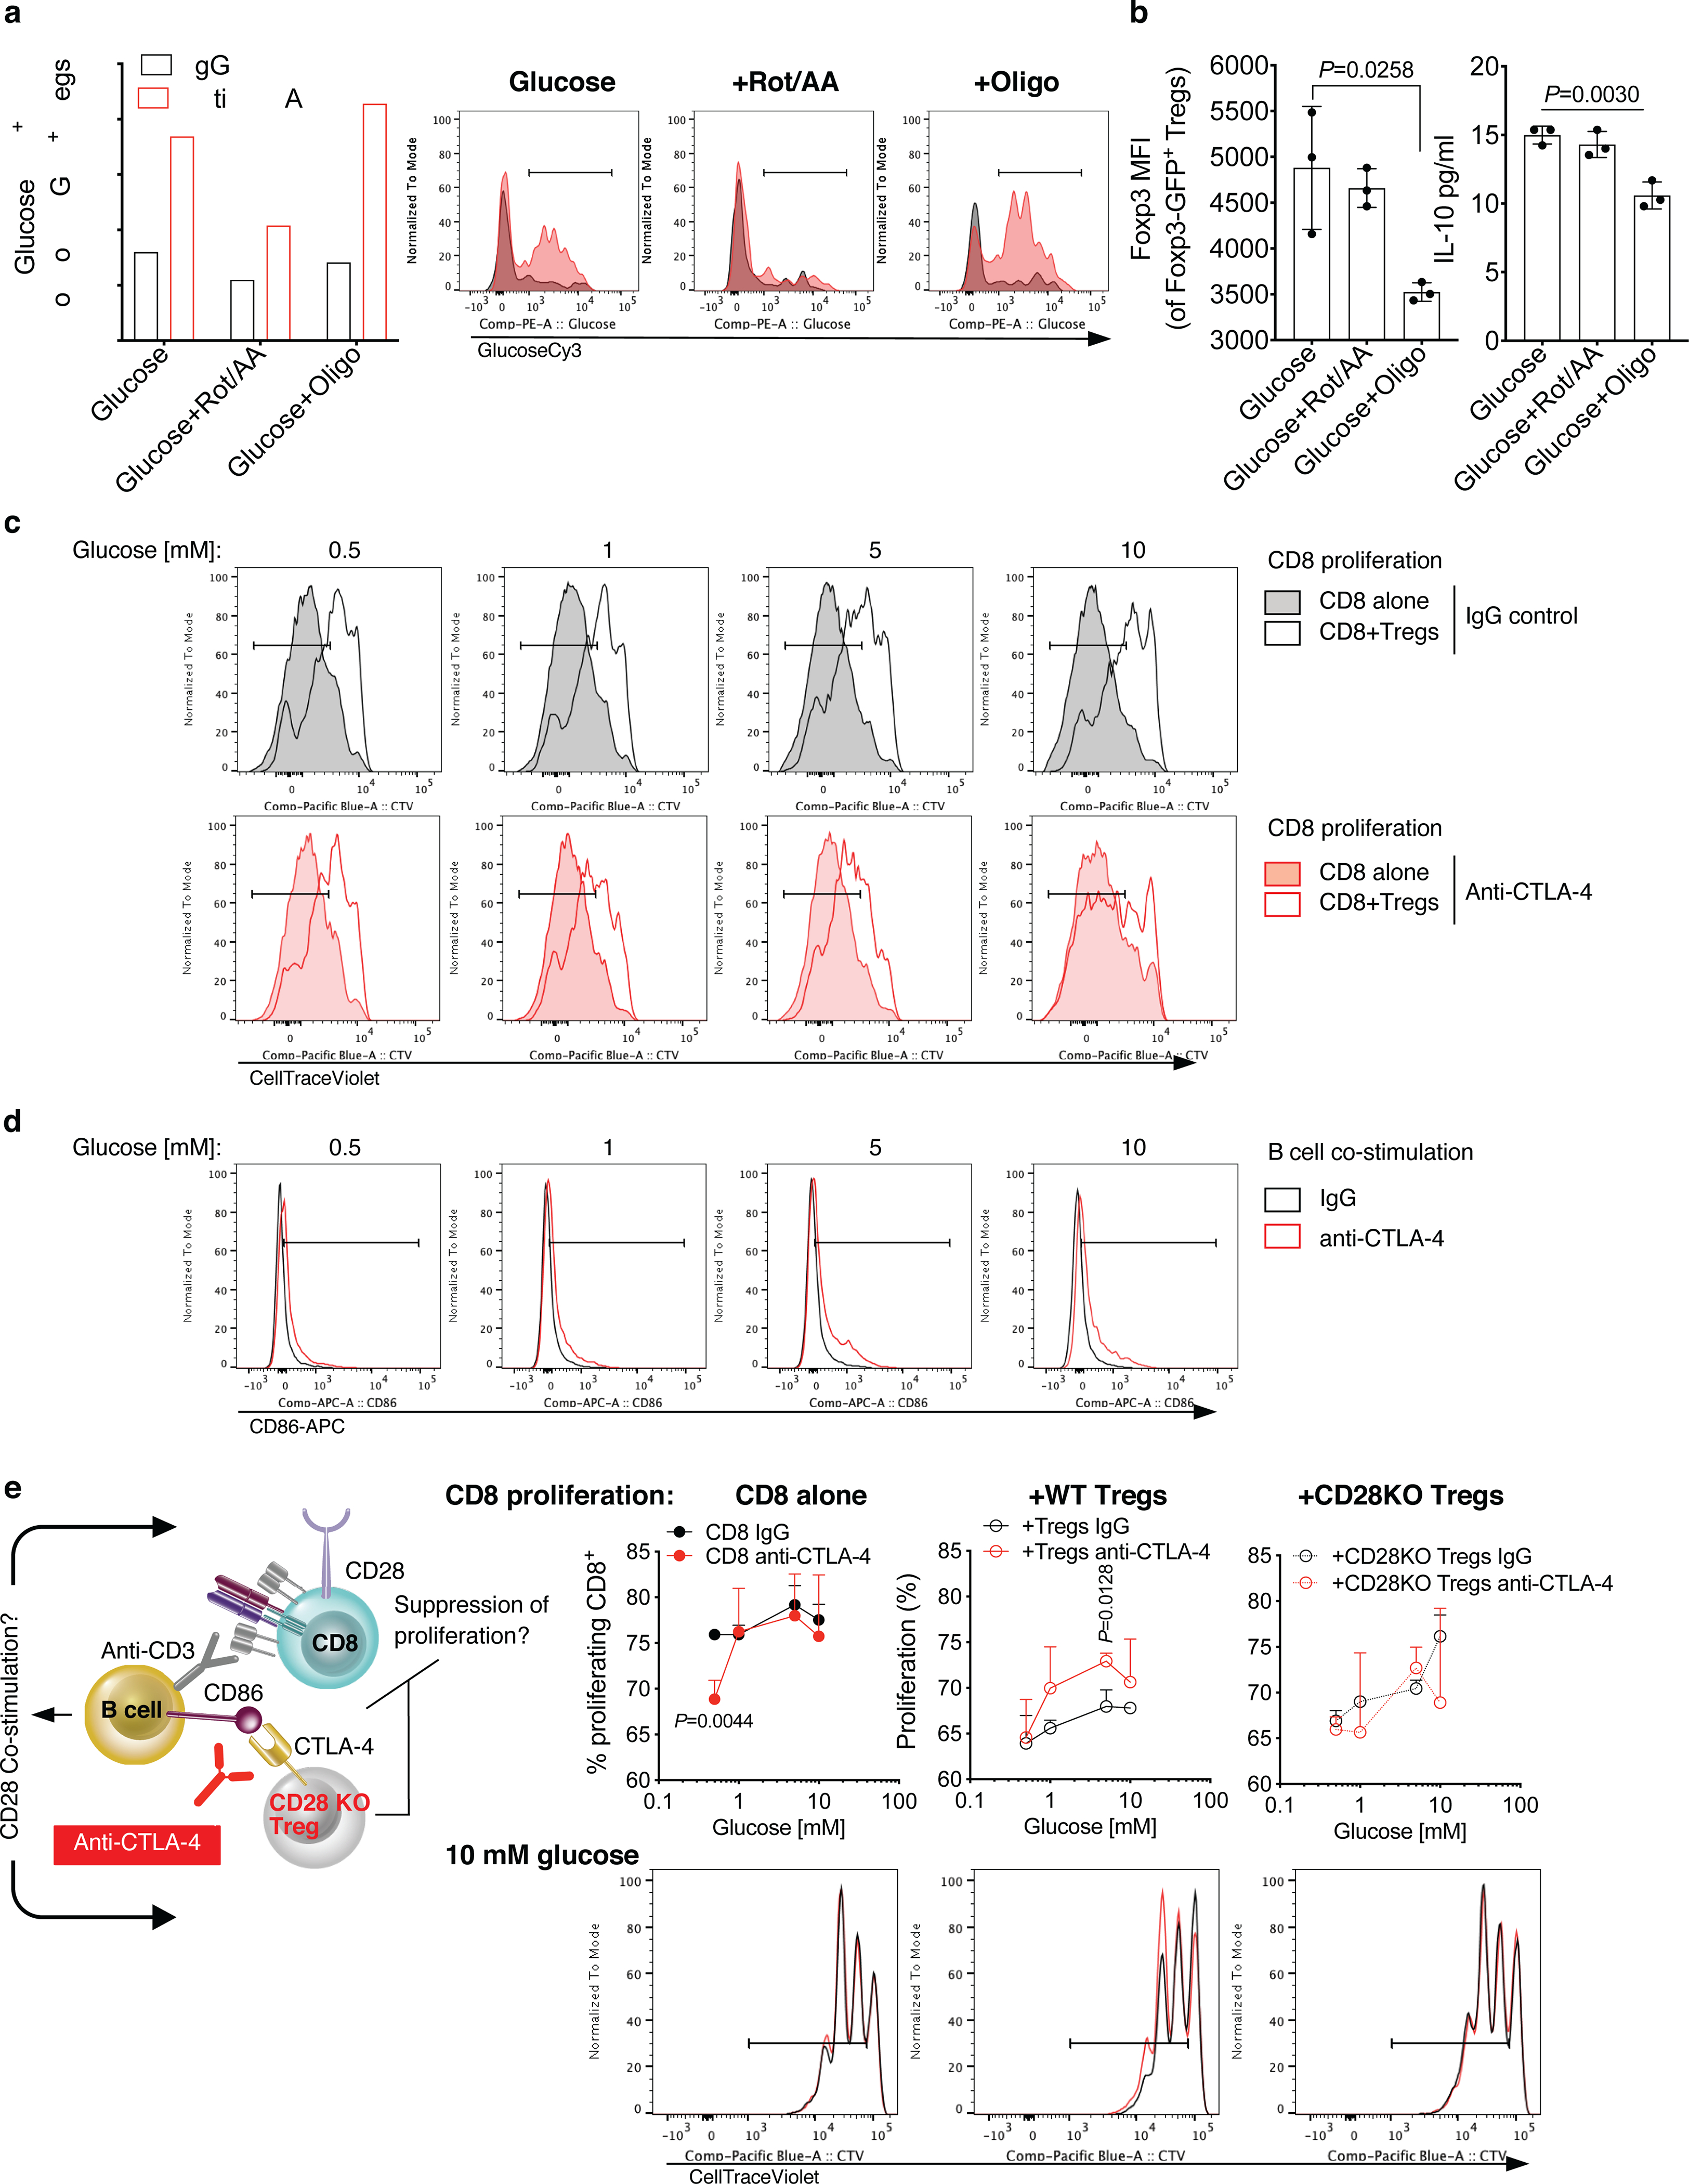
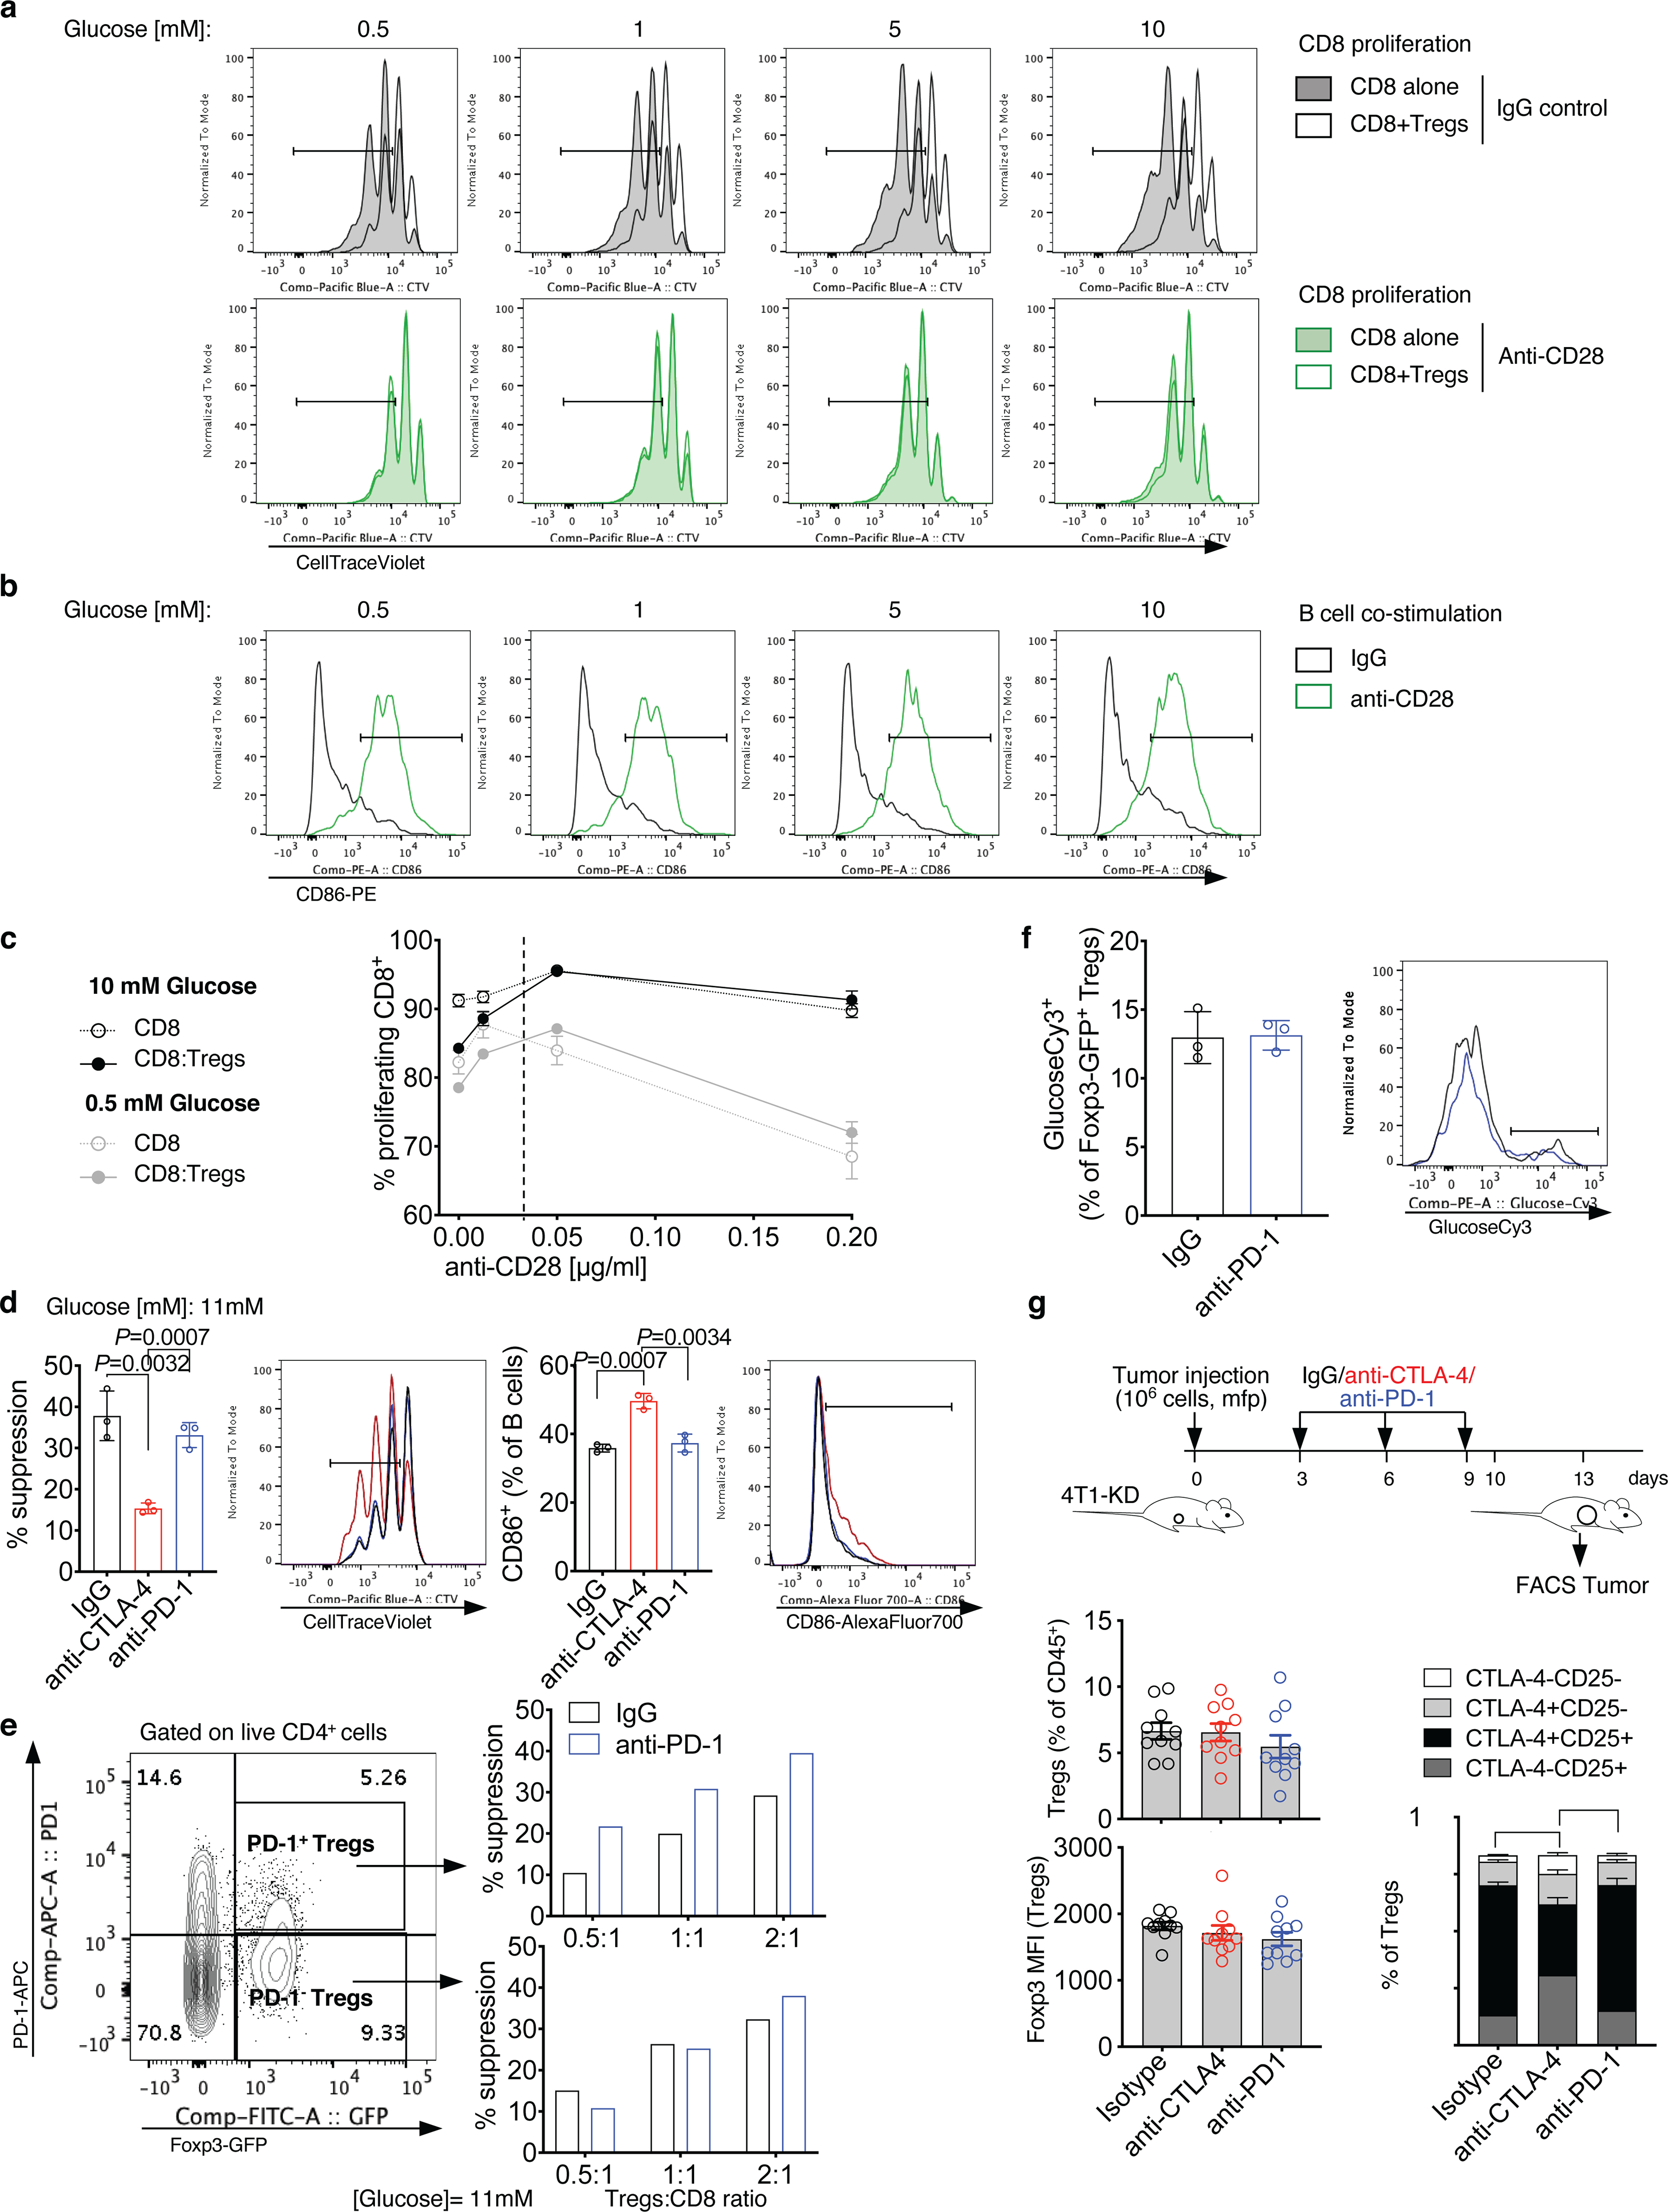
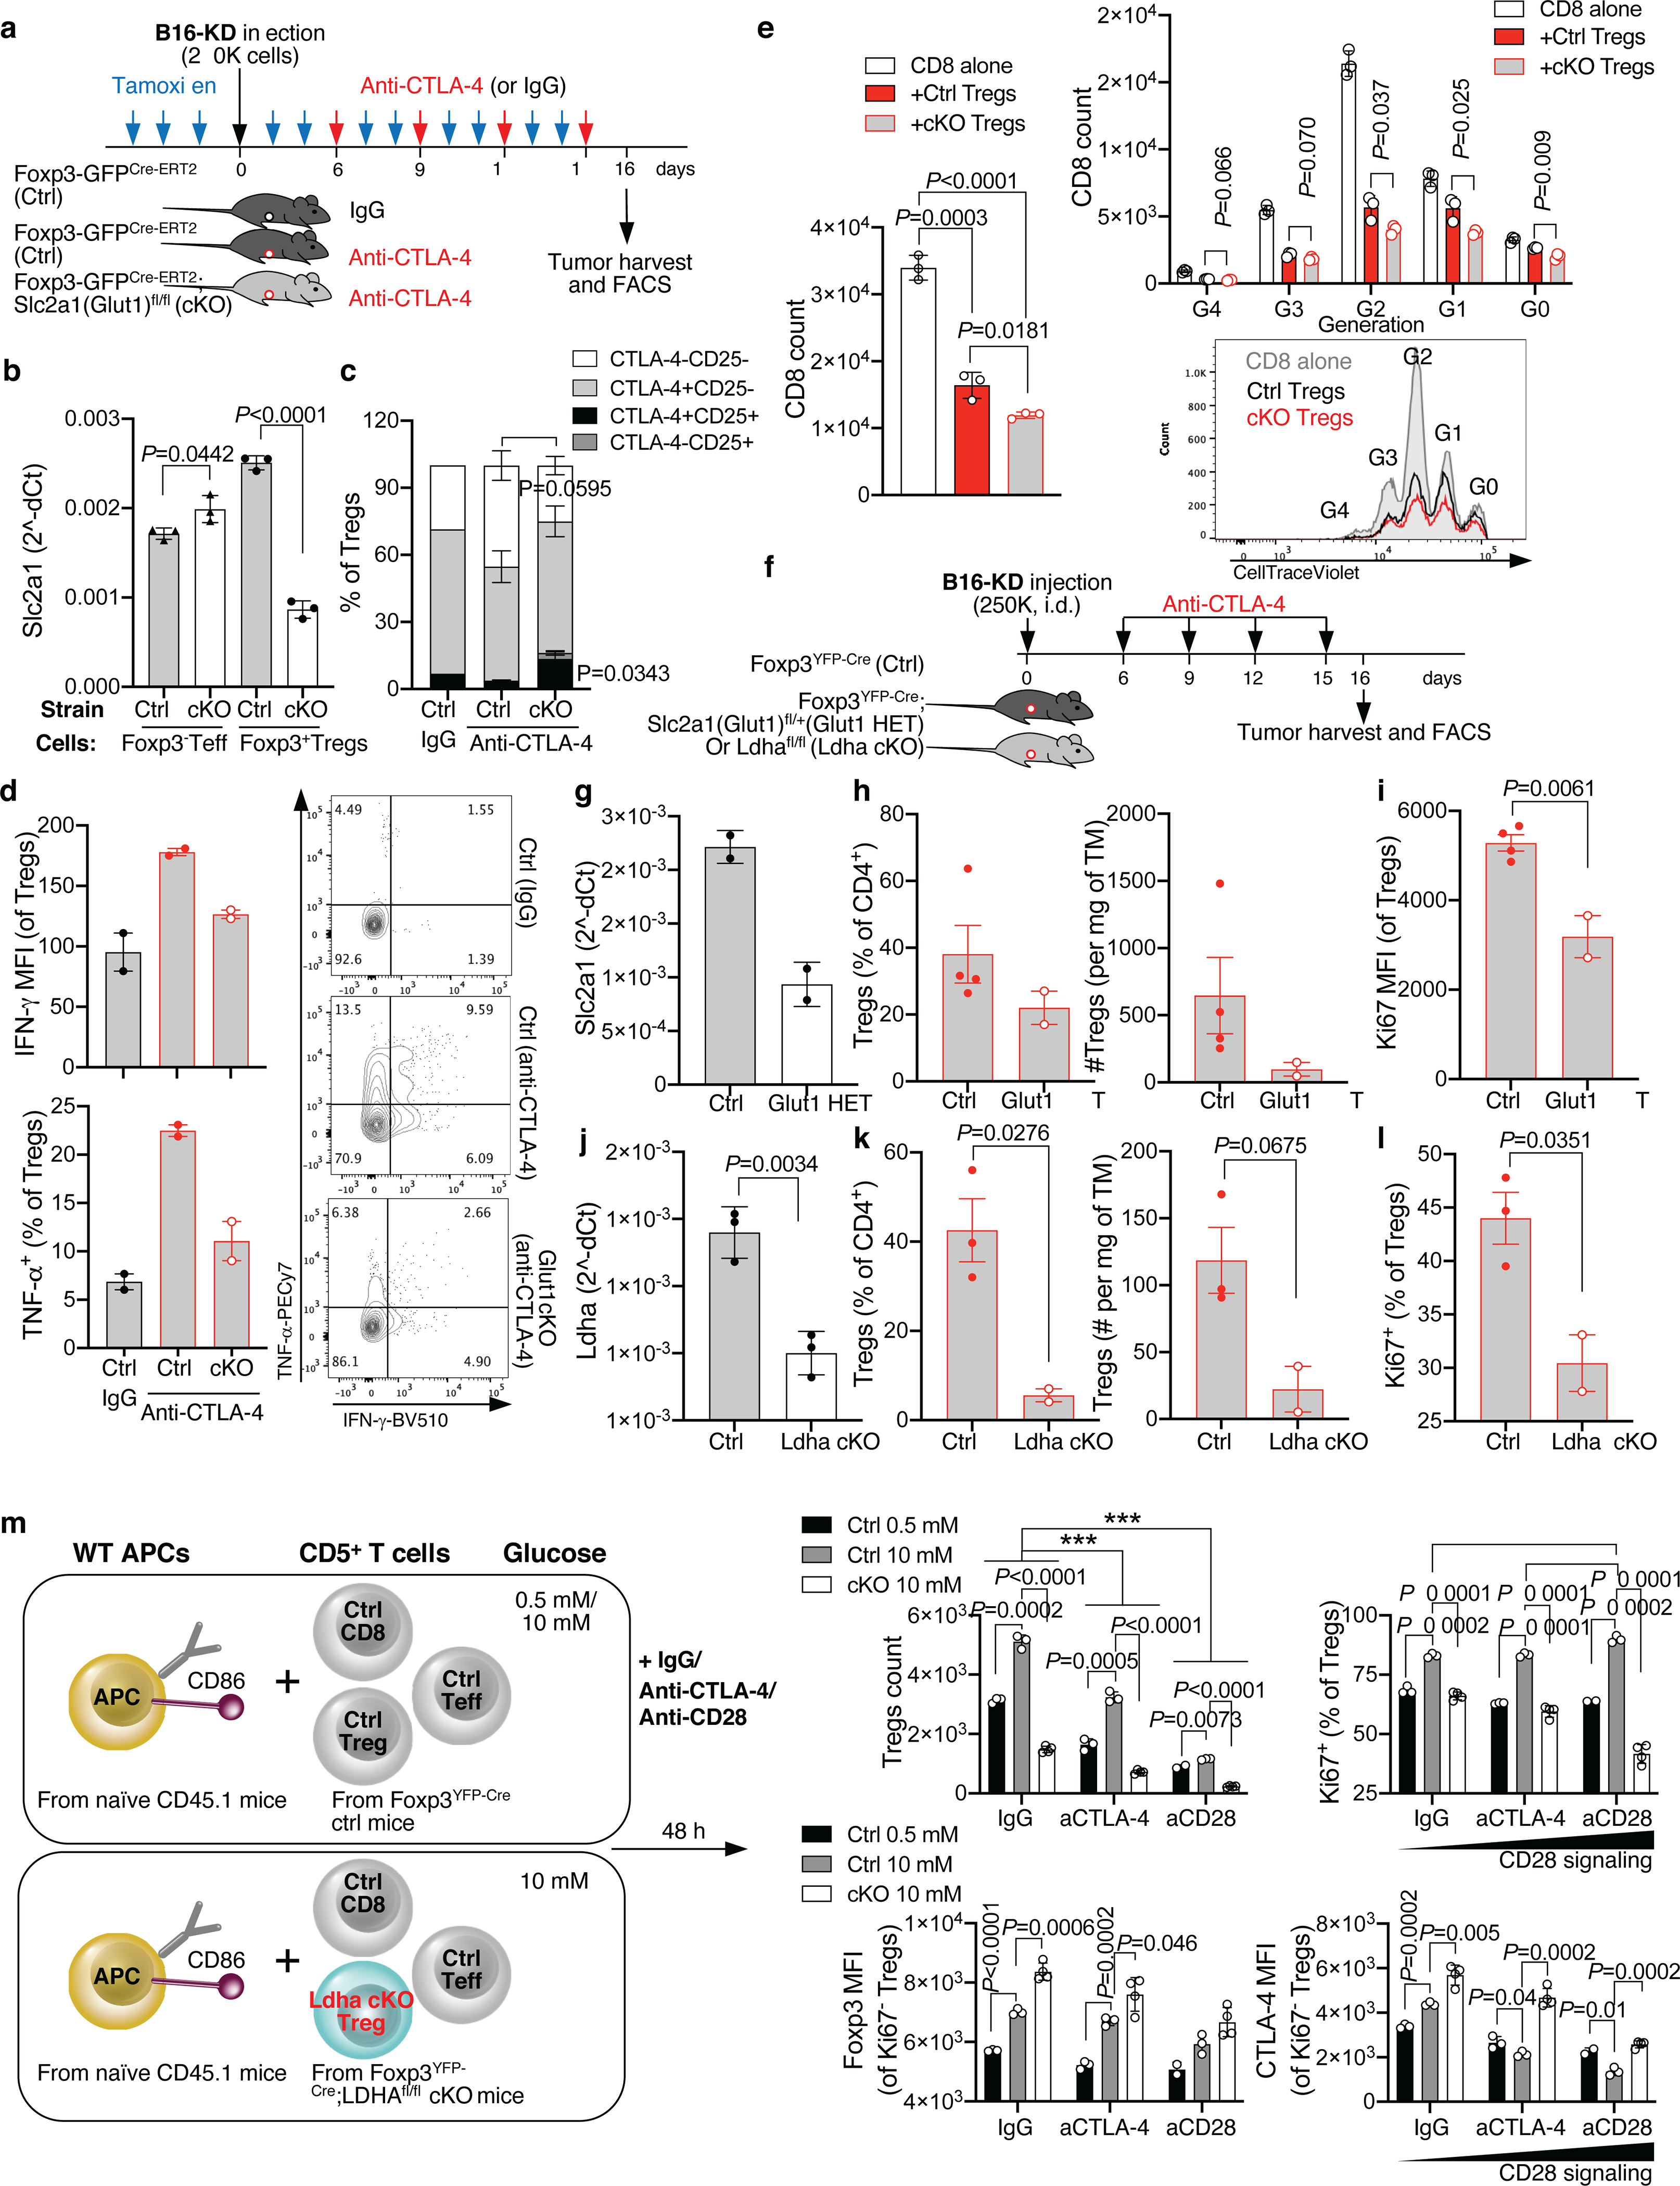
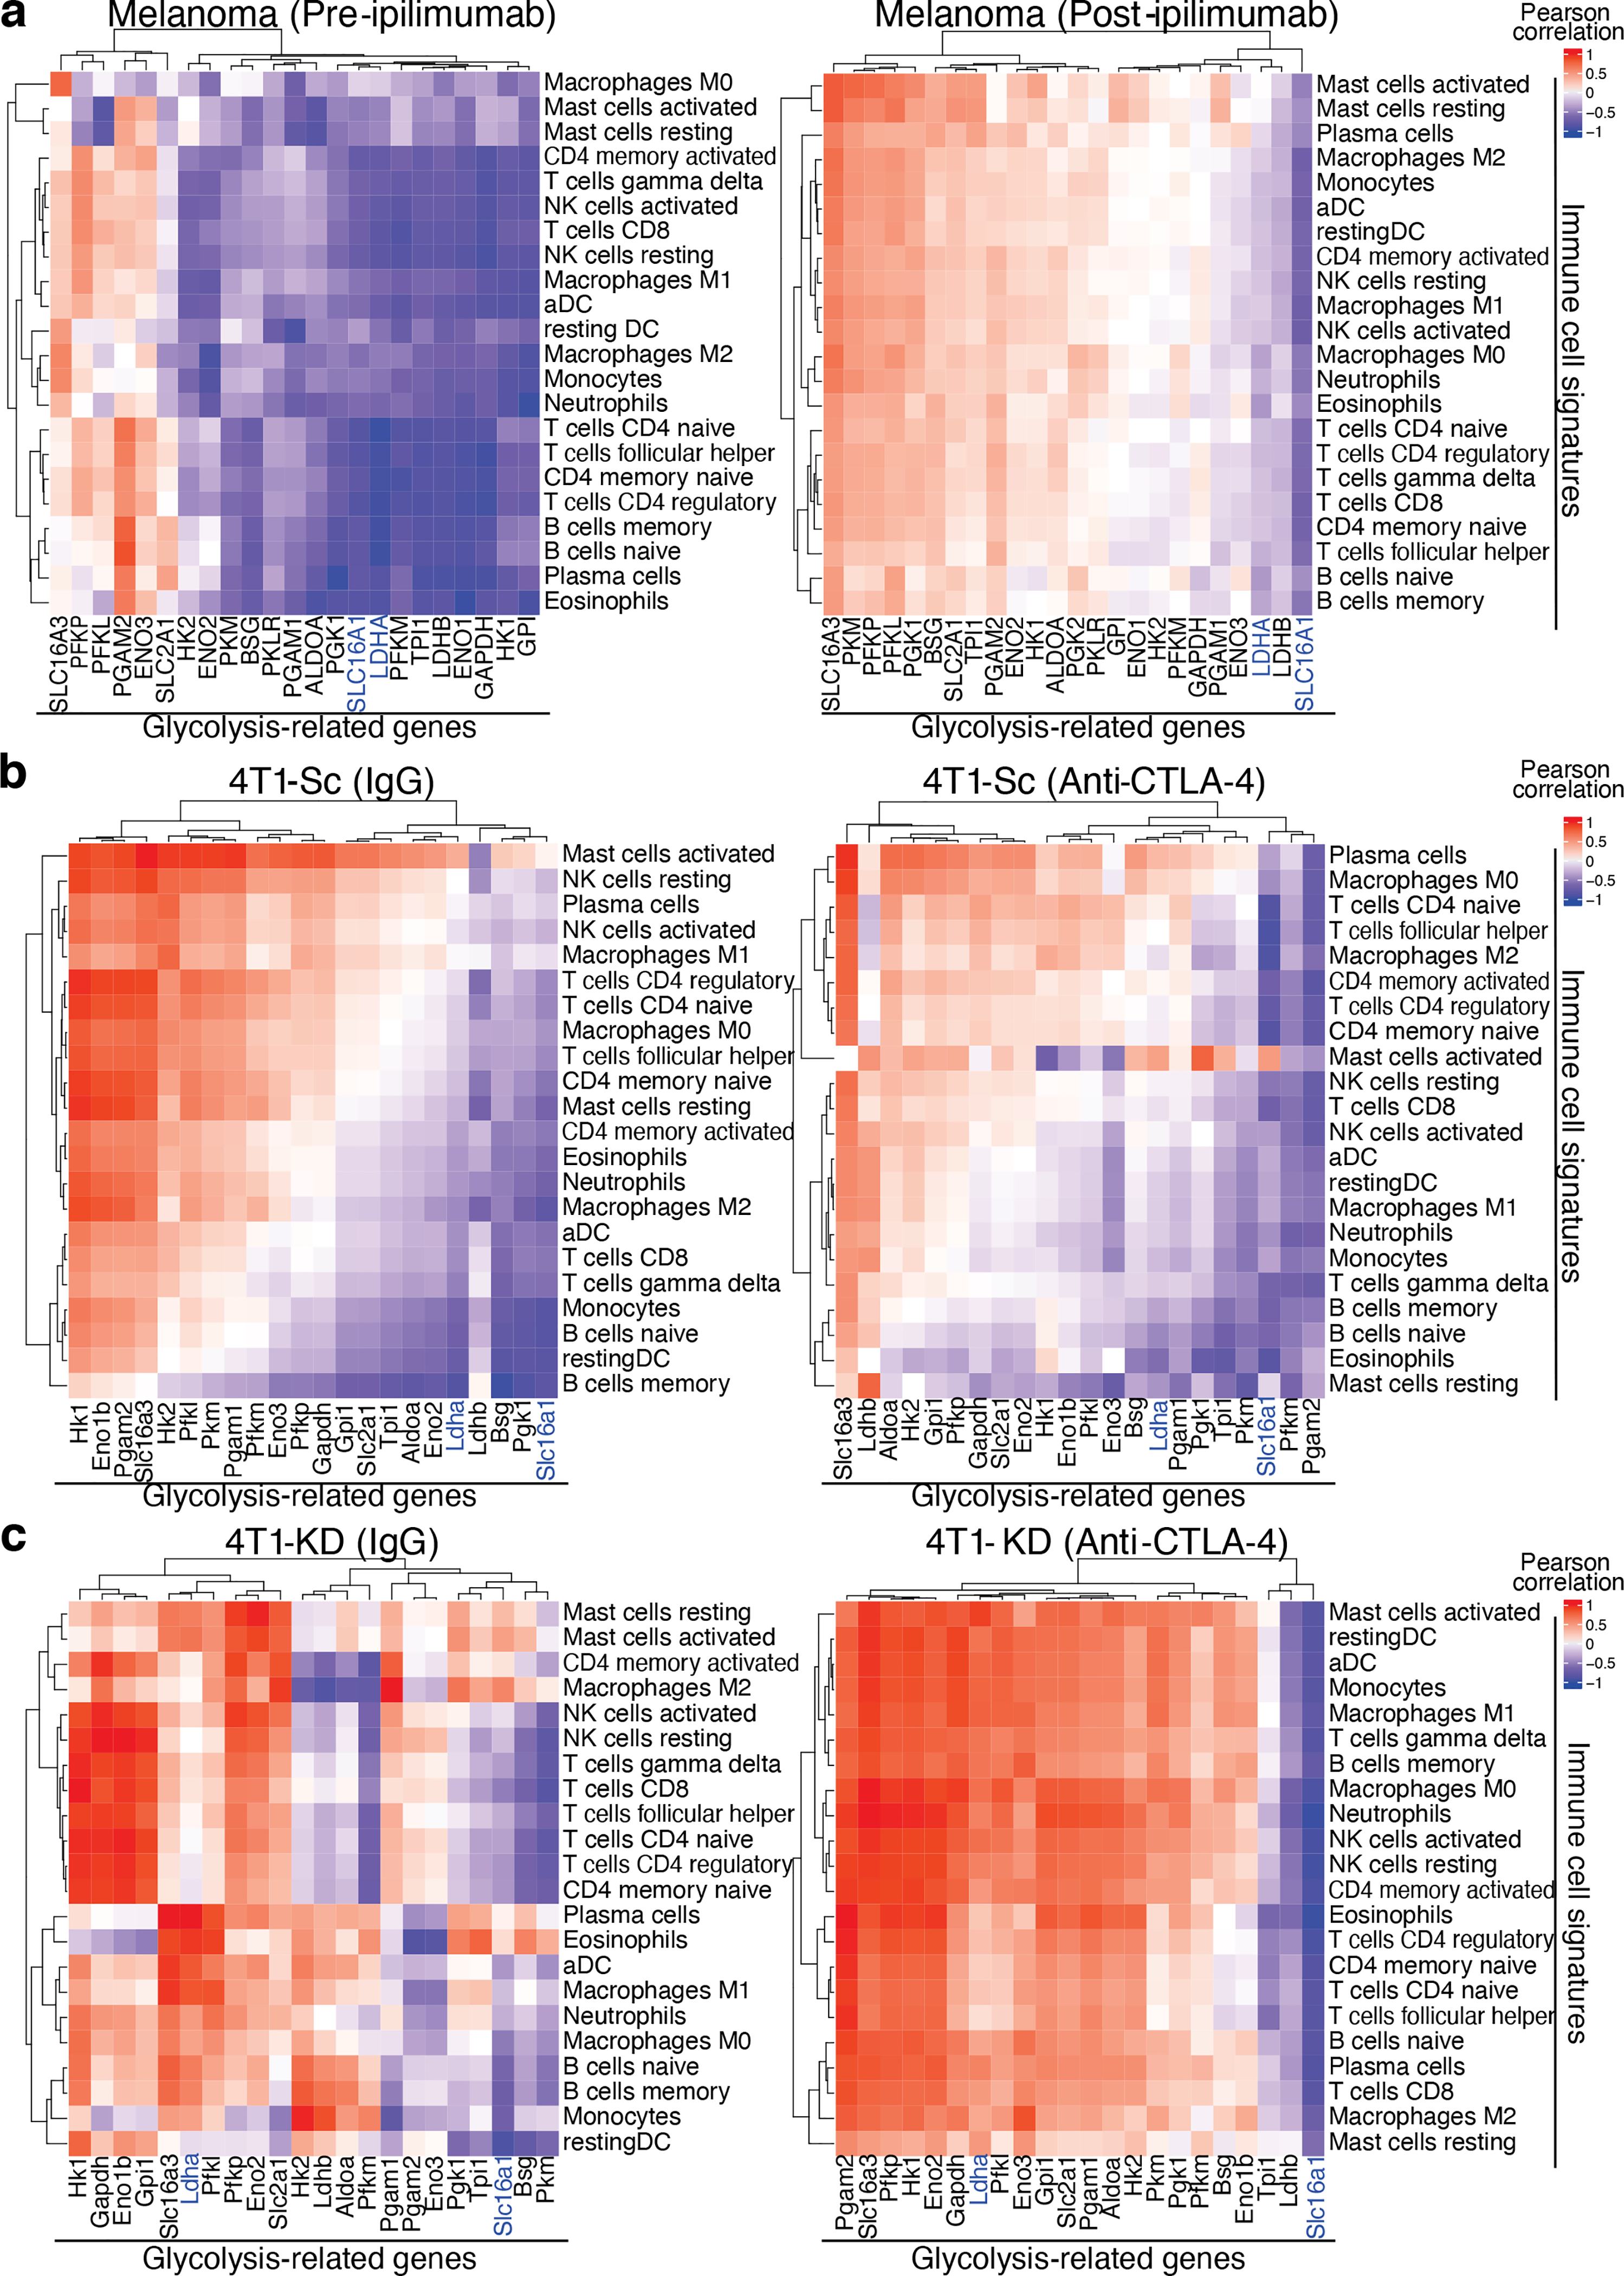
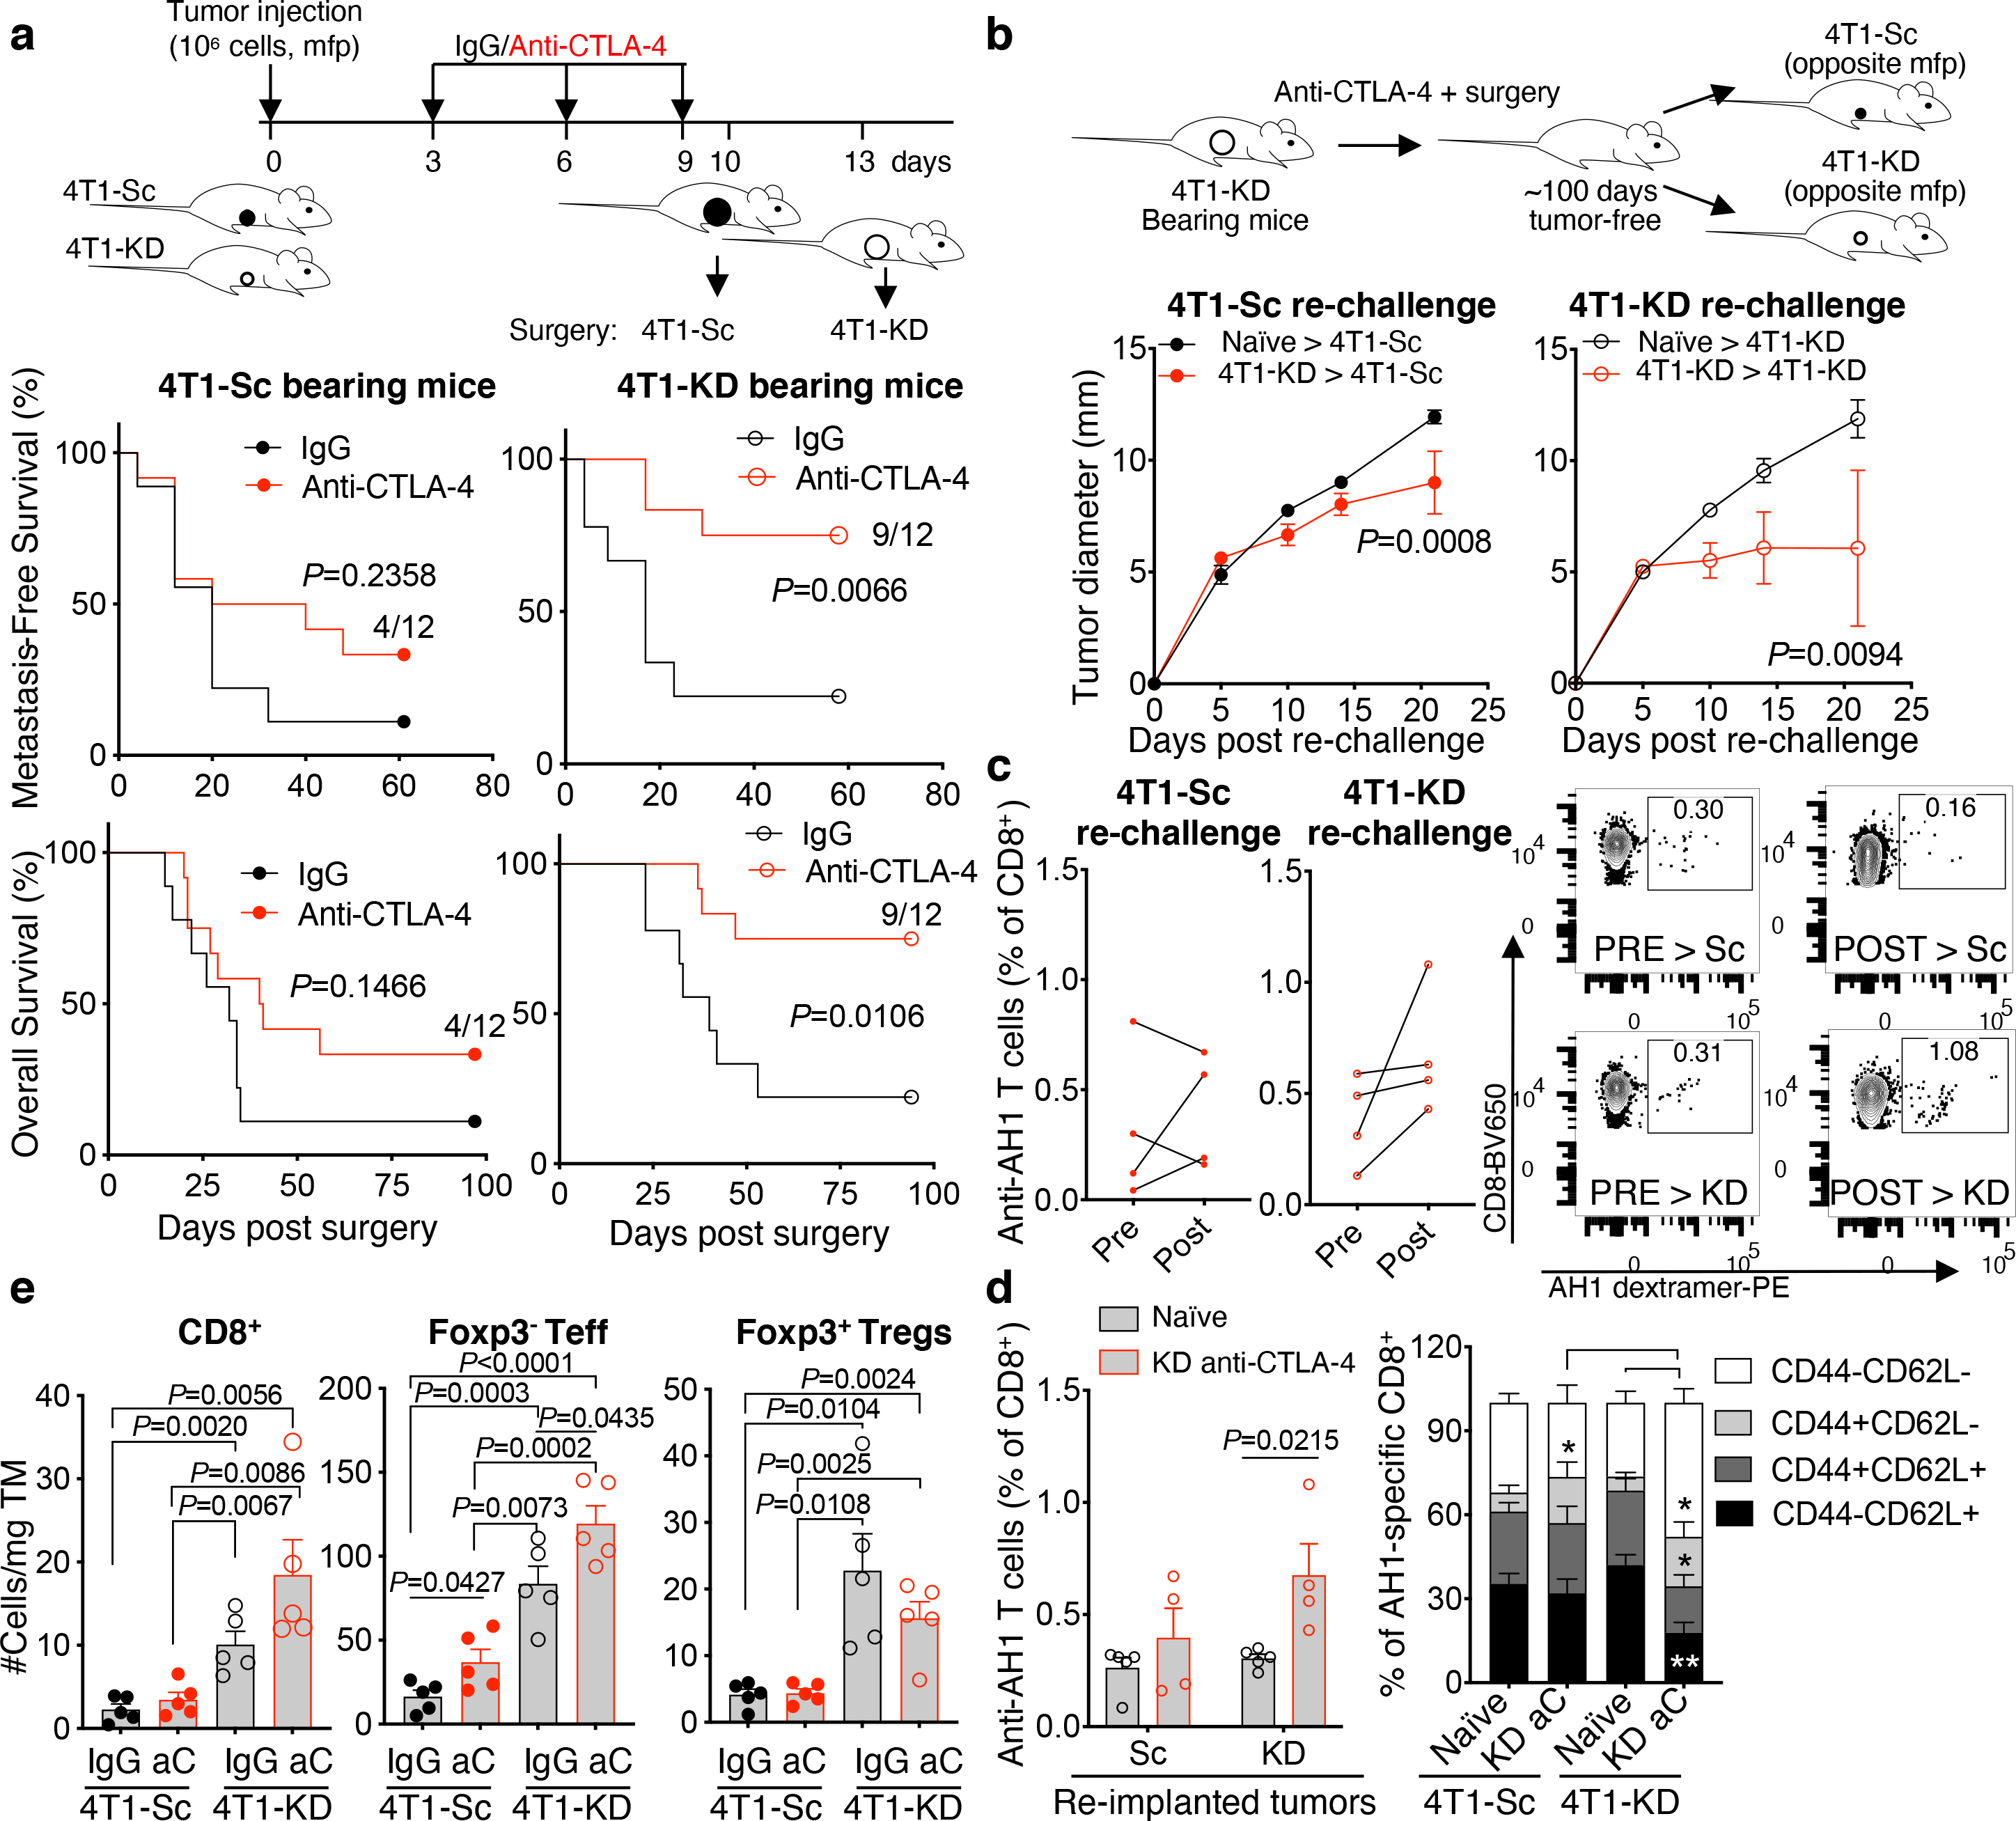
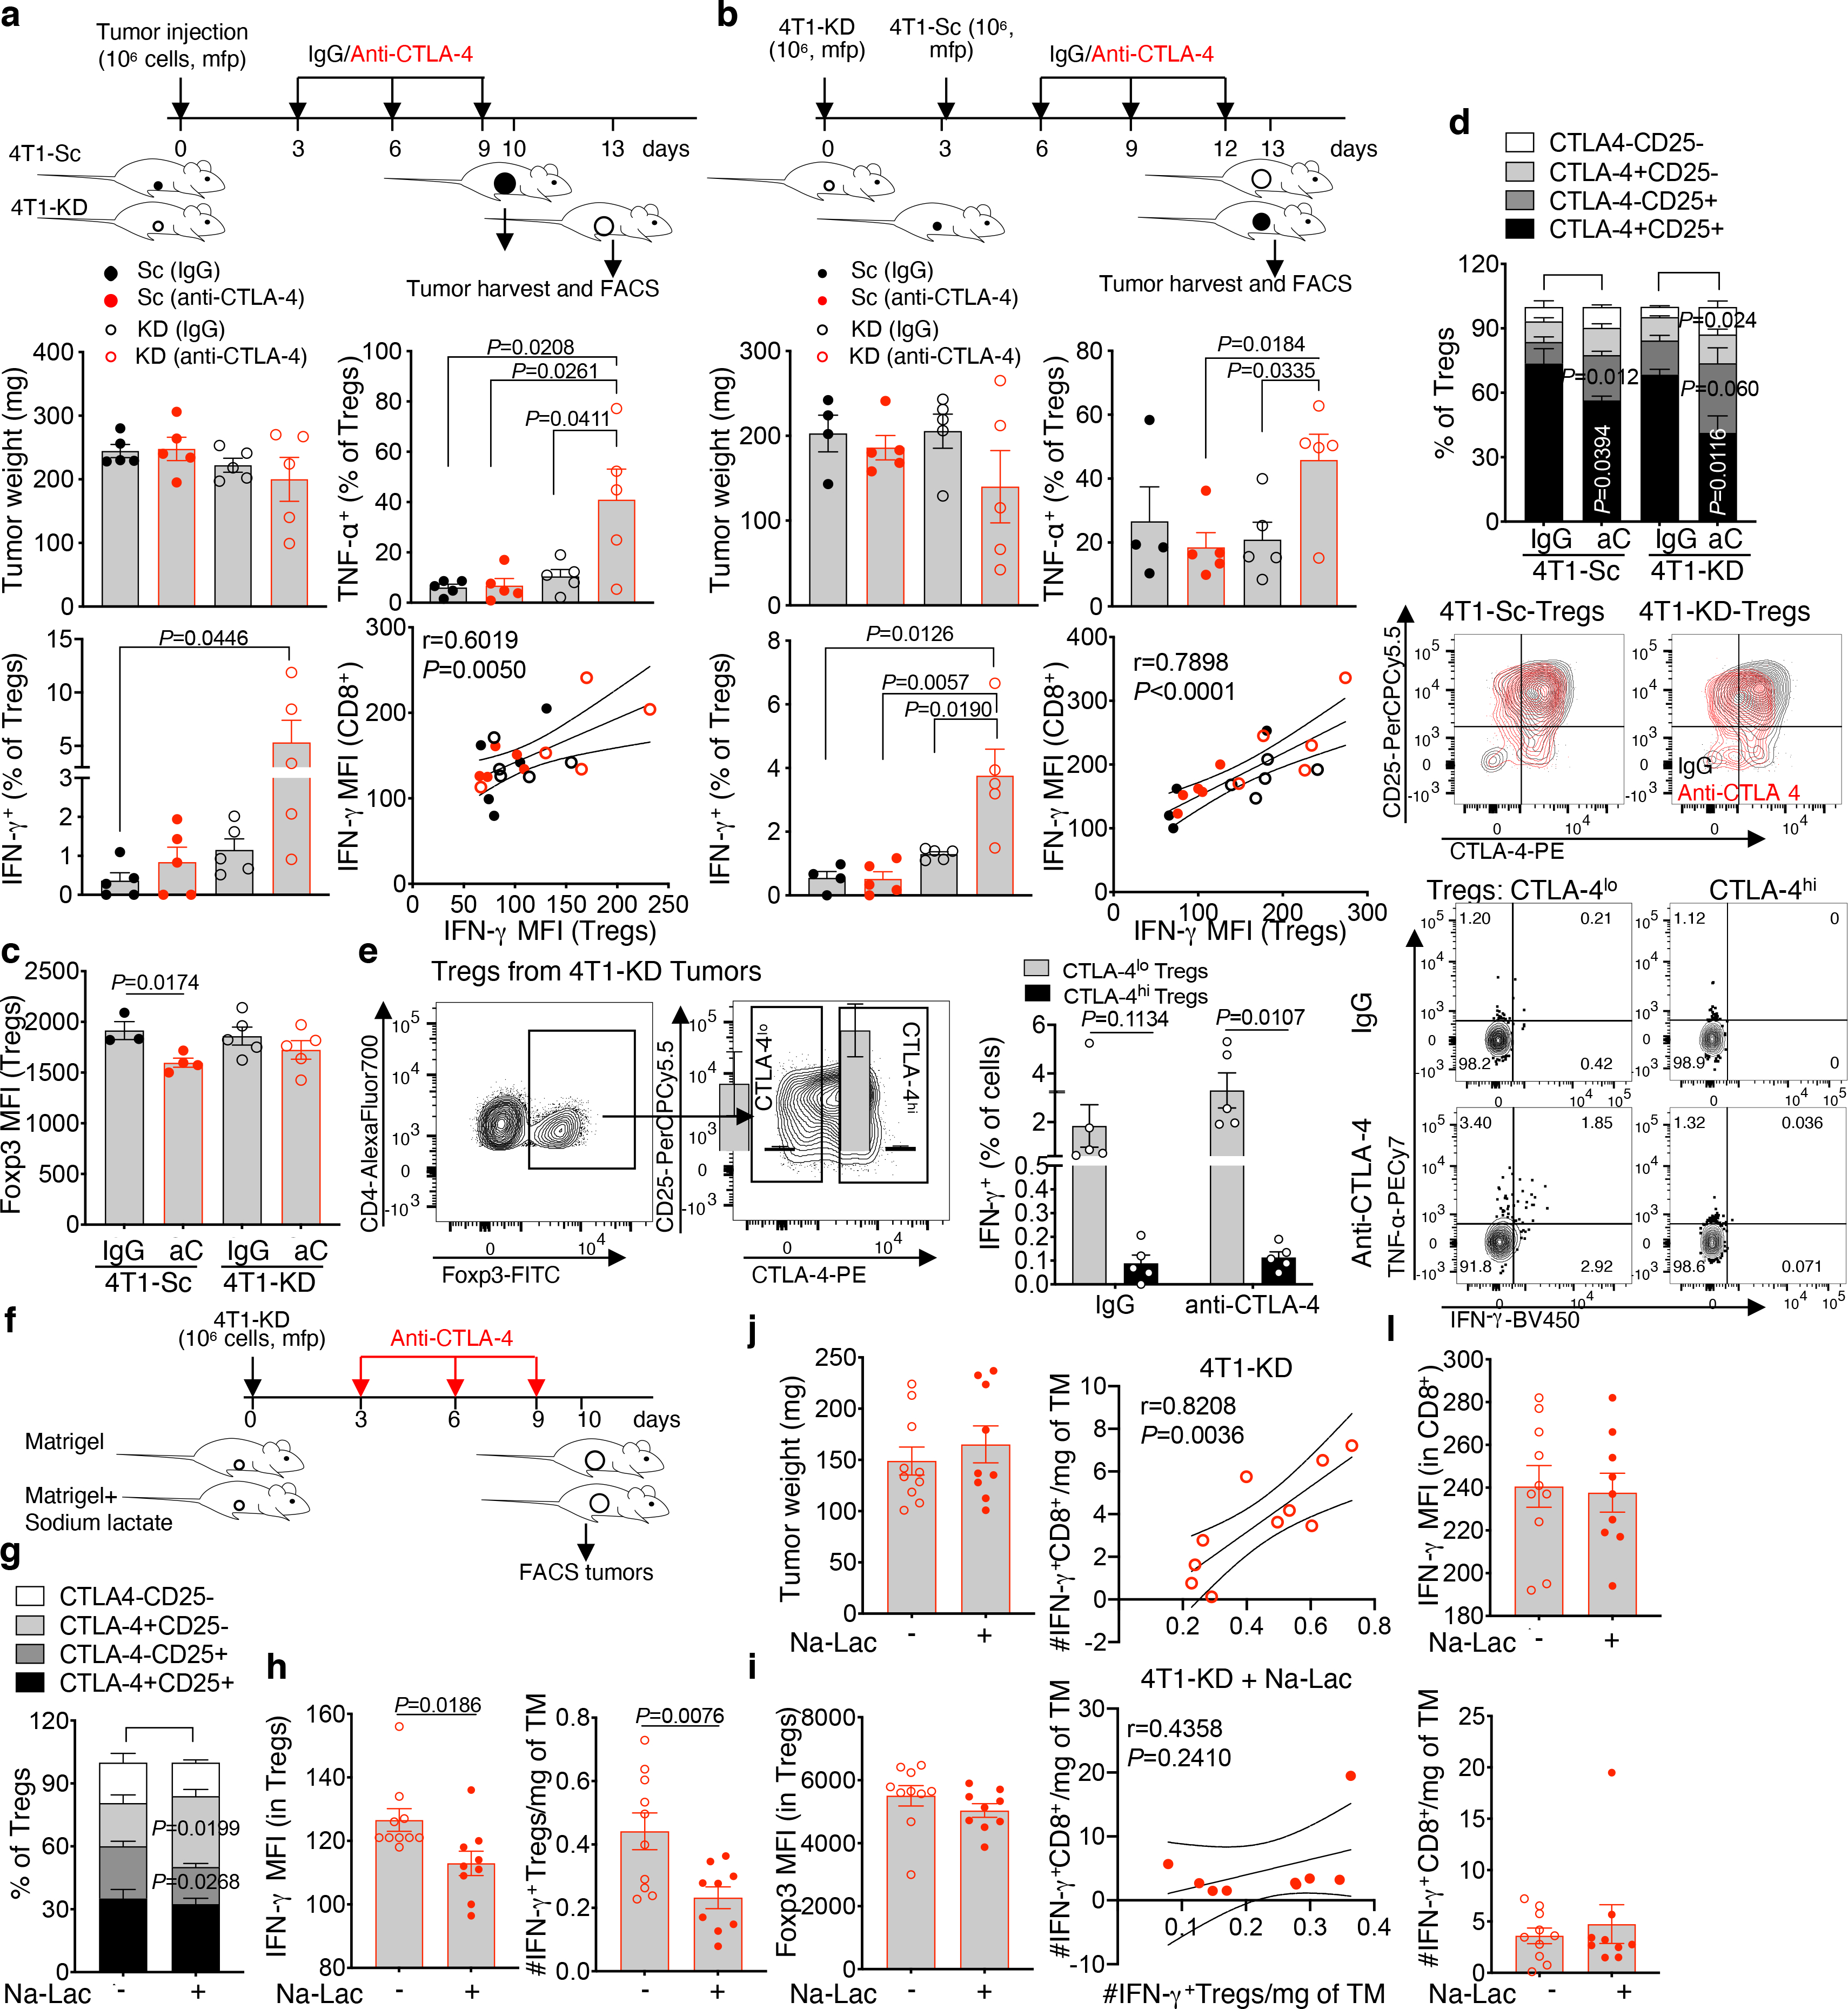
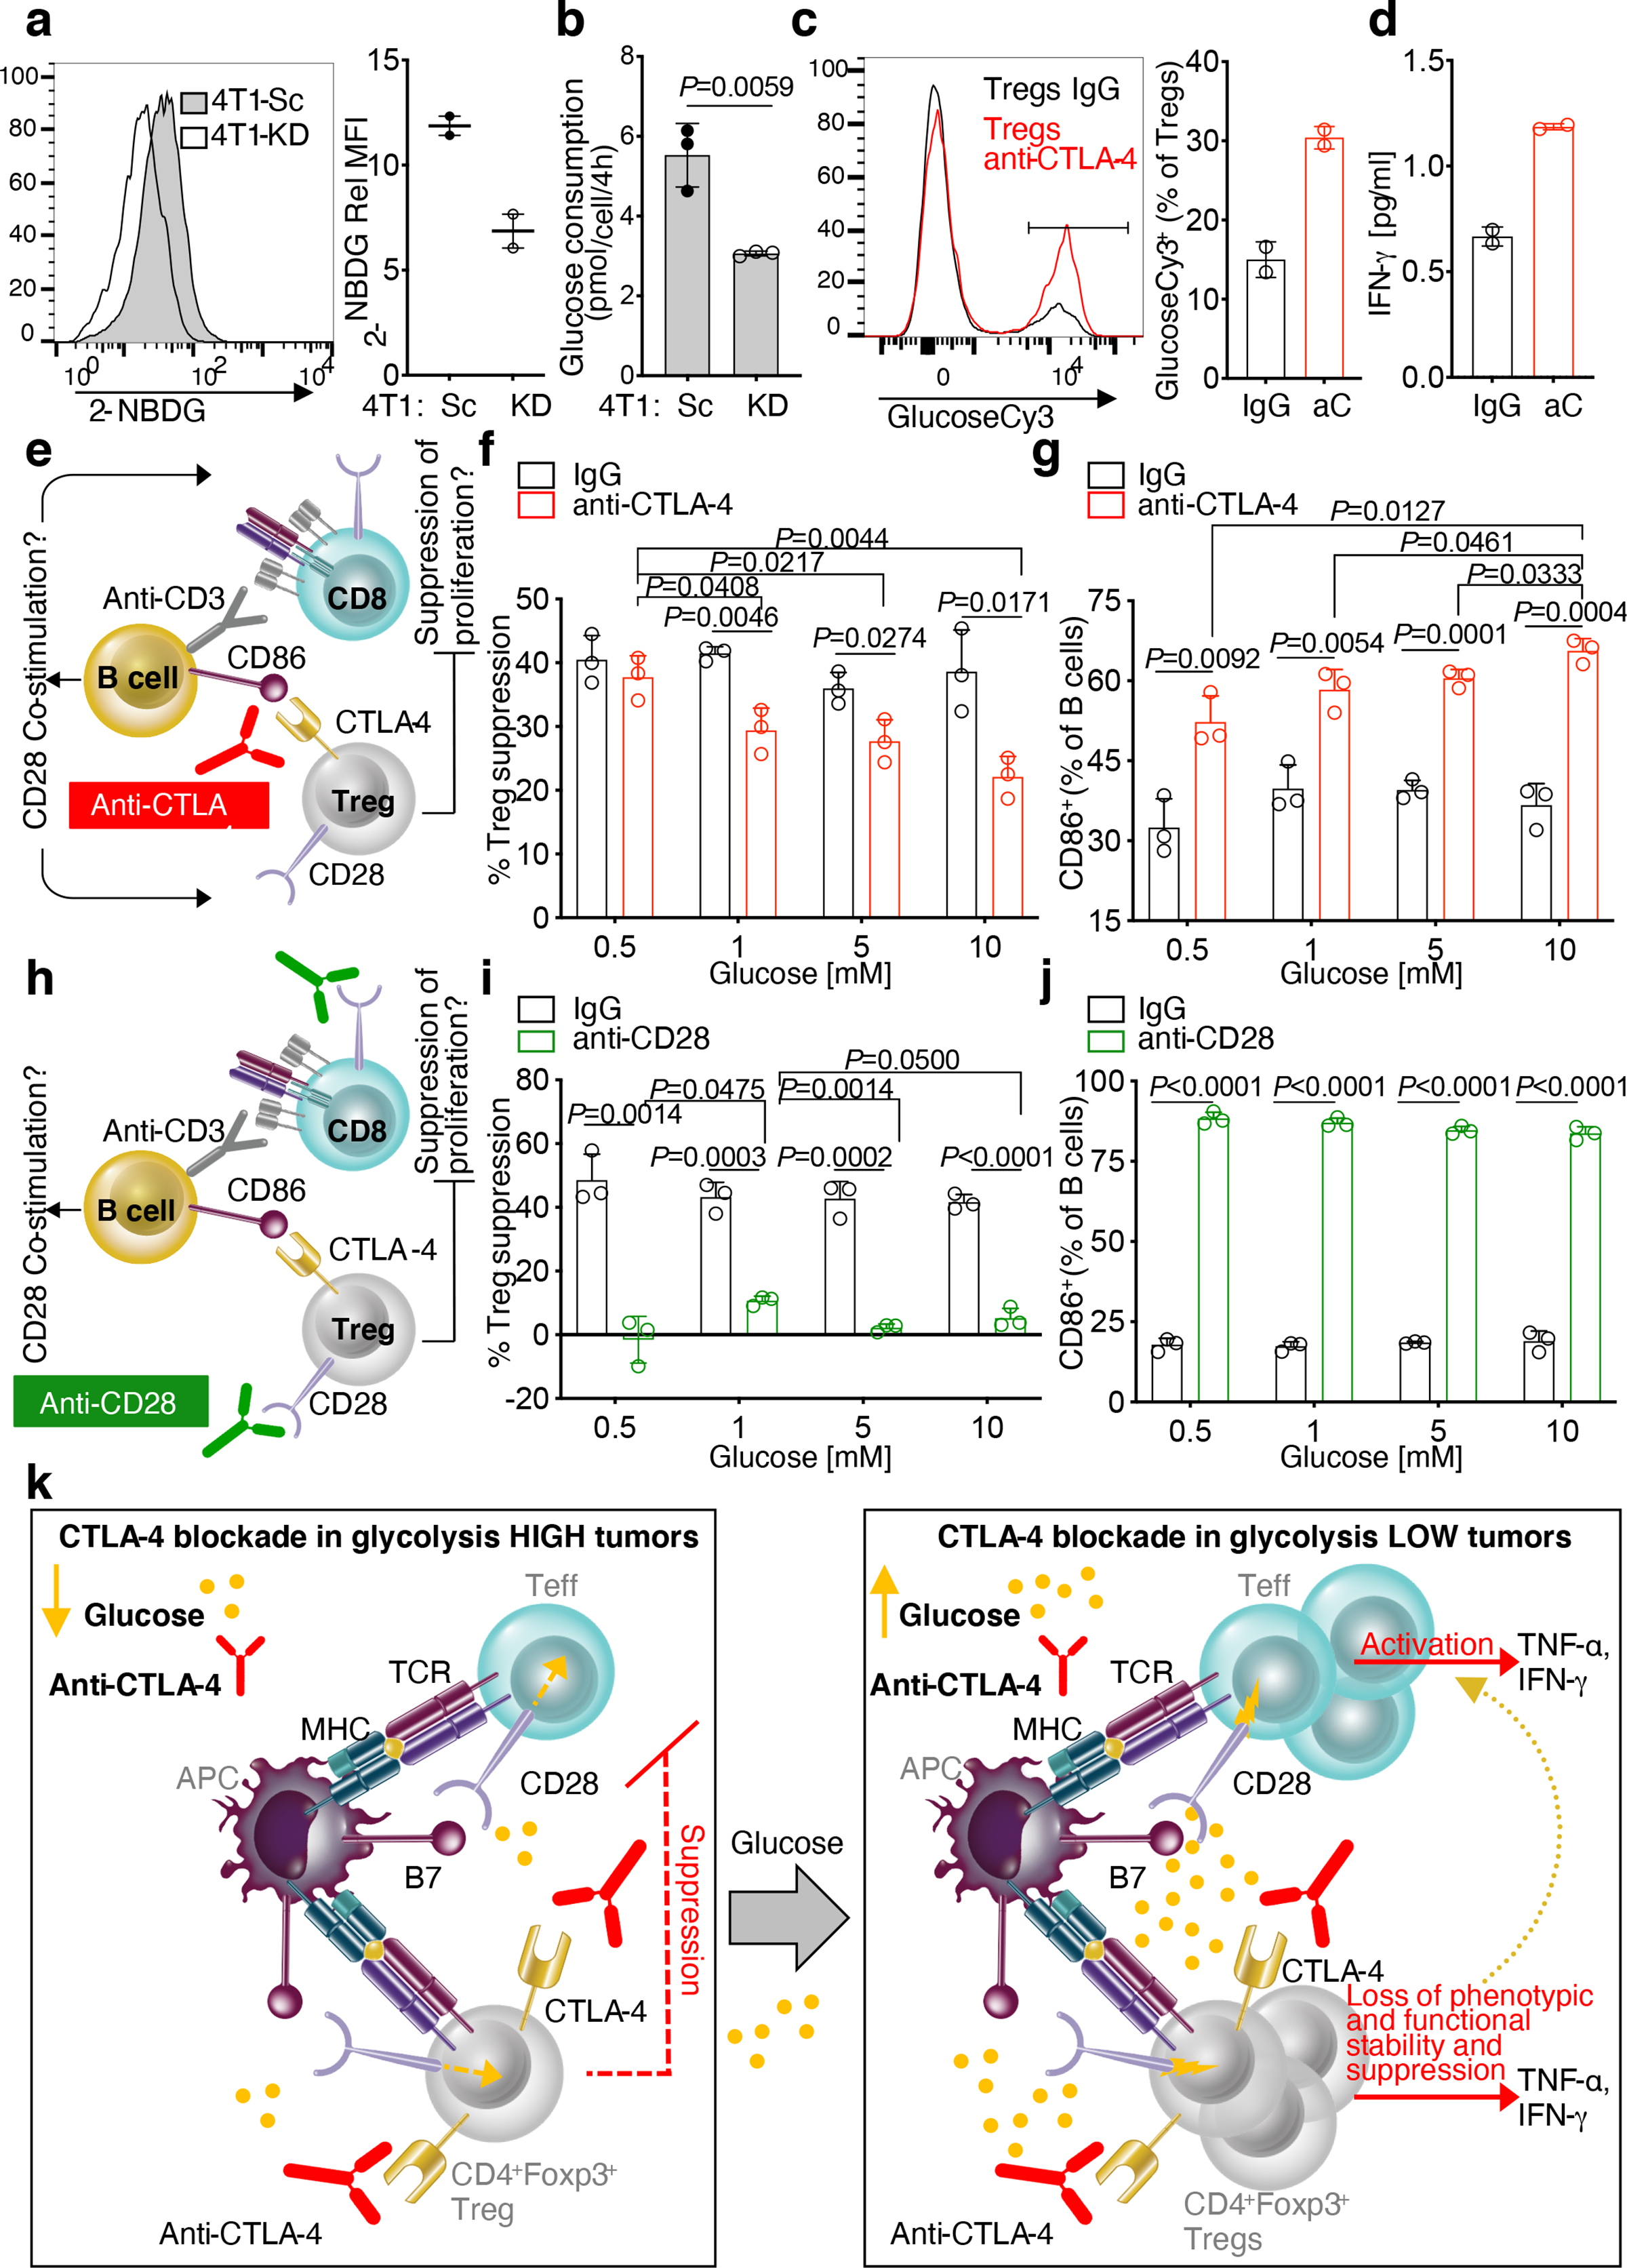
Limiting metabolic competition in the tumour microenvironment may increase the effectiveness of immunotherapy. Owing to its crucial role in the glucose metabolism of activated T cells, CD28 signalling has been proposed as a metabolic biosensor of T cells1. By contrast, the engagement of CTLA-4 has been shown to downregulate T cell glycolysis1. Here we investigate the effect of CTLA-4 blockade on the metabolic fitness of intra-tumour T cells in relation to the glycolytic capacity of tumour cells. We found that CTLA-4 blockade promotes metabolic fitness and the infiltration of immune cells, especially in glycolysis-low tumours. Accordingly, treatment with anti-CTLA-4 antibodies improved the therapeutic outcomes of mice bearing glycolysis-defective tumours. Notably, tumour-specific CD8+ T cell responses correlated with phenotypic and functional destabilization of tumour-infiltrating regulatory T (Treg) cells towards IFNγ- and TNF-producing cells in glycolysis-defective tumours. By mimicking the highly and poorly glycolytic tumour microenvironments in vitro, we show that the effect of CTLA-4 blockade on the destabilization of Treg cells is dependent on Treg cell glycolysis and CD28 signalling. These findings indicate that decreasing tumour competition for glucose may facilitate the therapeutic activity of CTLA-4 blockade, thus supporting its combination with inhibitors of tumour glycolysis. Moreover, these results reveal a mechanism by which anti-CTLA-4 treatment interferes with Treg cell function in the presence of glucose.


Conflict of interest statement

Competing interests

R.Z. is inventor on patent applications related to work on GITR, PD-1 and CTLA-4. R.Z. is consultant for Leap Therapeutics and iTEOS Belgium SA. Y.S. is currently employed in Genentech and holds equity in Roche. P.-C.H. received research support from Roche-pRED and honorarium from Chungai and Pfizer. P.-C.H. is also a scientific advisory board member of Elixiron Immunotherapeutics and Acepodia. G.M.D. consults for and/or is on the scientific advisory board of BlueSphere Bio, Century Therapeutics, Novasenta, Pieris Pharmaceuticals, and Western Oncolytics/Kalivir; has grants from bluebird bio, Novasenta, Pfizer, Pieris Pharmaceuticals, TCR2, and Kalivir; G.M.D. owns equity in BlueSphere Bio and Novasenta. T.M. is a cofounder and holds an equity in IMVAQ Therapeutics. T.M. is a consultant of Immunos Therapeutics, Pfizer and Immunogenesis. T.M. has research support from Bristol-Myers Squibb; Surface Oncology; Kyn Therapeutics; Infinity Pharmaceuticals, Inc.; Peregrine Pharmaceuticals, Inc.; Adaptive Biotechnologies; Leap Therapeutics, Inc.; and Aprea. T.M. has patents on applications related to work on oncolytic viral therapy, alpha virus-based vaccine, neo antigen modeling, CD40, GITR, OX40, PD-1, and CTLA-4. J.D.W. is consultant for Adaptive Biotech; Amgen; Apricity; Ascentage Pharma; Astellas; AstraZeneca; Bayer; Beigene; Boehringer Ingelheim; Bristol Myers Squibb; Celgene; Chugai; Eli Lilly; Elucida; F Star; Georgiamune; Imvaq; Kyowa Hakko Kirin; Linneaus; Merck; Neon Therapeutics; Polynoma; Psioxus; Recepta; Takara Bio; Trieza; Truvax; Sellas; Serametrix; Surface Oncology; Syndax; Syntalogic, Werewolf Therapeutics. J.D.W. reports grants from Bristol Myers Squibb and Sephora. J.D.W. has equity in Tizona Pharmaceuticals; Adaptive Biotechnologies; Imvaq; Beigene; Linneaus; Apricity; Arsenal IO; Georgiamune. J.D.W. is inventor on patent applications related to work on DNA vaccines in companion animals with cancer, assays for suppressive myeloid cells in blood, oncolytic viral therapy, alphavirus-based vaccines, neo-antigen modeling, CD40, GITR, OX40, PD-1 and CTLA-4. The other authors declare no competing interests.

Figures

Extended Data Figure 1.
Extended Data Figure 1.. Tumor glycolysis and immune cell function.
(a) Quantification of glucose and lactate by 1H NMR in supernatants from 72 h cultures of activated T cells (100K, 100,000 cells), 4T1 cells (3K, 3,000 cells) and the two cell types together. Plots show combined results from 2 independent experiments (n=2/experiment; mean ± SD; 2-sided unpaired t test). (b) Percent of proliferating (CFSElow, left) and (right) dead CD4+ or CD8+ T cells assessed by flow cytometry upon 48 h activation in the presence of the indicated concentrations of lactic acid to define the workable lactate dose range (n=3/condition, except for 0 μM lactic acid, n=2; mean ± SD). (c,d) Flow cytometry analysis of the indicated parameters in CD8+ and CD4+ T cells activated for 48 h in the presence or absence of 4T1 cells (c) or 10 mM lactate (d). Data show mean ± SD of 1 out of 2 independent experiments (n=3; mean ± SD; 2-sided unpaired t test). (e,f) Expression of immune cell signatures by CIBERSORT (top) and glycolysis-related genes (bottom) in RNAseq data sets from human melanoma samples at baseline (e, n=7) and after ipilimumab (f, n=15). Each column in the heatmaps represents an independent tumor sample. MFI, median fluorescence intensity.
Extended Data Figure 2.
Extended Data Figure 2.. LDHA-deficient tumor model for neoadjuvant CTLA-4 blockade treatment.
(a) Expression of LDHA and vinculin, as loading control, in 4T1-KD and 4T1-Sc whole cell protein extracts by western blot in 1 representative of 3 independent experiments. (b) Glycolytic Proton Efflux Rate (glycoPER) assessed by Seahorse XF Analyzer in 4T1-KD and 4T1-Sc cultures (n=20, mean ± SD; 2-way ANOVA with Bonferroni correction; Rot/AA, rotenone + antimycin A; 2-DG, 2-Deoxy-D-glucose). (c) In vivo growth of 4T1-KD and 4T1-Sc tumors orthotopically implanted in the mammary fat pad (mfp) of immunocompetent wild type (WT) and immunodeficient RAG2 knock out (KO) BALB/c mice (n=10 mice/group; mean ± SEM; 2-way ANOVA with Bonferroni correction; 1 representative of 2 independent experiments). (d) Growth of primary 4T1-Sc and 4T1-KD tumors in mice treated as in Figure 2a (left) and average tumor diameter on the day of tumor resection (right) (IgG, n=9; anti-CTLA-4, n=12; mean ± SEM). (e) LDHA activity in 4T1-Sc (n=4) and 4T1-KD (n=5) tumor extracts on the day of tumor resection after treatment as in (d) (mean ± SEM; 2-sided unpaired t test). (f) Tumor growth after a second injection with 4T1-Sc in 4T1-KD- and 4T1-Sc-bearing mice that survived neoadjuvant treatment with CTLA-4 blockade as in Figure 2a (n=4/group, except for naïve, n=5; mean ± SEM; 2-way ANOVA with Bonferroni correction). aC, anti-CTLA-4.
Extended Data Figure 3.
Extended Data Figure 3.. Neoadjuvant anti-CTLA-4 treatment schedule for same-day 4T1-Sc- and 4T1-KD-tumor resection.
Additional treatment schedule modified to harvest 4T1-Sc and 4T1-KD tumors for flow cytometry analysis on the same day. Separate groups of BALB/c mice were injected with 106 4T1-KD and 4T1-Sc cells 3 days apart and then treated with 3 cycles of anti-CTLA-4 or the matched isotype control (IgG) every 3 days (arrows, T=treatment) before surgery and flow cytometry analysis of tumor and tumor draining lymph node (DLN) samples. (a) Primary tumor growth and tumor weight on the day of surgery, showing similar tumor size across groups during treatment and on the day of surgery (n=5 mice/group; mean ± SEM; 1 representative of 2 independent experiments). (b) Overall survival of mice treated as in (a) (n=5 mice/group; log rank test). (c) Frequency of the indicated T cell subsets among total CD45+ leukocytes in tumors and DLNs from the indicated treatment groups (n=5 mice/group except for 4T1-Sc IgG, n=4; mean ± SEM; 2-sided unpaired t test). (d) Frequency of CD11b+ myeloid cell subsets among total CD45+ leukocytes, M1 and M2 macrophages according to MHC-II and CD206 staining among total CD11b+F4/80+ macrophages, and Gr1+ granulocyte subsets among total CD11b+ myeloid cells in 4T1-Sc and 4T1-KD tumors as well as DLNs from mice treated as indicated (n=5 mice/group except for 4T1-Sc IgG, n=4; mean ± SEM; 2-sided unpaired t test). Representative plots showing the flow cytometry gating strategy for M1 and M2 macrophages and granulocytes (granulo) are reported. Data show results from 1 representative of at least 2 independent experiments. * = P<0.05.
Extended Data Figure 4.
Extended Data Figure 4.. Selective loss of Treg functional stability in LDHA-deficient tumors treated with CTLA-4 blockade.
(a) Representative gating strategy for tumor-infiltrating CD8+, CD4+Foxp3 Teff and CD4+Foxp3+ Tregs, where expression of IFN-γ and TNF-α was assessed. (b) Representative flow cytometry plots showing IFN-γ and TNF-α expression in Tregs, Teff and CD8+ TILs gated as in (a) from 4T1-Sc- and 4T1-KD-bearing BALB/c mice treated as in Figure 3a. (c,d) Quantification of TNF-α and IFN-γ expression in CD4+Foxp3 Teff and CD8+ TILs from 4T1-Sc- and 4T1-KD-bearing BALB/c mice treated as in Figure 3a (c; n=5 mice/group) and 3b (d; n=5 mice/group except for 4T1-Sc IgG, n=4) (mean ± SEM; 2-sided unpaired t test). (e) Quantification of IFN-γ and TNF-α expression in CD8+ T cells, CD4+Foxp3 Teff and Tregs from DLNs of 4T1-Sc- and 4T1-KD-bearing BALB/c mice treated as in Figure 3b (n=5 mice/group except for 4T1-Sc IgG, n=4; mean ± SEM; 2-sided unpaired t test). (f) Quantification and representative plots of CTLA-4 expression by flow cytometry in CD8+ T cells, CD4+Foxp3 Teff and Tregs from tumor and DLN samples of 4T1-Sc and 4T1-KD tumor-bearing mice (n=5 mice/group, mean ± SEM; 2-sided paired t test). Data show results from 1 representative of at least 2 independent experiments.
Extended Data Figure 5.
Extended Data Figure 5.. Treg destabilization and CD8+ TIL activation in additional LDHA-deficient tumor models treated with CTLA-4 blockade.
(a-e) Primary tumor growth and overall survival, reporting the number of tumor-free mice at the end of the experiment, in BALB/c mice implanted in the mfp with the LDHA-KD 4T1 A3–8KD cell line (106 cells/mouse) treated with neoadjuvant anti-CTLA-4 (n=9) or IgG control (n=10), as indicated. CTLA-4 and CD25 in tumor-infiltrating Tregs (b), quantification of Tregs and CD8+ TILs as well as expression of the indicated markers by flow cytometry (c), and (d) flow cytometry analysis of IFN-γ expression in CTLA-4lo and CTLA-4hi tumor-infiltrating Tregs from mice treated as in (a) (mean ± SEM; CTLA-4lo vs. CTLA-4hi Tregs, 2-sided paired t test; IgG vs. anti-CTLA-4 CTLA-4lo Tregs, 2-sided unpaired t test). (e) Pearson correlation analyses of indicated parameters in Tregs and CD8+ TILs from mice treated as in (a) (black, IgG; red, anti-CTLA-4). n=1 experiment with n=9–10 mice/group. (f-j) 4T1-KD-bearing BALB/c mice were treated with the standard IgG2b 9D9 anti-CTLA-4 antibody (n=10) or its IgG2a variant (n=9) or IgG control (n=10) as indicated in (f) and overall survival (log-rank test) (g), quantification of CTLA-4 and GITR expression in Tregs (h), and (i) tumor-infiltrating Tregs and their expression of Foxp3 and IFN-γ by flow cytometry are shown (mean ± SEM; 2-sided unpaired t test). (j) Pearson correlation analyses between indicated parameters in Tregs and CD8+ TILs from mice treated as in (f). n=1 experiment with 9D9 IgG2a. (k-m) LDHA protein expression by western blot (k), (l) LDH activity, and (m) glycolytic proton efflux rate (GlycoPER) by Seahorse analysis in B16-KD vs. B16-Sc cells (n=3, mean ± SD; 2-sided unpaired t test; 1 representative of 2–3 independent experiments). (n-p) C57BL/6J mice were implanted with B16-KD and B16-Sc tumors and treated with anti-CTLA-4 or IgG control as indicated in (n). Quantification of CTLA-4 and CD25 (o; n=5/group except for B16-KD IgG, n=4) and (p) IFN-γ expression in tumor-infiltrating Tregs by flow cytometry (B16-Sc IgG, n=4; B16-Sc anti-CTLA-4, n=6; B16-KD IgG, n=4; B16-KD anti-CTLA-4, n=3; mean ± SEM; 2-sided unpaired t test; 1 representative of 2 experiments). TM, tumor; GzmB, granzyme B; i.d., intradermal.
Extended Data Figure 6.
Extended Data Figure 6.. In vivo Treg response to tumor glucose metabolism and CTLA-4 blockade.
LDHA protein expression by western blot in 1 representative of 3 independent experiments (a) and (b) LDH activity in 4T1-KD vs. 4T1-EtBr cells in comparison with control 4T1-Sc cells (n=3, mean ± SD), and (c) complete cell energetic map with mitochondrial and glycolytic production rates in the indicated 4T1 cell variants using a real-time ATP rate assay by Seahorse (Sc and EtBr, n=22; KD and A3–8KD, n= 24; mean ± SD) in 1 representative of 2 independent experiments (2-sided unpaired t test). (d-g) BALB/c mice (n=5/group) were orthotopically implanted with 106 4T1-KD or 4T1-EtBr cells and tumors were surgically resected 13 days later (d). Overall survival and number of surviving mice out of total (d). Frequency of Foxp3+ Tregs among tumor-infiltrating CD4+ T cells (e), CD25 and CTLA-4 (f) and IFN-γ expression (g) in intra-tumor Tregs by flow cytometry. Mean ± SEM; 2-sided unpaired t test; 1 representative of 2 independent experiments. (h) Schematic representation of anti-CTLA-4 or control IgG treatment in BALB/c mice implanted with 4T1-Sc and 4T1-KD in opposite mfp, and tumor weight on day 13 for samples analyzed in (i,j). (i) GlucoseCy3 staining by flow cytometry in CD45 tumor cells gated as indicated to enrich in live CD45 tumor cells by comparing CD45 and DAPI staining between tumor and spleen samples from mice treated as in (h). (j) GlucoseCy3 staining by flow cytometry in Tregs gated based on surface staining of CD4, CD25 and GITR in tumor samples as in (h). (h-j) 4T1-Sc, n=4 (1 tumor sample in each treatment group was contaminated by DLN and was excluded); 4T1-KD, n=5; mean ± SEM; 2-sided unpaired t test; n=1 experiment. (k) In vitro glucose consumption by B16-Sc vs. B16-KD cells, and (I,m) ex vivo glucose uptake potential by flow cytometry analysis of glucoseCy3 staining of CD45 tumor cells (l) and intra-tumor Foxp3-GFP+ Tregs (m) from B16-Sc- and B16-KD-bearing Foxp3-GFP transgenic C57BL/6J mice treated with anti-CTLA-4 (n=3, mean ± SD; 2-sided unpaired t test; 1 representative of 2 independent experiments).
Extended Data Figure 7.
Extended Data Figure 7.. Ex vivo and in vitro Treg response to tumor glucose metabolism and CTLA-4 blockade.
(a,b) Foxp3-GFP transgenic (Tg) mice were implanted with B16-Sc or B16-KD cells and treated with anti-CTLA-4 as indicated in (a) and tumor-infiltrating Foxp3-GFP+ Tregs were FACS-sorted and tested in ex vivo suppression assays with CellTrace Violet (CTV)-labeled CD8+ T cells activated with anti-CD3 in the presence of 0.5 or 10 mM glucose (b). (b) Flow cytometry of CD44 and CD25 expression in CD8+ T cells cultured with B16-Sc- vs. B16-KD-derived Tregs (top) and (bottom) quantification of proliferation (CTV dilution by CTV MFI) of dividing CTVlo CD8+ T cells and Treg suppression of CD8+ T-cell proliferation in the same culture conditions (n=3, mean ± SD; 2-sided unpaired t test; 1 representative of 2 independent experiments). (c) Quantification by flow cytometry of IFN-γ and TNF-α expression in Tregs co-cultured with 4T1-Sc or 4T1-KD cells in 5 mM glucose RPMI1640 for 24 h in the presence of soluble anti-CD3, IL-2 and anti-CTLA-4 (n=3, mean ± SD; 2-sided unpaired t test; n=1 experiment). (d) Glucose consumption and lactate production by NMuMg benign mammary gland cell line vs. 4T1 cells (n=6, mean ± SD; 2-sided unpaired t test; n=1 experiment with NMuMg). (e) Quantification by flow cytometry of IFN-γ and TNF-α expression in Tregs cultured for 48 h with 4T1-Sc, 4T1-KD- or NMuMg-conditioned media (11 mM glucose complete RPMI1640) in the presence of plate-bound anti-CD3, IL-2 and anti-CTLA-4 or an IgG control (n=3, mean ± SD; 2-sided unpaired t test; n=1 experiment). * = P<0.05; ** = P<0.01; *** = P<0.001.
Extended Data Figure 8.
Extended Data Figure 8.. Loss of Treg functional stability induced by anti-CTLA-4 depends on Treg glycolysis and CD28 signaling.
(a) Quantification and representative plots of GlucoseCy3 staining by flow cytometry of Tregs activated as in Figure 4c in the presence of 10 mM glucose ± rotenone/antimycin A (Rot/AA) or oligomycin (Oligo) and treated with anti-CTLA-4 or IgG control (average of 2 biological replicates/condition; 1 representative of 2 independent experiments). (b) Foxp3 expression by flow cytometry and IL-10 production by Luminex-based bead immunoassay in Tregs activated in the presence of 10 mM glucose ± Rot/AA or Oligo (n=3, mean ± SD; 2-sided unpaired t test; 1 representative of 3 independent experiments). (c,d) Representative plots of in vitro assays reported in Figure 4f,g. Representative proliferation (CellTraceViolet dilution) by flow cytometry of activated CD8+ T cells cultured alone or in the presence of Tregs at the indicated glucose concentrations and treated with anti-CTLA-4 or an IgG control (c). (d) Representative CD86 staining by flow cytometry on B cells from co-cultures with CD8+ T cells and Tregs treated as in (c). (e) In vitro suppression assay with CD25hi Tregs immunomagnetically purified from spleens of naïve WT or CD28 KO mice cultured for 48 h with CellTraceViolet-labeled CD8+ T cells and B cells and activated with anti-CD3 in the presence of anti-CTLA-4 or IgG control and the indicated glucose concentrations (n=3/conditions except for “+CD28 KO Tregs” at 1–10 mM glucose, n=2; mean ± SD; 2-sided unpaired t test; 1 representative of 2 independent experiments).
Extended Data Figure 9.
Extended Data Figure 9.. CD28 agonism and CTLA-4 blockade, but not PD-1 blockade, drive loss of Treg functional stability.
(a,b) Representative flow cytometry plots of in vitro assays reported in Figure 4i,j. Representative proliferation (CellTraceViolet dilution) by flow cytometry of activated CD8+ T cells cultured alone or in the presence of Tregs at the indicated glucose concentrations and treated with anti-CD28 (2 μg/ml) or IgG control (a). (b) Representative CD86 staining by flow cytometry on B cells from co-cultures with CD8+ T cells and Tregs treated as in (a). (c) Proliferation of CD8+ T cells cultured alone or with Tregs in 0.5 mM (gray) or 10 mM glucose (black) and activated with increasing concentrations of anti-CD28 (0–0.2 μg/ml) from 1 of 2 independent experiments (n=3, mean ± SD; 2-sided unpaired t test). (d) Quantification and representative plots showing suppression of CD4+ T-cell proliferation (left) and CD86 expression on B cells (right) by flow cytometry in culture with Tregs treated with anti-CTLA-4, anti-PD-1 or an IgG control in complete RPMI1640 containing 11 mM glucose. Percent suppression was calculated relative to proliferation of CD4+ T cells cultured alone in the same treatment conditions (n=3; mean ± SD; 2-sided unpaired t test; n=1 experiment with anti-PD-1). (e) Suppression of proliferation of CD8+ T cells cultured at the indicated ratios with Foxp3-GFP+PD-1+ Tregs (top) or Foxp3-GFP+PD-1 Tregs (bottom) FACS-sorted from spleens of naïve Foxp3-GFP mice and incubated with anti-PD-1 or IgG control for 48 h (representative results from 1 experiment conducted with CD8+ and CD4+ as target T cells with similar results). (f) Quantification and representative plots of GlucoseCy3 staining by flow cytometry in Tregs activated as in Figure 4c and treated with anti-PD-1 or IgG control (n=3, mean ± SD; 1 representative of 2 independent experiments). (g) Flow cytometry quantification and phenotypic analysis of Tregs from 4T1-KD tumors treated with anti-CTLA-4, anti-PD-1 or IgG control as indicated (n=10 mice/group, mean ± SEM; 2-sided unpaired t test; 1 representative of 2 independent experiments). ** = P<0.01; *** = P<0.001.
Extended Data Figure 10.
Extended Data Figure 10.. Limiting Treg glucose metabolism prevents anti-CTLA-4-mediated Treg destabilization in glycolysis-defective tumors.
(a) Foxp3GFP-Cre-ERT2;Slc2a1(Glut1)fl/fl (cKO) and Foxp3GFP-Cre-ERT2 control mice (ctrl) were implanted with B16-KD cells and treated with anti-CTLA-4 or IgG after induction of Glut1 deletion with tamoxifen as indicated. Tamoxifen treatment was continued throughout the treatment duration. (b) Slc2a1(Glut1) mRNA quantification relative to beta actin in Foxp3-GFP Teff and Foxp3-GFP+ Tregs from the spleens of ctrl and Glut1 cKO mice at the end of treatment as in (a) (n=3; mean ± SD, 2-sided unpaired t test). (c,d) Flow cytometry analysis of CD25 and CTLA-4 (c; n=3 except for ctrl IgG, n=1), and IFN-γ and TNF-α expression (d; n=2) in tumor-infiltrating Tregs from mice treated as in (a) (mean ± SEM; 2-sided unpaired t test; 1 representative of 2 independent experiments). (e) Ex vivo suppression assay with Tregs sorted from the spleens of ctrl and Glut1 cKO mice treated with anti-CTLA-4 as in (a). Treg suppression of CD8+ T-cell expansion after 48 h co-culture in 10 mM glucose and representative flow cytometry plot showing CTV proliferation and generation (G) overlay of CD8+ T cells cultured alone (gray) or in the presence of ctrl (black) or Glut1 cKO (red) Tregs (n=3; mean ± SD; 2-sided unpaired t test; 1 representative of 2 independent experiments). (f-l) Foxp3YFP-Cre;Slc2a1(Glu1)fl/+ (Glut1 HET) or Foxp3YFP-Cre;Ldhafl/fl (Ldha cKO) and Foxp3YFP-Cre mice (ctrl) were implanted with B16-KD cells and treated with anti-CTLA-4 (f). (g) Slc2a1(Glut1) mRNA quantification relative to beta actin in Foxp3-GFP+ Tregs from spleens of ctrl and Glut1 HET mice (n=2; mean ± SD). (h,i) Quantification by flow cytometry of intra-tumor Tregs (h) and their expression of Ki67 (i) in ctrl and Glut1 HET mice treated as in (f) (ctrl, n=4; HET, n=2; mean ± SEM; 2-sided unpaired t test; 1 representative of 2 independent experiments with mice carrying Glut1 HET or cKO Tregs). (j) Ldha mRNA quantification relative to beta actin in Foxp3-GFP+ Tregs from spleens of ctrl and Ldha cKO mice (n=3; mean ± SD; 2-sided unpaired t test). (k,l) Quantification by flow cytometry of intra-tumor Tregs (k) and their expression of Ki67 (l) in ctrl or Ldha cKO mice treated as in (f) (ctrl, n=3; Ldha cKO, n=2; mean ± SEM, 2-sided unpaired t test; 1 representative of 2 independent experiments). (m) Schematic representation of the culture conditions used in (n,o). CD5+ T cells from Ldha cKO or ctrl mice were co-cultured for 48 h with CD45.1+ congenic APCs (either B cells or T-cell depleted splenocytes) as scaffold for soluble anti-CD3 crosslinking in low (0.5 mM) or higher (10 mM) glucose concentrations as indicated. (n) Quantification by flow cytometry of Ldha cKO or ctrl Foxp3+CD4+ Tregs and their expression of Ki67 after activation as in (m). (o) Foxp3 and CTLA-4 expression by flow cytometry (MFI) in Ki67-negative Ldha cKO or ctrl Tregs from cultures as in (m). Ctrl 0.5 mM glucose, n=3 except for anti-CD28, n=2; ctrl 10 mM glucose, n=3; cKO, n=4; mean ± SD, 2-sided unpaired t test; 1 representative of 2 independent experiments. ** = P<0.01; *** = P<0.001. aCTLA-4, anti-CTLA-4; aCD28, anti-CD28.
Figure 1.
Figure 1.. Correlation between tumor glycolysis and immune cell infiltration upon CTLA-4 blockade.
Heatmaps with identical color mapping setting showing indexes of Pearson correlation analyses between the indicated glycolysis-related genes and immune cell signatures by CIBERSORT in RNAseq data sets from (a) human melanoma samples at baseline (left) and after treatment with ipilimumab (right), and from 4T1-Sc (b) and 4T1-KD (c) tumors treated with anti-CTLA-4 (right) or the isotype control (IgG, left). (a) pre-ipilimumab, n=7; post-ipilimumab, n=15. (b) IgG, n=4; anti-CTLA-4, n=5. (c) n=5/treatment. SLC16A1 (MCT1) and LDHA are highlighted in blue.
Figure 2.
Figure 2.. Long-lasting responses to neoadjuvant anti-CTLA-4 in LDHA-KD-tumor-bearing mice.
(a) Metastasis-free and overall survival in BALB/c mice implanted in the mammary fat pad (mfp) with 106 4T1-Sc or 4T1-KD cells and treated with 3 cycles of anti-CTLA-4 (9D9 IgG2b; n=12) or IgG control (n=9) before primary tumor surgical resection (1 representative of 3 independent experiments; log-rank test). (b) Tumor growth upon re-injection of 106 4T1-Sc or 4T1-KD cells in survivor mice in the anti-CTLA-4-treated 4T1-KD group ~100 days after surgery (n=4/group) in comparison with treatment-naïve mice (n=5) (mean ± SEM; 2-way ANOVA with Bonferroni’s correction). (c) Frequency and representative flow cytometry plots of circulating anti-tumor AH1-specific CD8+ T cells before (pre) and one week after (post) 4T1-Sc (left) or 4T1-KD (right) re-implantation in survivor mice upon neoadjuvant anti-CTLA-4 as in (b). (d) Frequency (left) and (right) memory phenotype (CD44 vs. CD62L expression) in circulating AH1-specific CD8+ T cells in survivor mice as in (b) (n=4/group) or treatment-naïve mice (n=5/group) one week after injection with 4T1-Sc or 4T1-KD (mean ± SEM; 2-sided unpaired t test; n=1 experiment with the IgG2b 9D9 anti-CTLA-4; similar results were obtained with the IgG2a 9D9 antibody). (e) Quantification of tumor-infiltrating T cells by flow cytometry in the indicated treatment groups (n=5 mice/groups; mean ± SEM; 2-sided unpaired t test; 1 representative of 2 independent experiments). * = P<0.05; ** = P<0.01. aC, anti-CTLA-4; TM, tumor. Teff, effector CD4+Foxp3 T cells.
Figure 3.
Figure 3.. Loss of Treg stability and CD8+ TIL activation in anti-CTLA-4-treated LDHA-KD tumors.
(a,b) Tumor weight, frequency of IFN-γ+ and TNF-α+ among CD45+CD4+Foxp3+ Tregs (mean ± SEM; 2-sided unpaired t test) and Pearson correlation analyses between IFN-γ expression in tumor-infiltrating Tregs and CD8+ T cells in 2 independent experiments where 4T1-Sc and 4T1-KD tumors were resected (a) or injected (b) 3 days apart to equalize tumor size (n=5 mice/group except for 4T1-Sc IgG in (b), n=4). (c,d) Flow cytometry of Foxp3 (c), CD25 and intracellular (not cross-blocked by the therapeutic antibody) CTLA-4 (d) in tumor-infiltrating Tregs in the indicated treatment groups (4T1-Sc IgG, n=3; 4T1-Sc anti-CTLA-4, n=4; 4T1-KD, n=5/group; mean ± SEM; 2-sided unpaired t test; 1 representative of 2 independent experiments). (e) Representative gating strategy for CTLA-4lo and CTLA-4hi 4T1-KD-infiltrating Tregs and quantification and representative plots of the indicated cytokines in these Treg subsets from IgG- and anti-CTLA-4-treated 4T1-KD tumors by flow cytometry (n=5 mice/group, mean ± SEM; 2-sided paired t test; 1 representative of 2 independent experiments). (f-l) BALB/c mice were implanted in mfp with 106 4T1-KD cells in Matrigel with or without 50 mM sodium lactate (Na-Lac) and treated with anti-CTLA-4 as indicated (f). Quantification of CTLA-4 and CD25 (g), IFN-γ (h) and (i) Foxp3 by flow cytometry in tumor-infiltrating Tregs, and (j) tumor weight at the end of the experiment (anti-CTLA-4, n=10; anti-CTLA-4+Na-Lac, n=9; mean ± SEM from 1 representative of 3 independent experiments; 2-sided unpaired t test). (k) Pearson correlation analyses between IFN-γ+ Tregs and IFN-γ+ CD8+ TILs normalized per gr of tumor (TM) and (l) quantification of IFN-γ by flow cytometry in CD8+ TILs from mice as in (f-i). MFI, median fluorescence intensity.
Figure 4.
Figure 4.. Glucose-dependent loss of Treg functional stability induced by CTLA-4 blockade.
(a) Flow cytometry representative plot (left) and (right) quantification of 2-NBDG staining on 4T1-KD and 4T1-Sc cells in 2 independent experiments (Rel MFI, relative MFI: 2-NBDG MFI of stained samples relative to matched unstained control; n=2). (b) Glucose consumption by 4T1-KD vs. 4T1-Sc cells cultured in hypoxia (n=3; 1 representative of 2 independent experiments). (c) Flow cytometry representative plot (left) and (right) quantification of glucoseCy3 staining on Tregs treated with anti-CTLA-4 or IgG control in 11 mM glucose (n=2; 1 representative of 2 independent experiments). (d) Quantification of IFN-γ by Luminex-based bead immunoassay in supernatants from Treg cultures as in (c). (e-g) In vitro suppression assays with increasing glucose concentrations and anti-CTLA-4 or IgG control. (f) Percent Treg suppression of CD8+ T-cell proliferation relative to proliferation of CD8+ T cells cultured alone in the same treatment conditions (n=3; 1 representative of 3 independent experiments). (g) Percent of CD86-expressing B cells from cultures as in (f,g). (h-j) In vitro suppression assays with increasing glucose concentrations and anti-CD28 or IgG control. (i) Percent Treg suppression of CD8+ T-cell proliferation relative to proliferation of CD8+ T cells cultured alone in the same treatment conditions (n=3; 1 representative of 3 independent experiments). (j) Percent of CD86-expressing B cells from cultures as in (h,i). (a-j) Mean ± SD; 2-sided unpaired t test. (k) Model of loss of Treg functional stability according to glucose availability and CTLA-4 blockade. Under glucose restriction, such as in 4T1-Sc tumors, anti-CTLA-4 has limited activity against Treg-mediated immunosuppression of Teff (left). When competition for glucose is diminished, T cells better infiltrate the tumor and anti-CTLA-4 promotes Treg glucose metabolism via CD28 co-stimulation, leading to Treg functional destabilization and increased Teff activation (right).

Comment in

References

    1. Frauwirth KA et al. The CD28 signaling pathway regulates glucose metabolism. Immunity 16, 769–777, doi:10.1016/s1074-7613(02)00323-0 (2002). - DOI - PubMed
    1. Hanahan D & Weinberg RA Hallmarks of cancer: the next generation. Cell 144, 646–674, doi:10.1016/j.cell.2011.02.013 (2011). - DOI - PubMed
    1. Buck MD, Sowell RT, Kaech SM & Pearce EL Metabolic Instruction of Immunity. Cell 169, 570–586, doi:10.1016/j.cell.2017.04.004 (2017). - DOI - PMC - PubMed
    1. Chang CH et al. Metabolic Competition in the Tumor Microenvironment Is a Driver of Cancer Progression. Cell 162, 1229–1241, doi:10.1016/j.cell.2015.08.016 (2015). - DOI - PMC - PubMed
    1. Ho PC et al. Phosphoenolpyruvate Is a Metabolic Checkpoint of Anti-tumor T Cell Responses. Cell 162, 1217–1228, doi:10.1016/j.cell.2015.08.012 (2015). - DOI - PMC - PubMed

Publication types