. 2021 Sep 7;73(5):832-841.
doi: 10.1093/cid/ciab139.

A Stronger Innate Immune Response During Hyperacute Human Immunodeficiency Virus Type 1 (HIV-1) Infection Is Associated With Acute Retroviral Syndrome

Affiliations

A Stronger Innate Immune Response During Hyperacute Human Immunodeficiency Virus Type 1 (HIV-1) Infection Is Associated With Acute Retroviral Syndrome

Amin S Hassan et al. Clin Infect Dis. .

Abstract

Background: Acute retroviral syndrome (ARS) is associated with human immunodeficiency virus type 1 (HIV-1) subtype and disease progression, but the underlying immunopathological pathways are poorly understood. We aimed to elucidate associations between innate immune responses during hyperacute HIV-1 infection (hAHI) and ARS.

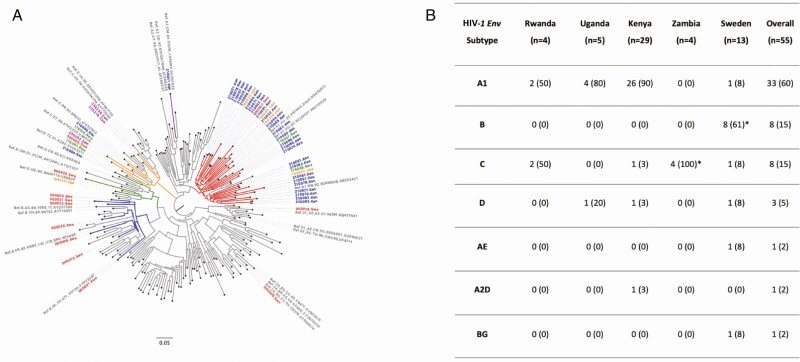
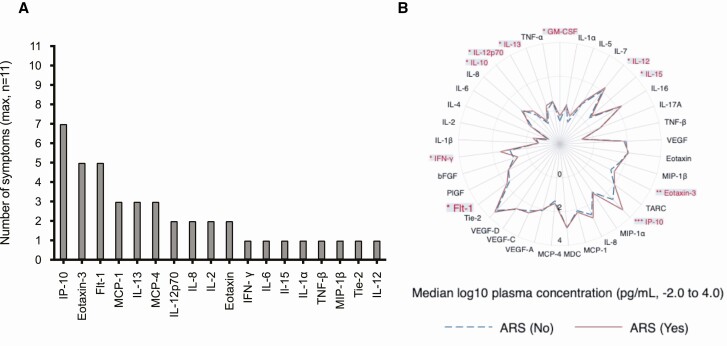
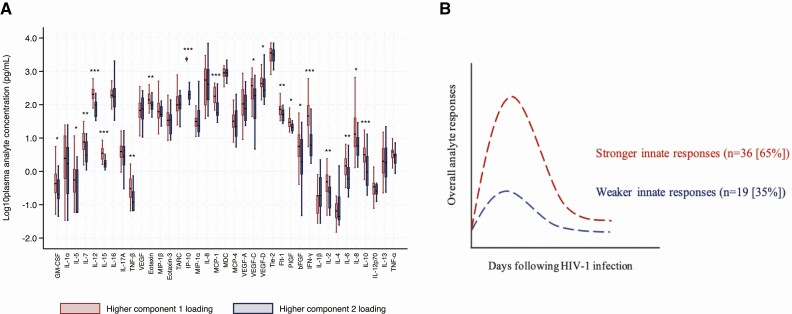
Methods: Plasma samples obtained from volunteers (≥18.0 years) before and during hAHI, defined as HIV-1 antibody negative and RNA or p24 antigen positive, from Kenya, Rwanda, Uganda, Zambia, and Sweden were analyzed. Forty soluble innate immune markers were measured using multiplexed assays. Immune responses were differentiated into volunteers with stronger and comparatively weaker responses using principal component analysis. Presence or absence of ARS was defined based on 11 symptoms using latent class analysis. Logistic regression was used to determine associations between immune responses and ARS.

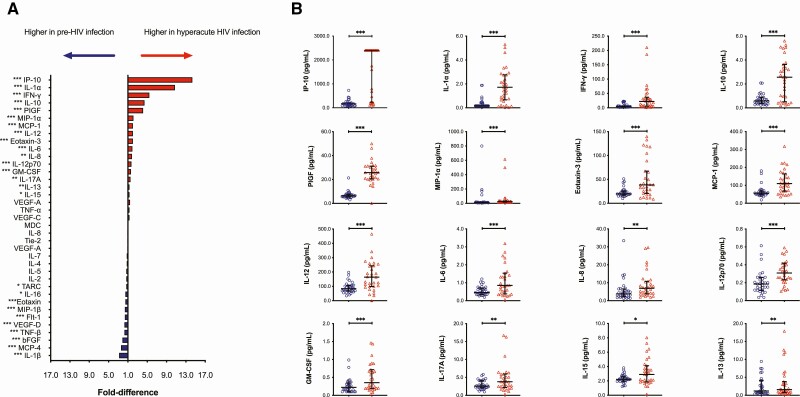
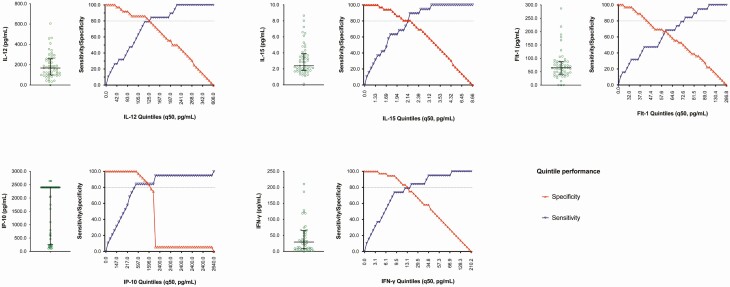
Results: Of 55 volunteers, 31 (56%) had ARS. Volunteers with stronger immune responses (n = 36 [65%]) had increased odds of ARS which was independent of HIV-1 subtype, age, and risk group (adjusted odds ratio, 7.1 [95% confidence interval {CI}: 1.7-28.8], P = .003). Interferon gamma-induced protein (IP)-10 was 14-fold higher during hAHI, elevated in 7 of the 11 symptoms and independently associated with ARS. IP-10 threshold >466.0 pg/mL differentiated stronger immune responses with a sensitivity of 84.2% (95% CI: 60.4-96.6) and specificity of 100.0% (95% CI]: 90.3-100.0).

Conclusions: A stronger innate immune response during hAHI was associated with ARS. Plasma IP-10 may be a candidate biomarker of stronger innate immunity. Our findings provide further insights on innate immune responses in regulating ARS and may inform the design of vaccine candidates harnessing innate immunity.

Keywords: HIV-1; IP-10; acute infection; acute retroviral syndrome; immune responses.


Figures

Figure 1.
Figure 1.
(A) Phylogenetic tree showing relatedness of HIV-1 partial envelope sequences (V1-V3 region) from individuals with hyperacute HIV-1 infection from Africa and Sweden (N = 55), with HIV-1 subtype reference sequences from the Los Alamos database (N = 158); and (B) summary table showing the distribution of HIV-1 partial env (V1-V3 region) subtypes of individuals with hyperacute infection from Africa and Sweden (N = 55). Branches are colored according to HIV-1 env subtype as follows: gray (references), red (subtype A1), dark blue (subtype B), orange (subtype C), green (subtype D), light blue (recombinant BG), purple (recombinant A2D), and brown (recombinant AE). Tip labels are colored according to the country of origin as follows: gray (references; only those clustering with volunteer sequences shown), green (Rwanda), orange (Uganda), blue (Kenya), purple (Zambia), and red (Sweden). *Unable to amplify HIV-1 env region from two volunteers, though previous gag/pol/nef sequence data suggests subtype C (Zambia, n = 1) and B (Sweden, n = 1) infections and included in the analysis as such. Abbreviation: HIV-1, human immunodeficiency virus type 1.
Figure 2.
Figure 2.
(a) Distribution of volunteers diagnosed with hyperacute HIV-1 infection by AHI symptoms; (b) a schematic illustration of the distribution of AHI symptoms for all volunteers (black curve) and by grouping of volunteers resulting from latent class analysis (LCA, for those without acute retroviral syndrome, [ARS, blue] and for those with ARS [red]). The numbers denote median (interquartile ranges) symptoms per volunteer for all volunteers (in black), for those without ARS (in blue) and for those with ARS (in red); and (c) Graph comparing the distribution of AHI symptoms between volunteers that were defined to be with and without ARS (Fisher exact test P < .05 [*], P < .01 [**], and P < .001 [***], N = 55). ARS was defined based on the 11 AHI symptoms and other unobserved linkages between symptoms using LCA. Incremental latent group models were assessed to predict the goodness of fit. The model with 2 latent groups was the best fit as it had the lowest BIC value (660.5) compared to 3 (678.6), 4 (699.2), or 5 (714.7) groups. Volunteers were grouped based on their predicted posterior probabilities into those with ARS (n = 31 [56%]) and those without ARS (n = 24 [44%]). Abbreviations: AHI, acute human immunodeficiency virus type 1; ARS, acute retroviral syndrome; CI, confidence interval; HIV-1, human immunodeficiency virus type 1; LCA, latent class analysis.
Figure 3.
Figure 3.
(A) Plot illustrating fold-differences in median plasma biomarker concentration from matched pre-infection and hyperacute HIV-1 infection samples. Red bars demonstrate fold difference in analytes that had higher plasma concentrations during hyperacute HIV-1 infection compared to the pre-infection samples. Blue bars denote fold-difference in analytes that had higher concentrations in the pre-infection samples compared to hyperacute HIV-1 infection samples. (B) Graphs illustrating analytes that were significantly higher during hyperacute HIV-1 infection compared to preinfection (Wilcoxon paired signed-rank test P < .05 [*], P < .01 [**], and P < .001 [***], N = 31). Abbreviations: bFGF, basic fibroblast growth factor; Flt, FMS-like tyrosine kinase; GM-CSF, granulocyte-macrophage colony-stimulating factor; HIV-1, human immunodeficiency virus type 1; IP, interferon gamma-induced protein; IFN, interferon; IL, interleukin; MCP, monocyte chemoattractant protein; MDC, macrophage-derived chemokine; MIP, macrophage inflammatory protein; PlGF, placental growth factor; TARC, thymus and activation-related chemokine; TNF, tumor necrosis factor; VEGF, vascular endothelial growth factor.
Figure 4.
Figure 4.
(A) Graph summarizing associations between log10 median plasma analyte concentration when comparing volunteers with and those without AHI symptoms (Supplementary Figure 2), and (B) plot illustrating differences in log10 median plasma biomarker concentration between hyperacute HIV-1 infected volunteers with ARS compared to mild ARS (Wilcoxon rank sum test P < .05 [*], P < .01 [**], and P < .001 [***], N = 55). Analytes suggestive of an association with any of the 11 AHI symptoms and with ARS (IL-12, IL-15, Eotaxin-3, IP-10, Flt-1, IFN-γ, IL-12p70 and IL-13) were further explored using principal component analysis (PCA). Abbreviations: AHI, acute human immunodeficiency virus type 1; ARS, acute retroviral syndrome; bFGF, basic fibroblast growth factor; Flt, FMS-like tyrosine kinase; GM-CSF, granulocyte-macrophage colony-stimulating factor; HIV-1, human immunodeficiency virus type 1; IFN, interferon; IP, interferon gamma-induced protein; IL, interleukin; MCP, monocyte chemoattractant protein; MDC, macrophage-derived chemokine; MIP, macrophage inflammatory protein; PlGF, placental growth factor; TARC, thymus and activation-related chemokine; TNF, tumor necrosis factor; VEGF, vascular endothelial growth factor.
Figure 5.
Figure 5.
(A) Graph demonstrating the differentiation of analyte responses by principal component analysis loadings. Volunteers with higher principal component (PC) 1 loadings had significantly higher plasma concentration in a majority of the analytes compared to those with higher PC2 loadings (Wilcoxon rank sum test P < .05 [*], P < .01 [**], and P < .001 [***], N = 55); (B) A schematic illustration of the differentiation of analyte responses into volunteers with and without a cytokine storm; and Wilcoxon signed rank test (P < .05 [*], P < .01 [**], P < .005 [***], and P < .0005 [****]; paired/matched signed rank test in green, N = 31). Abbreviations: hbFGF, basic fibroblast growth factor; Flt, FMS-like tyrosine kinase; GM-CSF, granulocyte-macrophage colony-stimulating factor; hAHI, hyperacute HIV-1 infection; HIV-1, human immunodeficiency virus type 1; IFN, interferon; IL, interleukin; IP, interferon gamma-induced protein; MCP, monocyte chemoattractant protein; MDC, macrophage-derived chemokine; MIP, macrophage inflammatory protein; PlGF, placental growth factor; TARC, thymus and activation-related chemokine; TNF, tumor necrosis factor; VEGF, vascular endothelial growth factor.
Figure 6.
Figure 6.
Graphs demonstrating distribution, performance (sensitivity and specificity) and threshold of analytes (IL-12, IL-15, Flt-1, IP-10, and IFN-γ) indicative of a stronger innate immune response. Analytes and threshold with both sensitivity and specificity of more than 80% were further explored. Abbreviations: Flt, FMS-like tyrosine kinase; IFN, interferon; IL, interleukin; IP, interferon gamma-induced protein.

Similar articles

Cited by

References

    1. Fiebig EW, Wright DJ, Rawal BD, et al. . Dynamics of HIV viremia and antibody seroconversion in plasma donors: implications for diagnosis and staging of primary HIV infection. AIDS 2003; 17:1871–9. - PubMed
    1. Braun DL, Kouyos RD, Balmer B, Grube C, Weber R, Günthard HF. Frequency and spectrum of unexpected clinical manifestations of primary HIV-1 infection. Clin Infect Dis 2015; 61:1013–21. - PubMed
    1. Robb ML, Eller LA, Kibuuka H, et al. ; RV 217 Study Team . Prospective study of acute HIV-1 infection in adults in East Africa and Thailand. N Engl J Med 2016; 374:2120–30. - PMC - PubMed
    1. Sanders EJ, Price MA, Karita E, et al. . Differences in acute retroviral syndrome by HIV-1 subtype in a multicentre cohort study in Africa. AIDS 2017; 31:2541–6. - PMC - PubMed
    1. Tindall B, Barker S, Donovan B, et al. . Characterization of the acute clinical illness associated with human immunodeficiency virus infection. Arch Intern Med 1988; 148:945–9. - PubMed

Publication types