

Deep Neural Networks Can Predict New-Onset Atrial Fibrillation From the 12-Lead ECG and Help Identify Those at Risk of Atrial Fibrillation-Related Stroke
- PMID: 33588584
- PMCID: PMC7996054
- DOI: 10.1161/CIRCULATIONAHA.120.047829
Deep Neural Networks Can Predict New-Onset Atrial Fibrillation From the 12-Lead ECG and Help Identify Those at Risk of Atrial Fibrillation-Related Stroke
Abstract
Background: Atrial fibrillation (AF) is associated with substantial morbidity, especially when it goes undetected. If new-onset AF could be predicted, targeted screening could be used to find it early. We hypothesized that a deep neural network could predict new-onset AF from the resting 12-lead ECG and that this prediction may help identify those at risk of AF-related stroke.
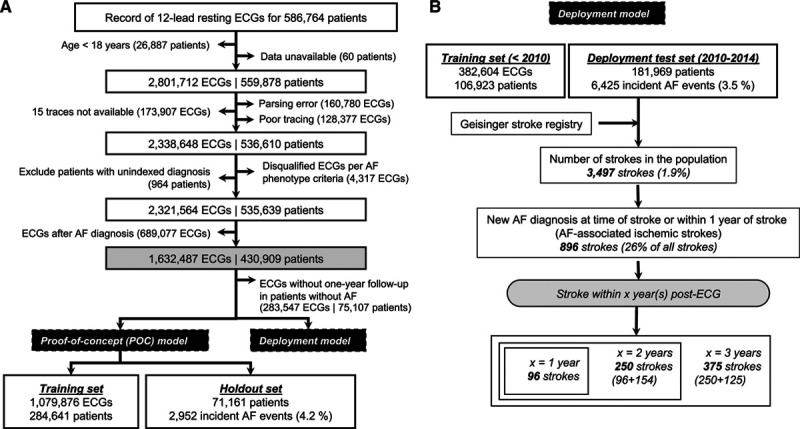
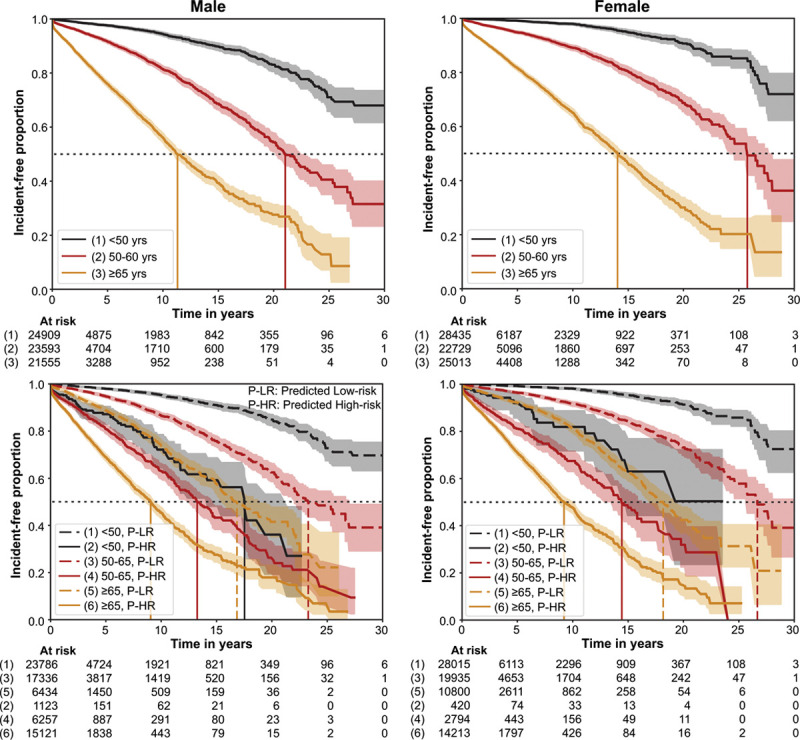
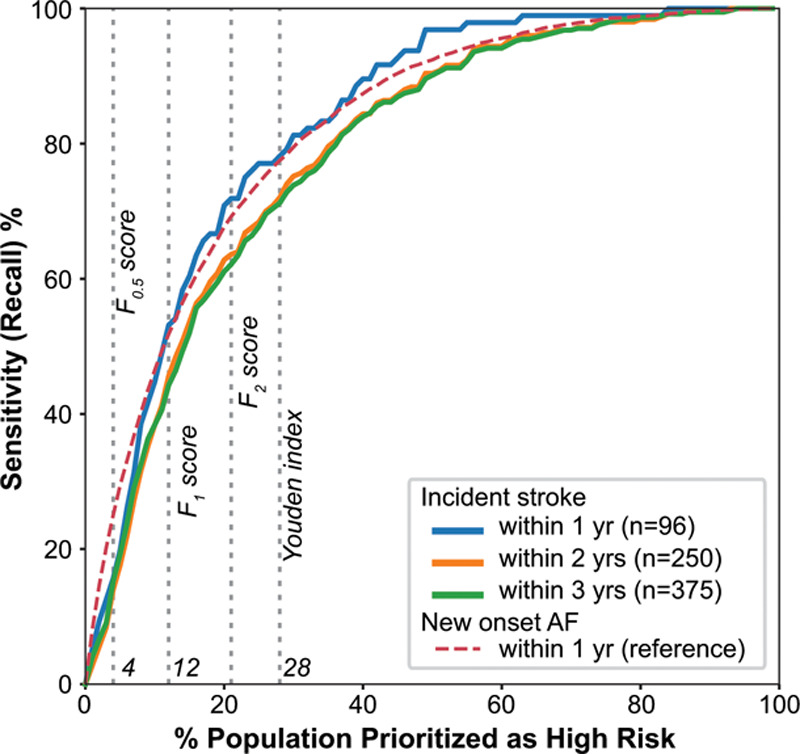
Methods: We used 1.6 M resting 12-lead digital ECG traces from 430 000 patients collected from 1984 to 2019. Deep neural networks were trained to predict new-onset AF (within 1 year) in patients without a history of AF. Performance was evaluated using areas under the receiver operating characteristic curve and precision-recall curve. We performed an incidence-free survival analysis for a period of 30 years following the ECG stratified by model predictions. To simulate real-world deployment, we trained a separate model using all ECGs before 2010 and evaluated model performance on a test set of ECGs from 2010 through 2014 that were linked to our stroke registry. We identified the patients at risk for AF-related stroke among those predicted to be high risk for AF by the model at different prediction thresholds.
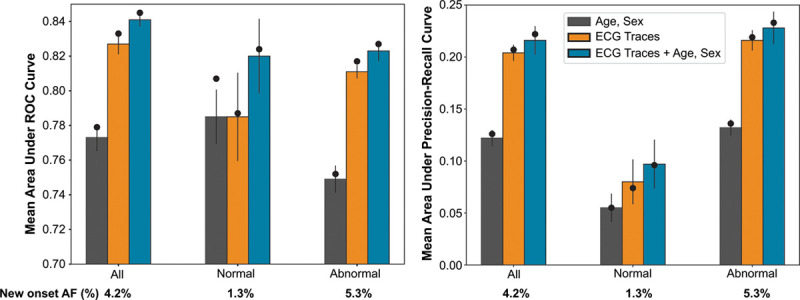
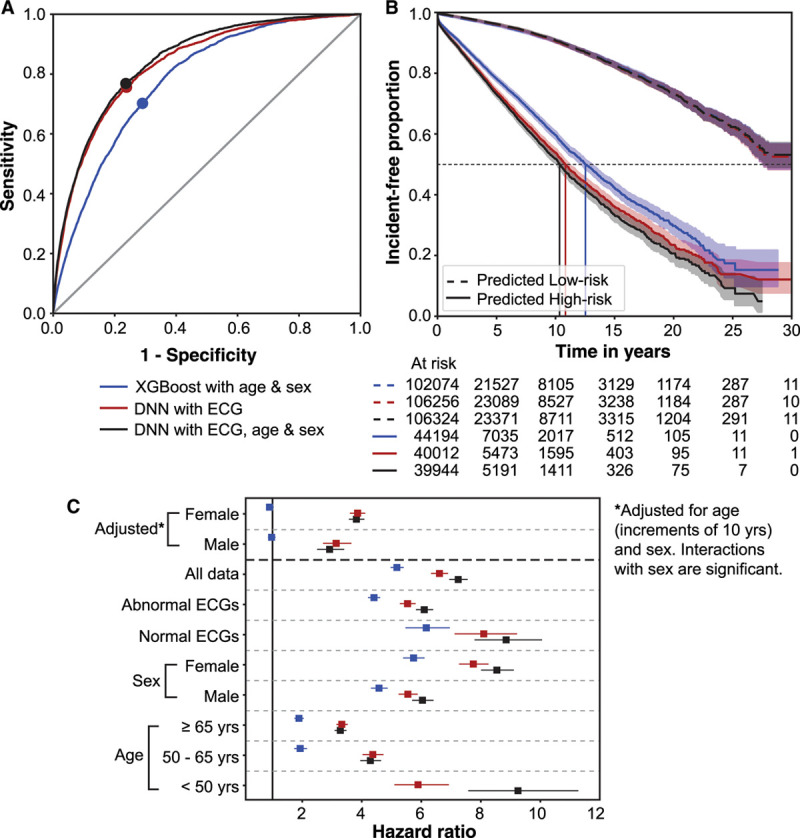
Results: The area under the receiver operating characteristic curve and area under the precision-recall curve were 0.85 and 0.22, respectively, for predicting new-onset AF within 1 year of an ECG. The hazard ratio for the predicted high- versus low-risk groups over a 30-year span was 7.2 (95% CI, 6.9-7.6). In a simulated deployment scenario, the model predicted new-onset AF at 1 year with a sensitivity of 69% and specificity of 81%. The number needed to screen to find 1 new case of AF was 9. This model predicted patients at high risk for new-onset AF in 62% of all patients who experienced an AF-related stroke within 3 years of the index ECG.
Conclusions: Deep learning can predict new-onset AF from the 12-lead ECG in patients with no previous history of AF. This prediction may help identify patients at risk for AF-related strokes.
Keywords: atrial fibrillation; atrial flutter; deep learning; neural network; prediction; stroke.
Figures
Comment in
-
Trusting Magic: Interpretability of Predictions From Machine Learning Algorithms.Circulation. 2021 Mar 30;143(13):1299-1301. doi: 10.1161/CIRCULATIONAHA.121.053733. Epub 2021 Mar 29. Circulation. 2021. PMID: 33779269 Free PMC article. No abstract available.
References
-
- Britton M, Gustafsson C. Non-rheumatic atrial fibrillation as a risk factor for stroke. Stroke. 1985;16:178–181. doi: 10.1161/01.STR.16.2.182 - PubMed
-
- Wolf PA, Dawber TR, Thomas HE, Jr, Kannel WB. Epidemiologic assessment of chronic atrial fibrillation and risk of stroke: the Framingham study. Neurology. 1978;28:973–977. doi: 10.1212/wnl.28.10.973 - PubMed
-
- Stewart S, Hart CL, Hole DJ, McMurray JJ. A population-based study of the long-term risks associated with atrial fibrillation: 20-year follow-up of the Renfrew/Paisley study. Am J Med. 2002;113:359–364. doi: 10.1016/s0002-9343(02)01236-6 - PubMed
-
- Hart RG, Pearce LA, Aguilar MI. Meta-analysis: antithrombotic therapy to prevent stroke in patients who have nonvalvular atrial fibrillation. Ann Intern Med. 2007;146:857–867. doi: 10.7326/0003-4819-146-12-200706190-00007 - PubMed
Publication types
MeSH terms
LinkOut - more resources
Full Text Sources
Other Literature Sources
Medical
