. 2021 Feb 15;22(1):69.
doi: 10.1186/s12859-020-03927-2.

WACS: improving ChIP-seq peak calling by optimally weighting controls

Affiliations

WACS: improving ChIP-seq peak calling by optimally weighting controls

Aseel Awdeh et al. BMC Bioinformatics. .

Abstract

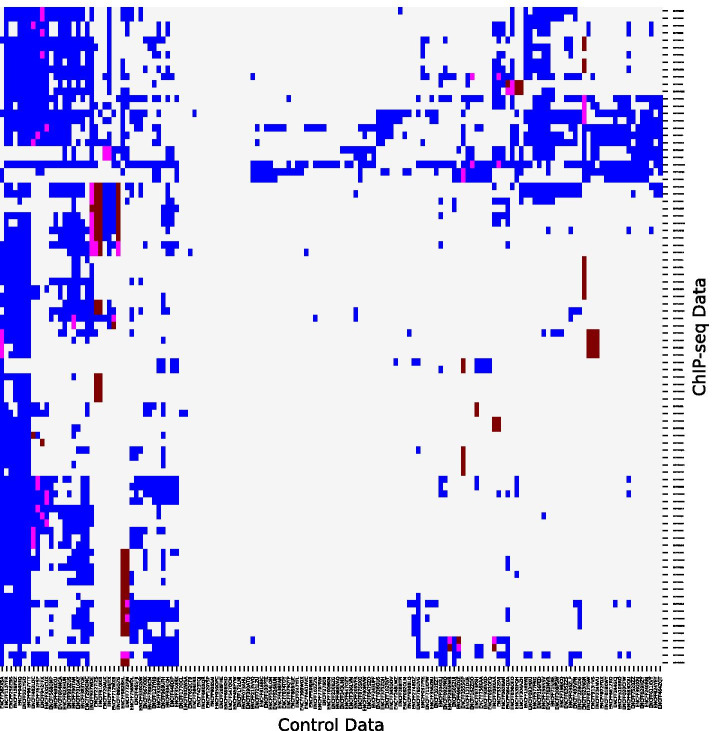
Background: Chromatin immunoprecipitation followed by high throughput sequencing (ChIP-seq), initially introduced more than a decade ago, is widely used by the scientific community to detect protein/DNA binding and histone modifications across the genome. Every experiment is prone to noise and bias, and ChIP-seq experiments are no exception. To alleviate bias, the incorporation of control datasets in ChIP-seq analysis is an essential step. The controls are used to account for the background signal, while the remainder of the ChIP-seq signal captures true binding or histone modification. However, a recurrent issue is different types of bias in different ChIP-seq experiments. Depending on which controls are used, different aspects of ChIP-seq bias are better or worse accounted for, and peak calling can produce different results for the same ChIP-seq experiment. Consequently, generating "smart" controls, which model the non-signal effect for a specific ChIP-seq experiment, could enhance contrast and increase the reliability and reproducibility of the results.

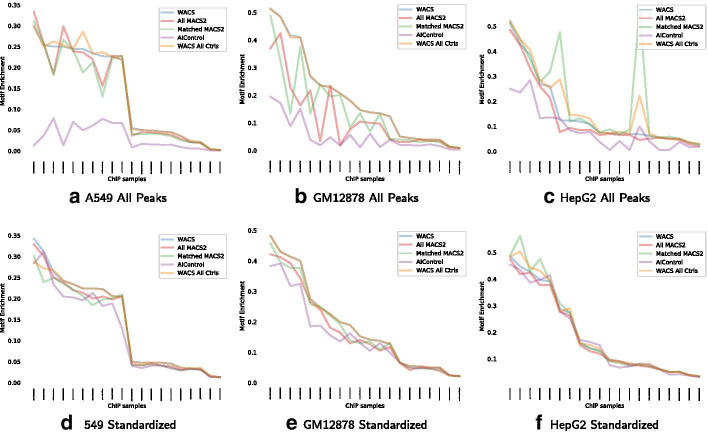
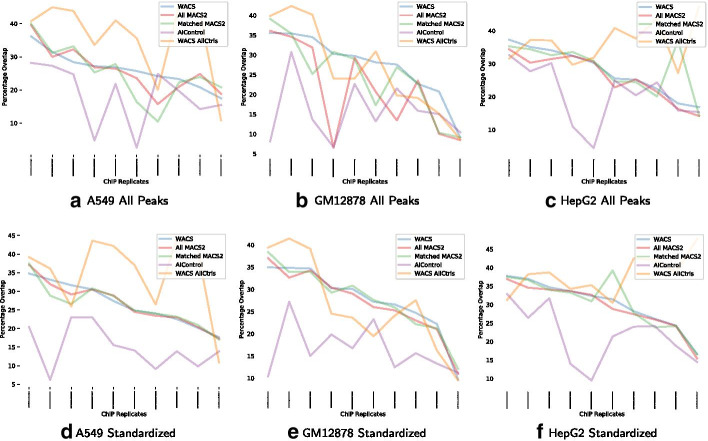
Result: We propose a peak calling algorithm, Weighted Analysis of ChIP-seq (WACS), which is an extension of the well-known peak caller MACS2. There are two main steps in WACS: First, weights are estimated for each control using non-negative least squares regression. The goal is to customize controls to model the noise distribution for each ChIP-seq experiment. This is then followed by peak calling. We demonstrate that WACS significantly outperforms MACS2 and AIControl, another recent algorithm for generating smart controls, in the detection of enriched regions along the genome, in terms of motif enrichment and reproducibility analyses.

Conclusions: This ultimately improves our understanding of ChIP-seq controls and their biases, and shows that WACS results in a better approximation of the noise distribution in controls.

Keywords: Bias; ChIP-seq; Controls.


Conflict of interest statement

The authors declare that they have no competing interests.

Figures

Fig. 1
Fig. 1
Flowcharts for WACS and MACS2. Both methods take controls and a treatment as input
Fig. 2
Fig. 2
Motif enrichment of peaks found by five different peak calling approaches in 90 ChIP-seq samples. Motif enrichment is defined as the fraction of all peaks that contain at least one motif occurrence for the transcription factor in question. a Motif enrichment for all peaks. b Motif enrichment for the standardized peaks. c Distributions of percentages differences in motif enrichment relative to Matched MACS2. Box and whisker plots show the 0th, 25th, 50th, 75th and 100th percentiles
Fig. 3
Fig. 3
Reproducibility of peak calls between biological replicates. a, b Percentage overlap between replicates, for each of the five peak calling methods for 45 ChIP-seq experiments, when using a all peaks, or b standardized peaks. c Box plots of percentage difference in reproducibility relative to Matched MACS2
Fig. 4
Fig. 4
Comparison of controls used by WACS and ENCODE. The rows and columns correspond to the ChIP-seq and control experiments respectively. For each ChIP-seq dataset, the controls are given a blue color if they are used by WACS only, a maroon color if they are ENCODE matched controls only, and a magenta color if they are used by both ENCODE and WACS
Fig. 5
Fig. 5
Motif enrichment of the peaks called by five methods for each of the three additional validation cell lines: A549 (a, d), GM12878 (b, e) and HepG2 (c, f)
Fig. 6
Fig. 6
Percentage overlap in peaks between biological replicates, for each of the five peak calling methods for each of the three additional validation cell lines: A549 (a, d), GM12878 (b, e) and HepG2 (c, f)

Similar articles

Cited by

References

    1. Johnson DS, Mortazavi A, Myers RM, Wold B. Genome-wide mapping of in vivo protein-DNA interactions. Science. 2007;316(5830):1497–1502. doi: 10.1126/science.1141319. - DOI - PubMed
    1. Barski A, Cuddapah S, Cui K, Roh T-Y, Schones DE, Wang Z, Wei G, Chepelev I, Zhao K. High-resolution profiling of histone methylations in the human genome. Cell. 2007;129(4):823–837. doi: 10.1016/j.cell.2007.05.009. - DOI - PubMed
    1. Pepke S, Wold B, Mortazavi A. Computation for ChIP-Seq and RNA-seq studies. Nat Methods. 2009;6(11s):22. doi: 10.1038/nmeth.1371. - DOI - PMC - PubMed
    1. Laajala TD, Raghav S, Tuomela S, Lahesmaa R, Aittokallio T, Elo LL. A practical comparison of methods for detecting transcription factor binding sites in ChIP-Seq experiments. BMC Genom. 2009;10(1):618. doi: 10.1186/1471-2164-10-618. - DOI - PMC - PubMed
    1. Bardet AF, He Q, Zeitlinger J, Stark A. A computational pipeline for comparative ChIP-Seq analyses. Nat Protoc. 2012;7(1):45–61. doi: 10.1038/nprot.2011.420. - DOI - PubMed

MeSH terms

LinkOut - more resources