. 2021 Feb 15;16(1):7.
doi: 10.1186/s13024-020-00421-4.

Increased serum QUIN/KYNA is a reliable biomarker of post-stroke cognitive decline

Affiliations

Increased serum QUIN/KYNA is a reliable biomarker of post-stroke cognitive decline

Adrien Cogo et al. Mol Neurodegener. .

Abstract

Background: Strokes are becoming less severe due to increased numbers of intensive care units and improved treatments. As patients survive longer, post-stroke cognitive impairment (PSCI) has become a major health public issue. Diabetes has been identified as an independent predictive factor for PSCI. Here, we characterized a clinically relevant mouse model of PSCI, induced by permanent cerebral artery occlusion in diabetic mice, and investigated whether a reliable biomarker of PSCI may emerge from the kynurenine pathway which has been linked to inflammatory processes.

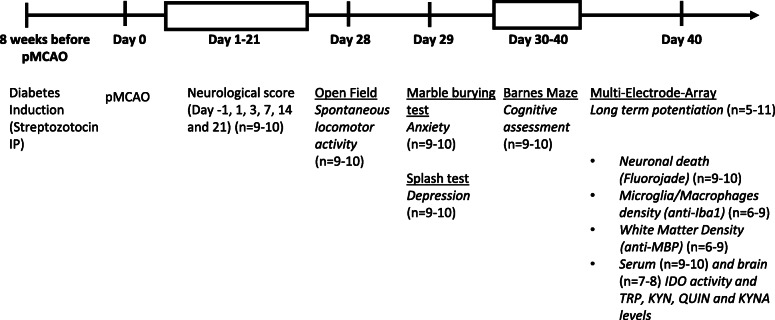
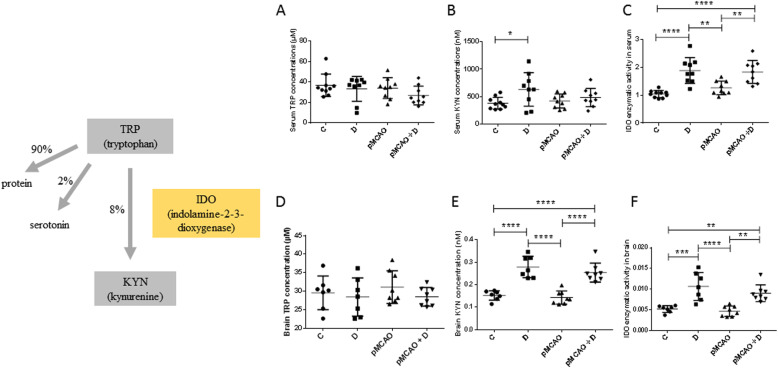
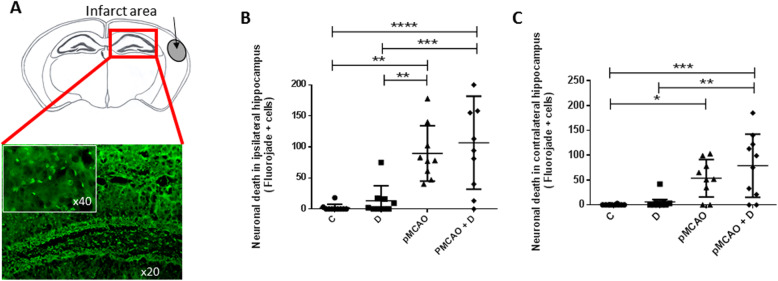
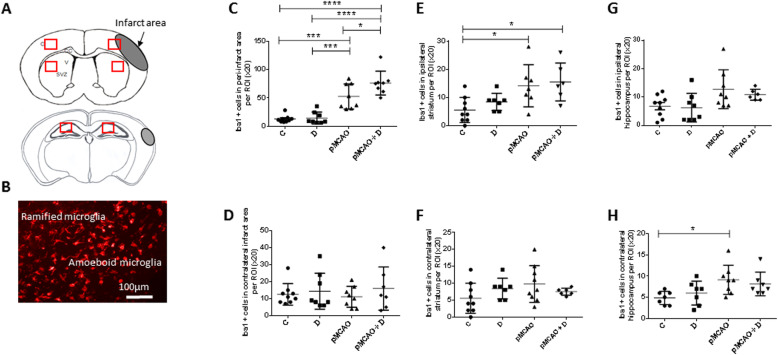
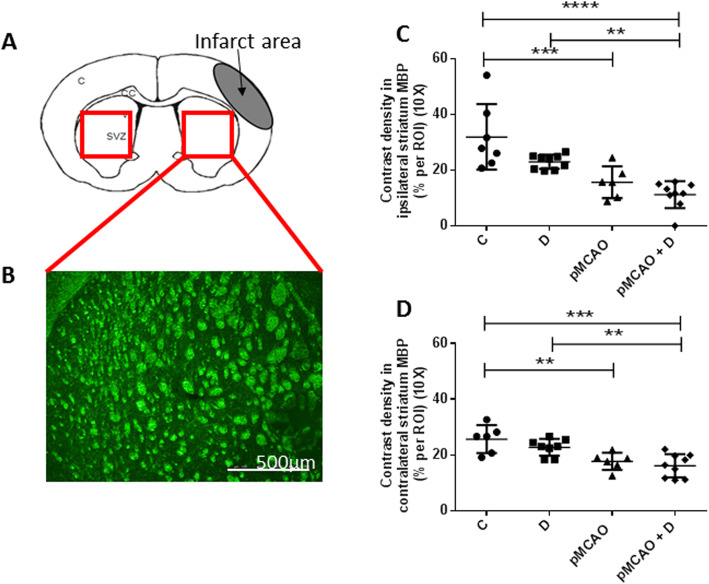
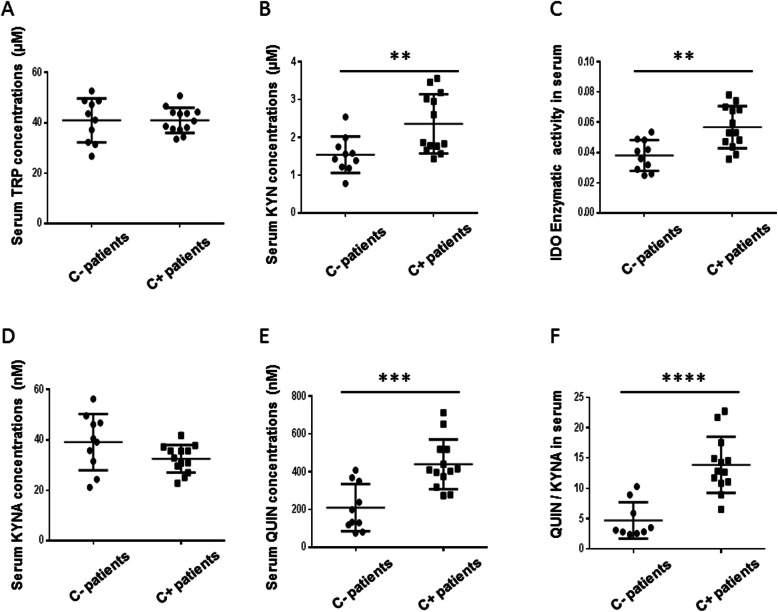
Methods: Cortical infarct was induced by permanent middle cerebral artery occlusion in male diabetic mice (streptozotocin IP). Six weeks later, cognitive assessment was performed using the Barnes maze, hippocampi long-term potentiation using microelectrodes array recordings, and neuronal death, white matter rarefaction and microglia/macrophages density assessed in both hemispheres using imunohistochemistry. Brain and serum metabolites of the kynurenin pathway were measured using HPLC and mass fragmentography. At last, these same metabolites were measured in the patient's serum, at the acute phase of stroke, to determine if they could predict PSCI 3 months later.

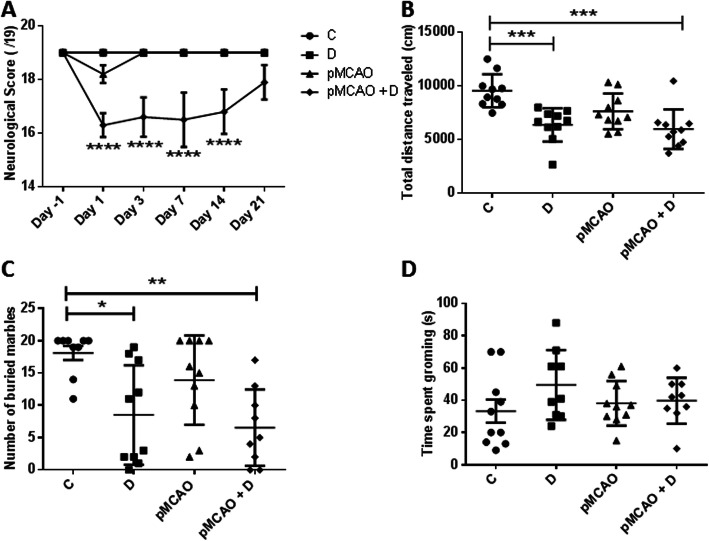
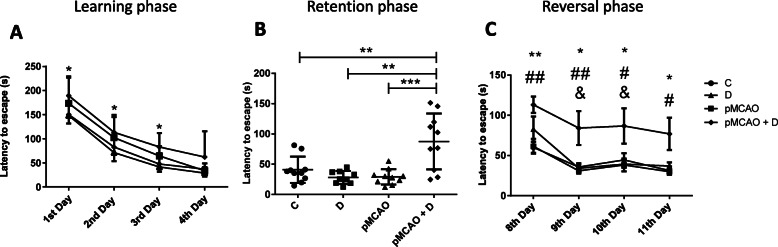
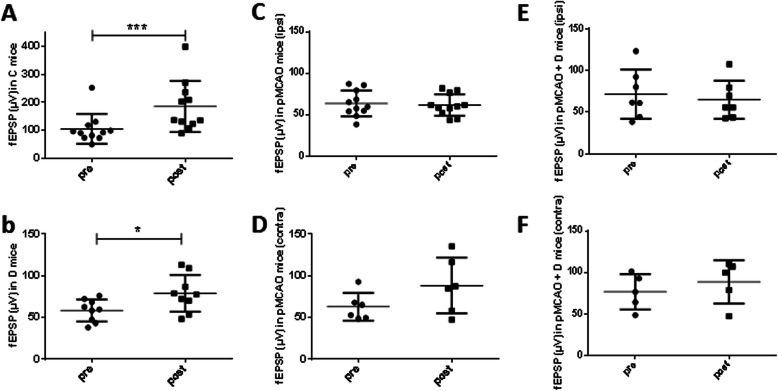
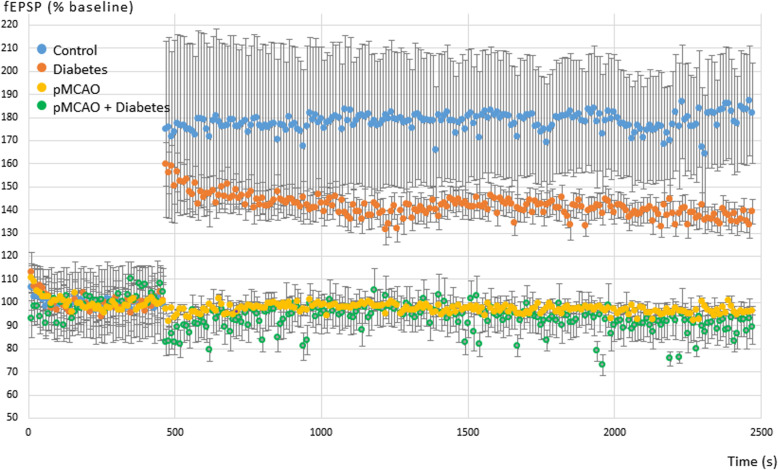
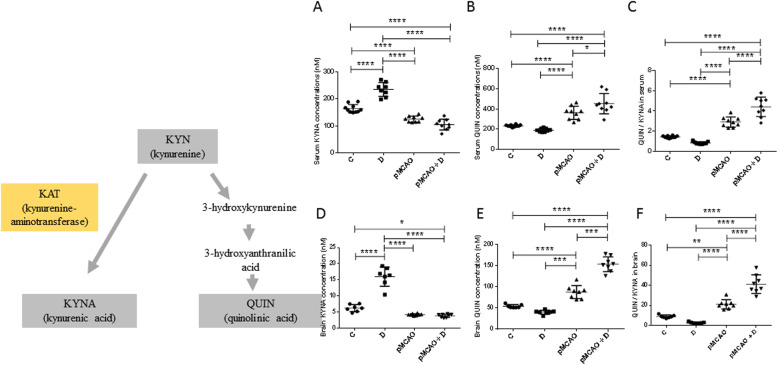
Results: We found long-term spatial memory was impaired in diabetic mice 6 weeks after stroke induction. Synaptic plasticity was completely suppressed in both hippocampi along with increased neuronal death, white matter rarefaction in both striatum, and increased microglial/macrophage density in the ipsilateral hemisphere. Brain and serum quinolinic acid concentrations and quinolinic acid over kynurenic acid ratios were significantly increased compared to control, diabetic and non-diabetic ischemic mice, where PSCI was absent. These putative serum biomarkers were strongly correlated with degradation of long-term memory, neuronal death, microglia/macrophage infiltration and white matter rarefaction. Moreover, we identified these same serum biomarkers as potential predictors of PSCI in a pilot study of stroke patients.

Conclusions: we have established and characterized a new model of PSCI, functionally and structurally, and we have shown that the QUIN/KYNA ratio could be used as a surrogate biomarker of PSCI, which may now be tested in large prospective studies of stroke patients.

Keywords: 3-dioxygenase; Post-stroke dementia • mouse • electrophysiology • tryptophane • cerebral ischemia • indolamine 2.


Conflict of interest statement

The authors declare that they have no competiting interests.

Figures

Fig. 1
Fig. 1
Timeline of experimental protocol. pMCAo: permanent middle cerebral artery occlusion; IP: intraperitoneal; n: number of mice/group. Long term potentiation, neuronal death and microglia/macrophage densities were studied in both hippocampus; white matter density and microglia/macrophages density were studied in both striatums; microglia/macrophage density was studied in the peri-infarct and contralateral homonymous area. Indoleamine 2, 3 dioxygenase (IDO) activity that converts Tryptophan (TRP) to Kynurenine (KYN), and kynurenine metabolites, quinolinic acid (QUIN) and kynurenic acid (KYNA) were measured in serum and brain at D40. Four groups were evaluated for each time point: control mice (C), diabetic mice (D), pMCAo mice (mice subjected to permanent middle cerebral artery occlusion without diabetes) and pMCAo + D (mice subjected to permanent middle cerebral artery occlusion with diabetes); n is the number of mice/group
Fig. 2
Fig. 2
Functional evaluations were made in C, D, pMCAo and pMCAo+D mice. a From D1 to D14, the pMCAo + D group had significantly lower neurological scores than C, D and pMCAo mice) (P < 0.0001). By D21, pMCAo + D mice had completely recovered and no significant differences between groups remained. b In the open field test, at D28, the total distance travelled by pMCAo+D mice was significantly less than that of C mice (P < 0.001) and also less for D mice than C mice (P < 0.001). c In the marble burying test, at D29, significantly fewer marbles were buried by pMCAo+D mice than by C mice (P < 0.01) and by D mice compared to C mice (P < 0.05). d There were no significant differences between the 4 groups in the splash test at D29. *P < 0.05, **P < 0.01, ***P < 0.001, ****P < 0.0001
Fig. 3
Fig. 3
Spatial memory evaluated by the Barnes maze between D30 and D40. a During the learning phase, the latency to escape of pMCAo+D mice was significantly longer on the first three days than that for the other three groups (P < 0.05) but was no longer significantly different on the 4th day. b During the retention phase, pMCAo+D mice showed significantly longer latencies to escape than all other groups: C (P < 0.01), D (P < 0.01) and pMCAo mice (p < 0.001). c During the 4 days of the reversal phase, pMCAo+D mice showed significantly longer latencies to escape than animals of all other groups (P < 0.05). Overall, pMCAo+D mice showed spatial memory deficits and impaired plasticity especially during the retention and reversal phases of the maze test. For the learning phase *P < 0.05 between pMCAo+D and pMCAo mice; for the retention phase, **P < 0.01, ***P < 0.001; for the reversal phase, *P < 0.05 and **P < 0.01, between pMCAo+D and C mice; # P < 0.05 and ##P < 0.01 between pMCAo+D and pMCAo mice; & P < 0.05, between pMCAO+D and D mice
Fig. 4
Fig. 4
Effects of pMCAo and diabetes on long-term potentiation (LTP) of CA1 field Excitatory Post-Synaptic Potentials (fEPSP) induced in hippocampal slices by tetanic stimulation of Schaffer collaterals. Graphs show fEPSP amplitudes (μV) before (pre) and after (post) tetanic stimulation in (a) control, (b) diabetic, (c, d) pMCAo and (e, f) pMCAo+D mice. LTP was assessed for both pMCAo and pMCAo+D mice in hippocampus ipsilateral (c, e) or contralateral (d, f) to the infarct. Significant synaptic LTP was detected in slices from control (P < 0.001) and diabetic mice (P < 0.05). LTP was not induced in either ipsi- or contralateral slices from both pMCAo and pMCAo+D mice. fEPSP, field excitatory post synaptic potential. *P < 0.05, ***P < 0.001
Fig. 5
Fig. 5
Mean and SEM of fEPSP amplitudes in the CA1 region of hippocampal slices from the 4 different groups of mice before and after tetanic stimulation of Schaffer collaterals. Amplitudes are normalized to 100% for the control period from 0 to 480 s when the tetanic stimulation was delivered. Data are shown from control mice (blue), diabetic mice (orange), pMCAo mice (yellow) and pMCAo diabetic mice (green). LTP was not induced in pMCAo animals, with or without diabetes
Fig. 6
Fig. 6
Serum and brain changes of the tryptophan (TRP) and kynurenine (KYN) concentrations and indoleamine 2, 3-dioxygenase (IDO) activity in pMCAo+D mice. These elements of the tryptophan/kynurenine pathway are shown at the left. a-f show changes in concentrations or activity of these molecules in the C, D, pMCAo and pMCAo+D mice, in serum (a, b, c) and brain (d, e, f). a Serum TRP levels did not differ between the four groups. b Serum KYN levels were significantly higher in D than in C mice (P < 0.05). c Serum IDO activity was significantly higher in pMCAo+D animals than in pMCAo mice (P < 0.01) or C mice (P < 0.0001). It was higher in D mice than in pMCAo (P < 0.01) or C mice (P < 0.0001). d Brain TRP levels did not differ between the four groups. e Brain KYN levels were significantly higher in pMCAo+D animals than in pMCAo or C mice (P < 0.0001). They were higher in D mice than in pMCAo or C mice (P < 0.0001). f Brain IDO activity was significantly higher in pMCAo+D animals than in pMCAo mice (P < 0.01) or C mice (P < 0.01). It was higher in D mice than in pMCAo (P < 0.0001) or C mice (P < 0.001) (*P < 0.05, **P < 0.01, ***P < 0.001, ****P < 0.0001)
Fig. 7
Fig. 7
Serum and brain changes of the kynurenic acid (KYNA) and quinolinic acid (QUIN) concentrations and QUIN/KYNA ratio in pMCAo+D mice. These elements of the tryptophan/kynurenine pathway are shown at the left. a-f show changes in concentrations or activity of these molecules in the C, D, pMCAo and pMCAo+D mice, in serum (a, b, c) and brain (d, e, f). a Serum KYNA concentrations were lower in pMCAo+D mice than in D or C mice (P < 0.0001). KYNA levels were lower in pMCAo mice than in D and C mice (P < 0.0001) and lower in C mice than in D mice (P < 0.0001). b Serum QUIN levels were significantly higher in pMCAo+D than in C mice (P < 0.0001), D (P < 0.0001) or in pMCAo mice (P < 0.05). They were higher in pMCAo mice than in C or D mice (P < 0.0001). c The serum QUIN/KYNA ratio was higher in pMCAo+D mice than in all other groups (P < 0.0001). The ratio was significantly higher in pMCAo mice than in D or C mice (P < 0.0001). d Brain KYNA concentrations were lower in pMCAo+D mice than in D (P < 0.0001) or in C mice (P < 0.05). Brain KYNA levels were lower in pMCAo mice than in D (P < 0.0001) and lower in C mice than in D mice (P < 0.0001) (*P < 0.05, **P < 0.01, ***P < 0.001, ****P < 0.0001). e Brain QUIN levels were significantly higher in pMCAo+D than in C mice (P < 0.0001), D (P < 0.0001) or in pMCAo mice (P < 0.001). They were higher in pMCAo mice than in C or D mice (P < 0.0001). f The brain QUIN/KYNA ratio was higher in pMCAo+D mice than in all other groups (P < 0.0001). The ratio was significantly higher in pMCAo mice than in D (P < 0.0001) or C mice (P < 0.01)
Fig. 8
Fig. 8
Neuronal degeneration in the ipsi- and contralateral hippocampus in C, D, pMCAo and pMCAo+D mice. Fluorojade staining was used to label degenerating cells in both hippocampus at D40. a Fluorojade staining of ipsilateral hippocampus in pMCAo+D mice (× 20 and magnification × 40). The diagram above shows the distant and restricted site of the induced infarct. b Numbers of Fluorojade+ neurons in ipsilateral hippocampus were significantly greater in pMCAo+D mice than in C (P < 0.0001) or D mice (P < 0.001). Neuronal degeneration was higher in pMCAo mice than in C or D mice (P < 0.01). c In contralateral hippocampus, numbers of degenerating neurons were higher in pMCAo+D mice than in C (P < 0.001) or D mice (P < 0.01). Numbers of Fluorojade+ neurons were significantly higher in pMCAo mice than in C mice (P < 0.05). *P < 0.05, **P < 0.01, ***P < 0.001, ****P < 0.0001
Fig. 9
Fig. 9
Microglial/macrophage infiltration is most strong in the ipsilateral peri-infarct area of pMCAo+D mice. Microglial/macrophages were stained by Iba1 immunostaining. a Schematic representation of the infarct area at 2 levels of a coronal brain section and regions (red boxes) from which numbers of stained cells were estimated. c, cortex; CC, corpus callosum; V, ventricle; SVZ, subventricular zone. b Iba1 immunostaining in pMCAo + D mice, ramified Iba1+ cells in the peri-infarct area and amoeboid Iba1+ cells in the core of the infarct; scale bar: 100 μm. c In the peri-infarct area, microglia/macrophages density was significantly higher in pMCAo+D mice than in C, D (P < 0.0001) or pMCAo mice (P < 0.05). Cell density was higher in pMCAo mice than in C or D mice (P < 0.001). d No significant differences were evidenced in the contralateral mirror region of the infarct. e Iba1+ cell density was higher in ipsilateral striatum of pMCAo+D mice than for C mice and in pMCAo mice than for C mice (P < 0.05). f No significant differences in cell density were detected in contralateral striatum for the different animal groups.g No significant differences in cell density were evidenced in ipsilateral hippocampus. h Iba1+ cell density was higher in contralateral hippocampus of pMCAo mice than in C mice. P < 0.05, *P < 0.05, ***P < 0.001, ****P < 0.0001
Fig. 10
Fig. 10
White matter density, assessed by myelin basic protein (MBP) immunostaining, decreases in ipsi- and contralateral striatum of pMCAo mice, diabetic or not. a Schematic representation of a coronal brain section showing the infarct region, the striatum and regions (red boxes) from which white matter density was estimated. b MBP immunostaining in the ipsilateral striatum of a pMCAo+D mouse, scale bar: 500 μm. c In the ipsilateral striatum, MBP+ cell density was significantly lower in pMCAo+D mice than in C (P < 0.0001) or D mice (P < 0.01) and lower in pMCAo mice than in C mice (P < 0.001). d MBP+ cell density in contralateral striatum was significantly lower in pMCAo+D mice than C (P < 0.001) or D mice (P < 0.01) and lower in pMCAo mice than in C mice (P < 0.01). **P < 0.01, ***P < 0.001, ****P < 0.0001
Fig. 11
Fig. 11
Serum changes of the tryptophane (TRP) (a) and kynurenine (KYN) (b) concentrations, indoleamine 2, 3-dioxygenase (IDO) activity (c), kynurenic acid (KYNA) (d) and quinolinic acid (QUIN) (e) concentrations and QUIN/KYNA ratios (f) in patients without (C-) or with (C+) cognitive decline. There were no significant differences in serum TRP (a) or KYNA concentrations (d) between patients. Serum levels of KYN (b) (P < 0.01), IDO enzymatic activity (c) (P < 0.01), QUIN (e) (P < 0.001), and QUIN/KYNA (f) (P < 0.0001) were significantly elevated in the C+ group compared to the C- group. **P < 0.01, ***P < 0.001, ****P < 0.0001

Similar articles

Cited by

References

    1. Disease GB, Collaborators Global, regional, and national incidence, prevalence, and years lived with disability for 328 diseases and injuries for 195 countries, 1990–2016: a systematic analysis for the Global Burden of Disease Study 2016. Lancet. 2017;390:1211–1259. doi: 10.1016/S0140-6736(17)32154-2. - DOI - PMC - PubMed
    1. Kalaria RN, Akinyemi R, Ihara M. Stroke injury, cognitive impairment and vascular dementia. Biochim Biophys Acta. 2016;1862:915–925. doi: 10.1016/j.bbadis.2016.01.015. - DOI - PMC - PubMed
    1. Narayanan L, Murray AD. What can imaging tell us about cognitive impairment and dementia? World J Radiol. 2016;8:240–254. doi: 10.4329/wjr.v8.i3.240. - DOI - PMC - PubMed
    1. Korczyn AD, Vakhapova V, Grinberg LT. Vascular dementia. J Neurol Sci. 2012;322:2–10. doi: 10.1016/j.jns.2012.03.027. - DOI - PMC - PubMed
    1. Bowler JV, Hachinski V. Vascular cognitive impairment: a new approach to vascular dementia. Baillieres Clin Neurol. 1995;4:357–376. - PubMed

Publication types

LinkOut - more resources