. 2021 Apr 15;81(8):1965-1976.
doi: 10.1158/0008-5472.CAN-20-3213. Epub 2021 Feb 15.

Tet2 Inactivation Enhances the Antitumor Activity of Tumor-Infiltrating Lymphocytes

Affiliations

Tet2 Inactivation Enhances the Antitumor Activity of Tumor-Infiltrating Lymphocytes

Minjung Lee et al. Cancer Res. .

Abstract

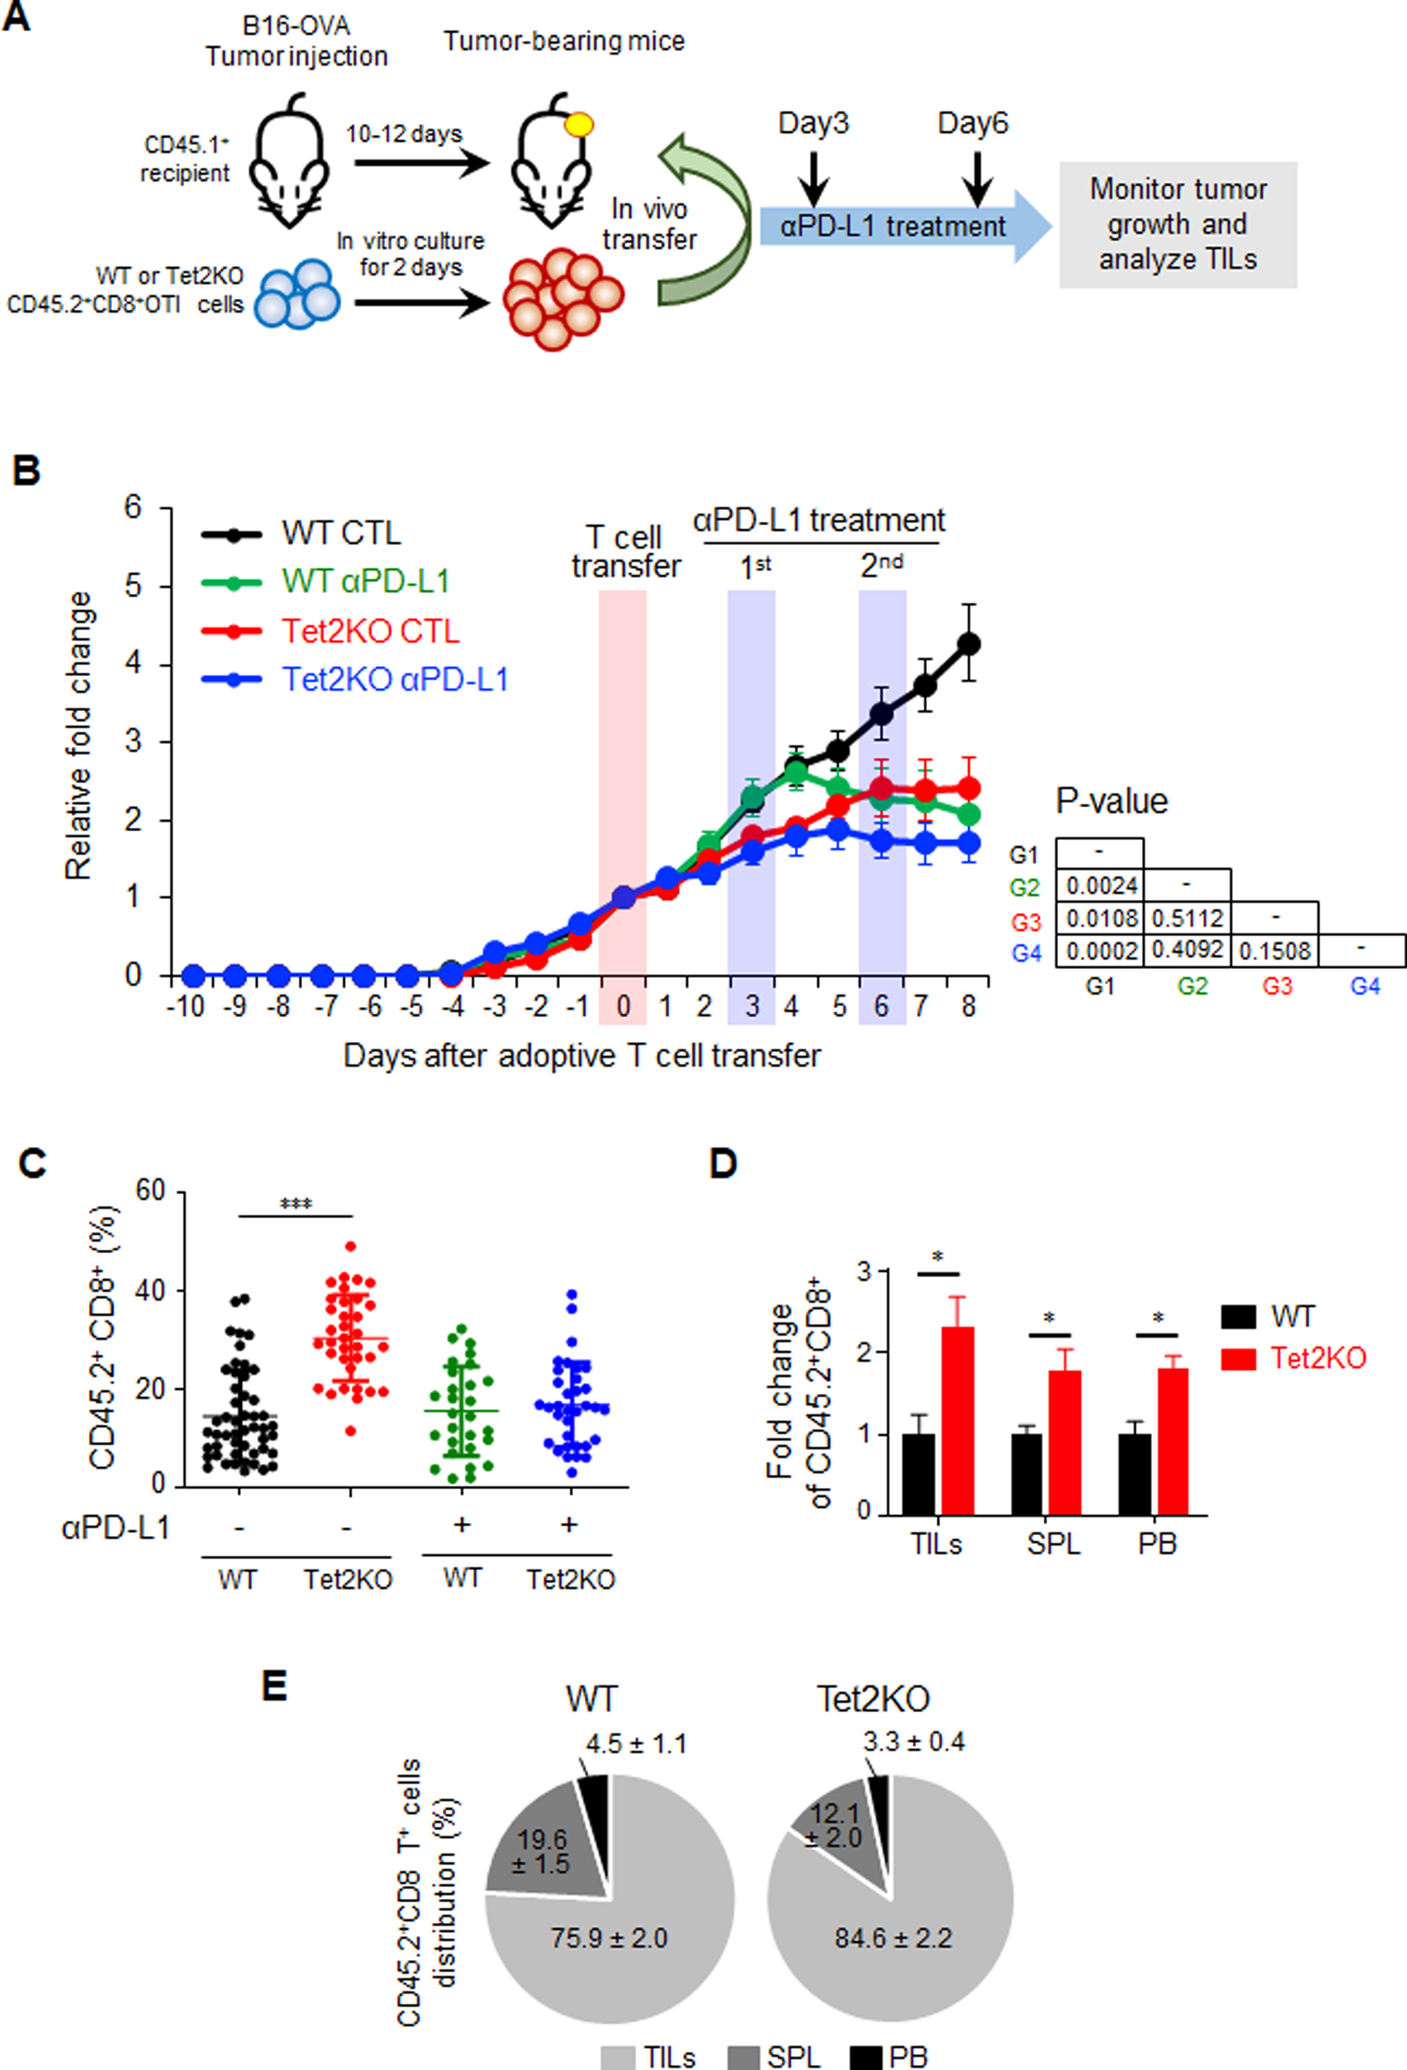
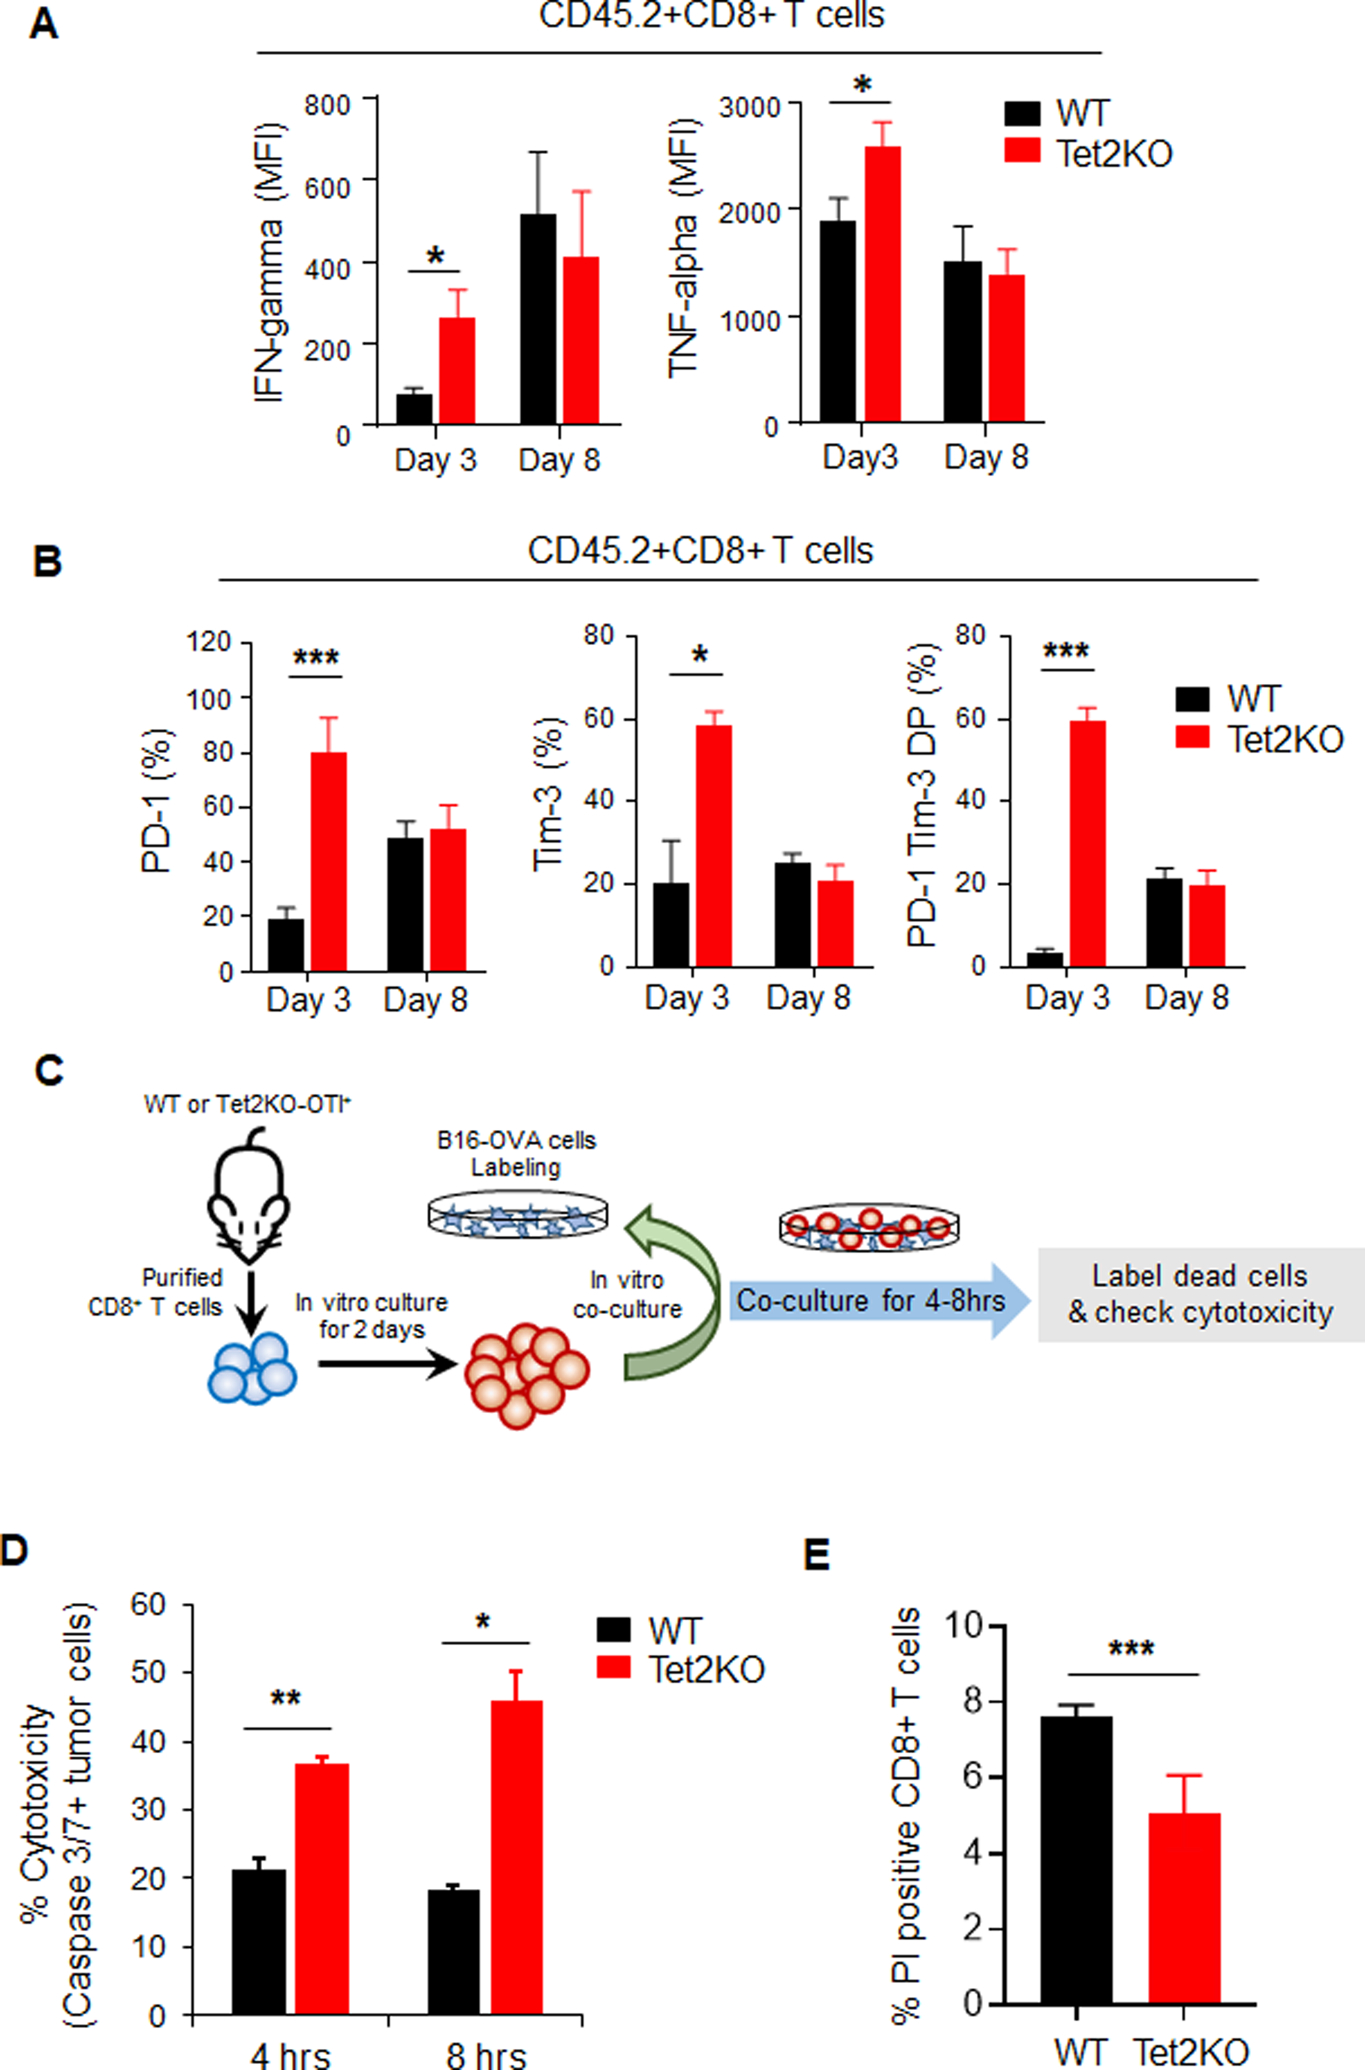
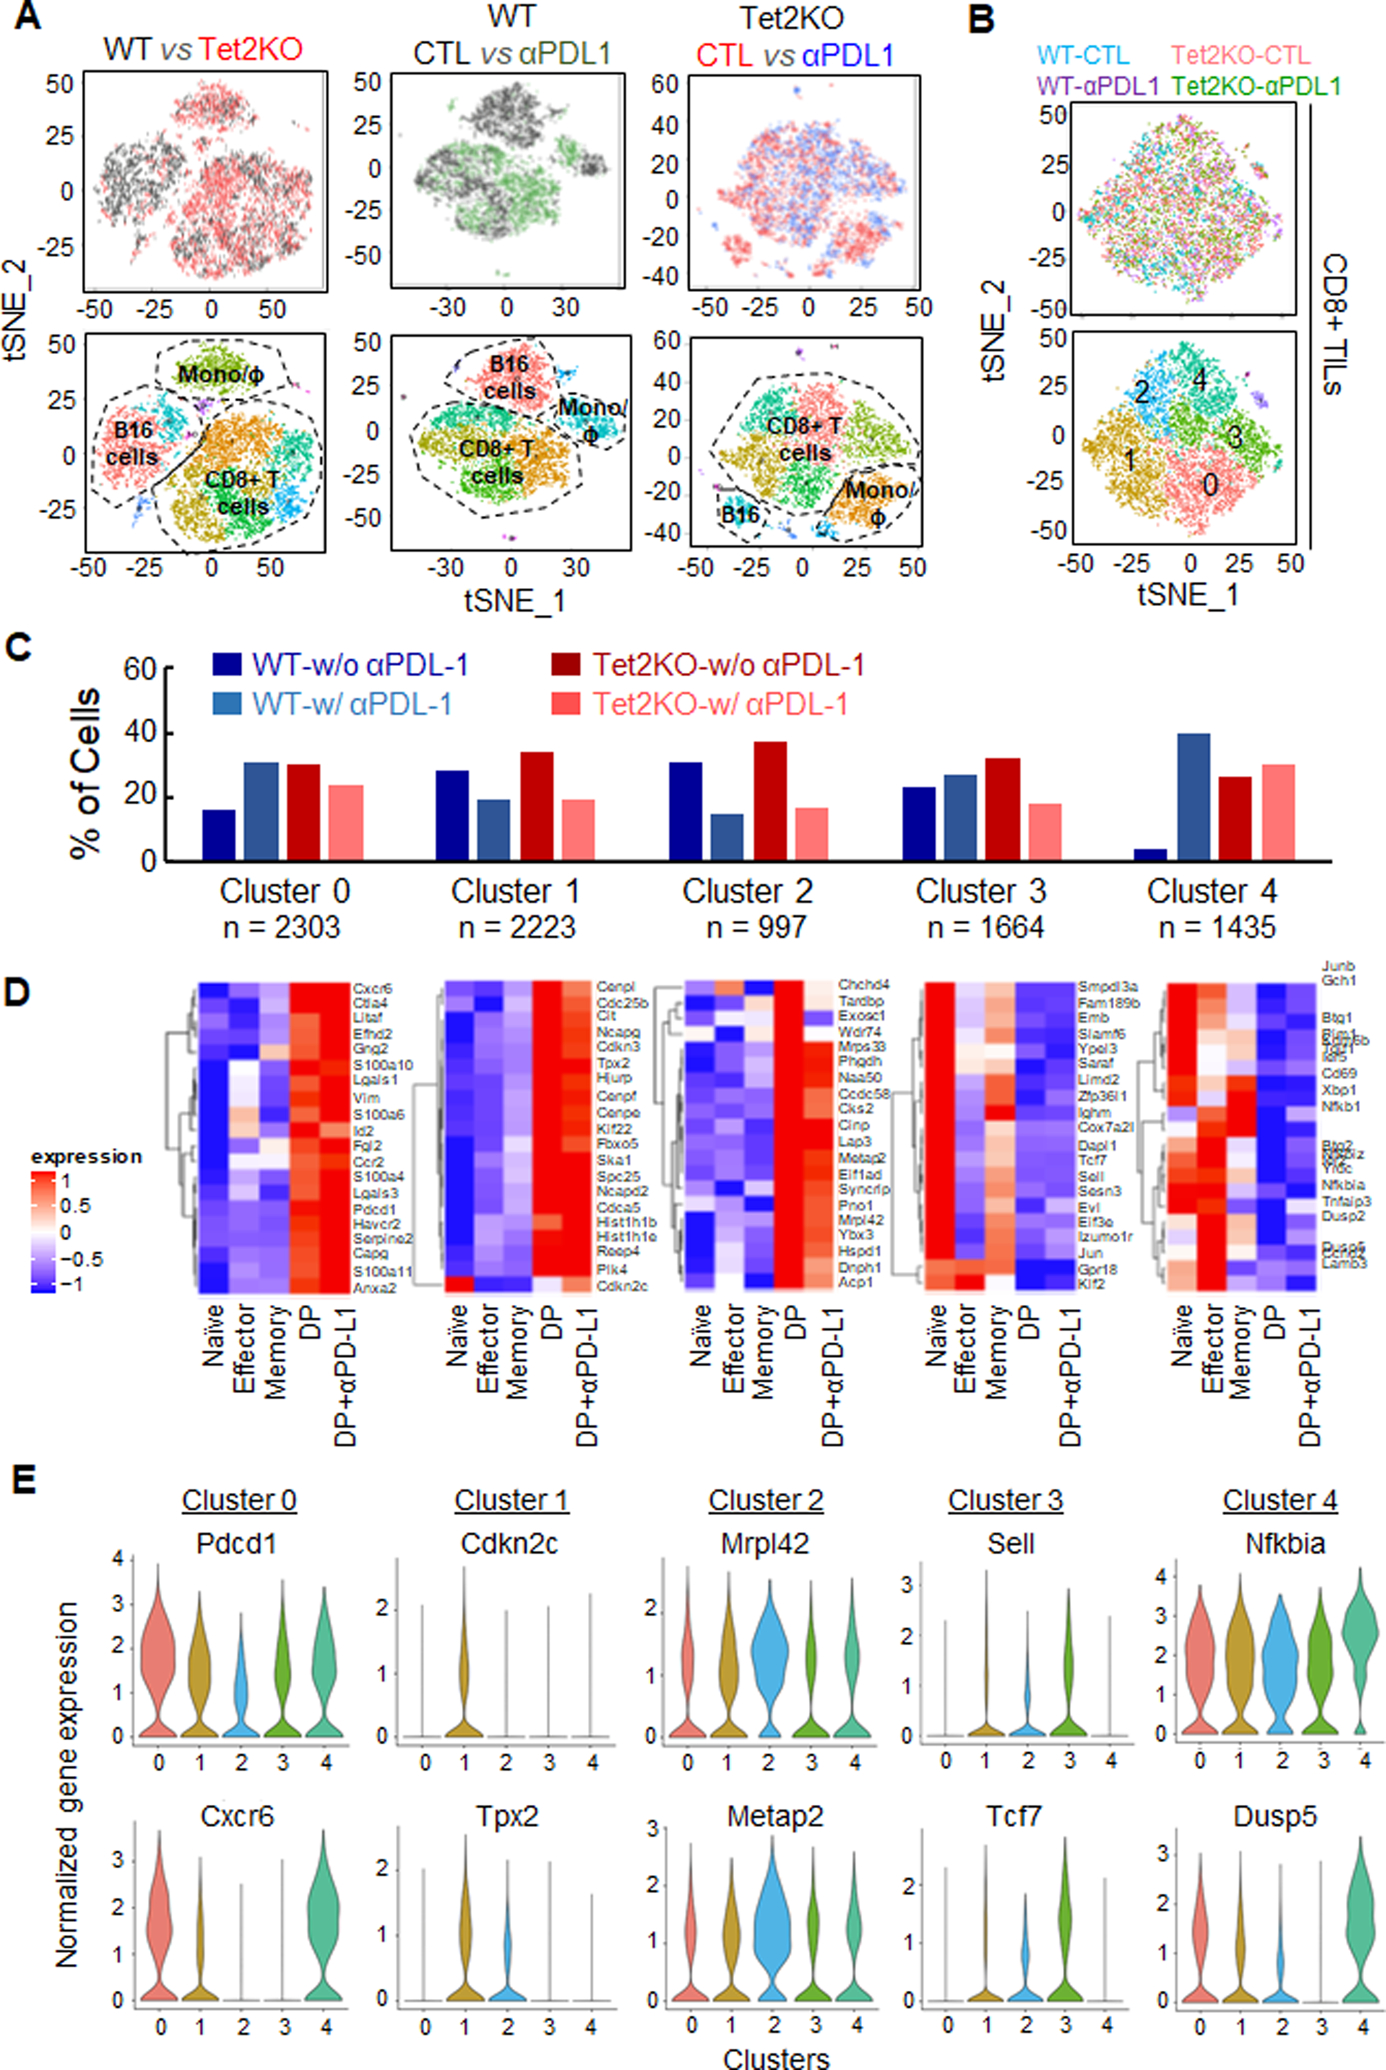
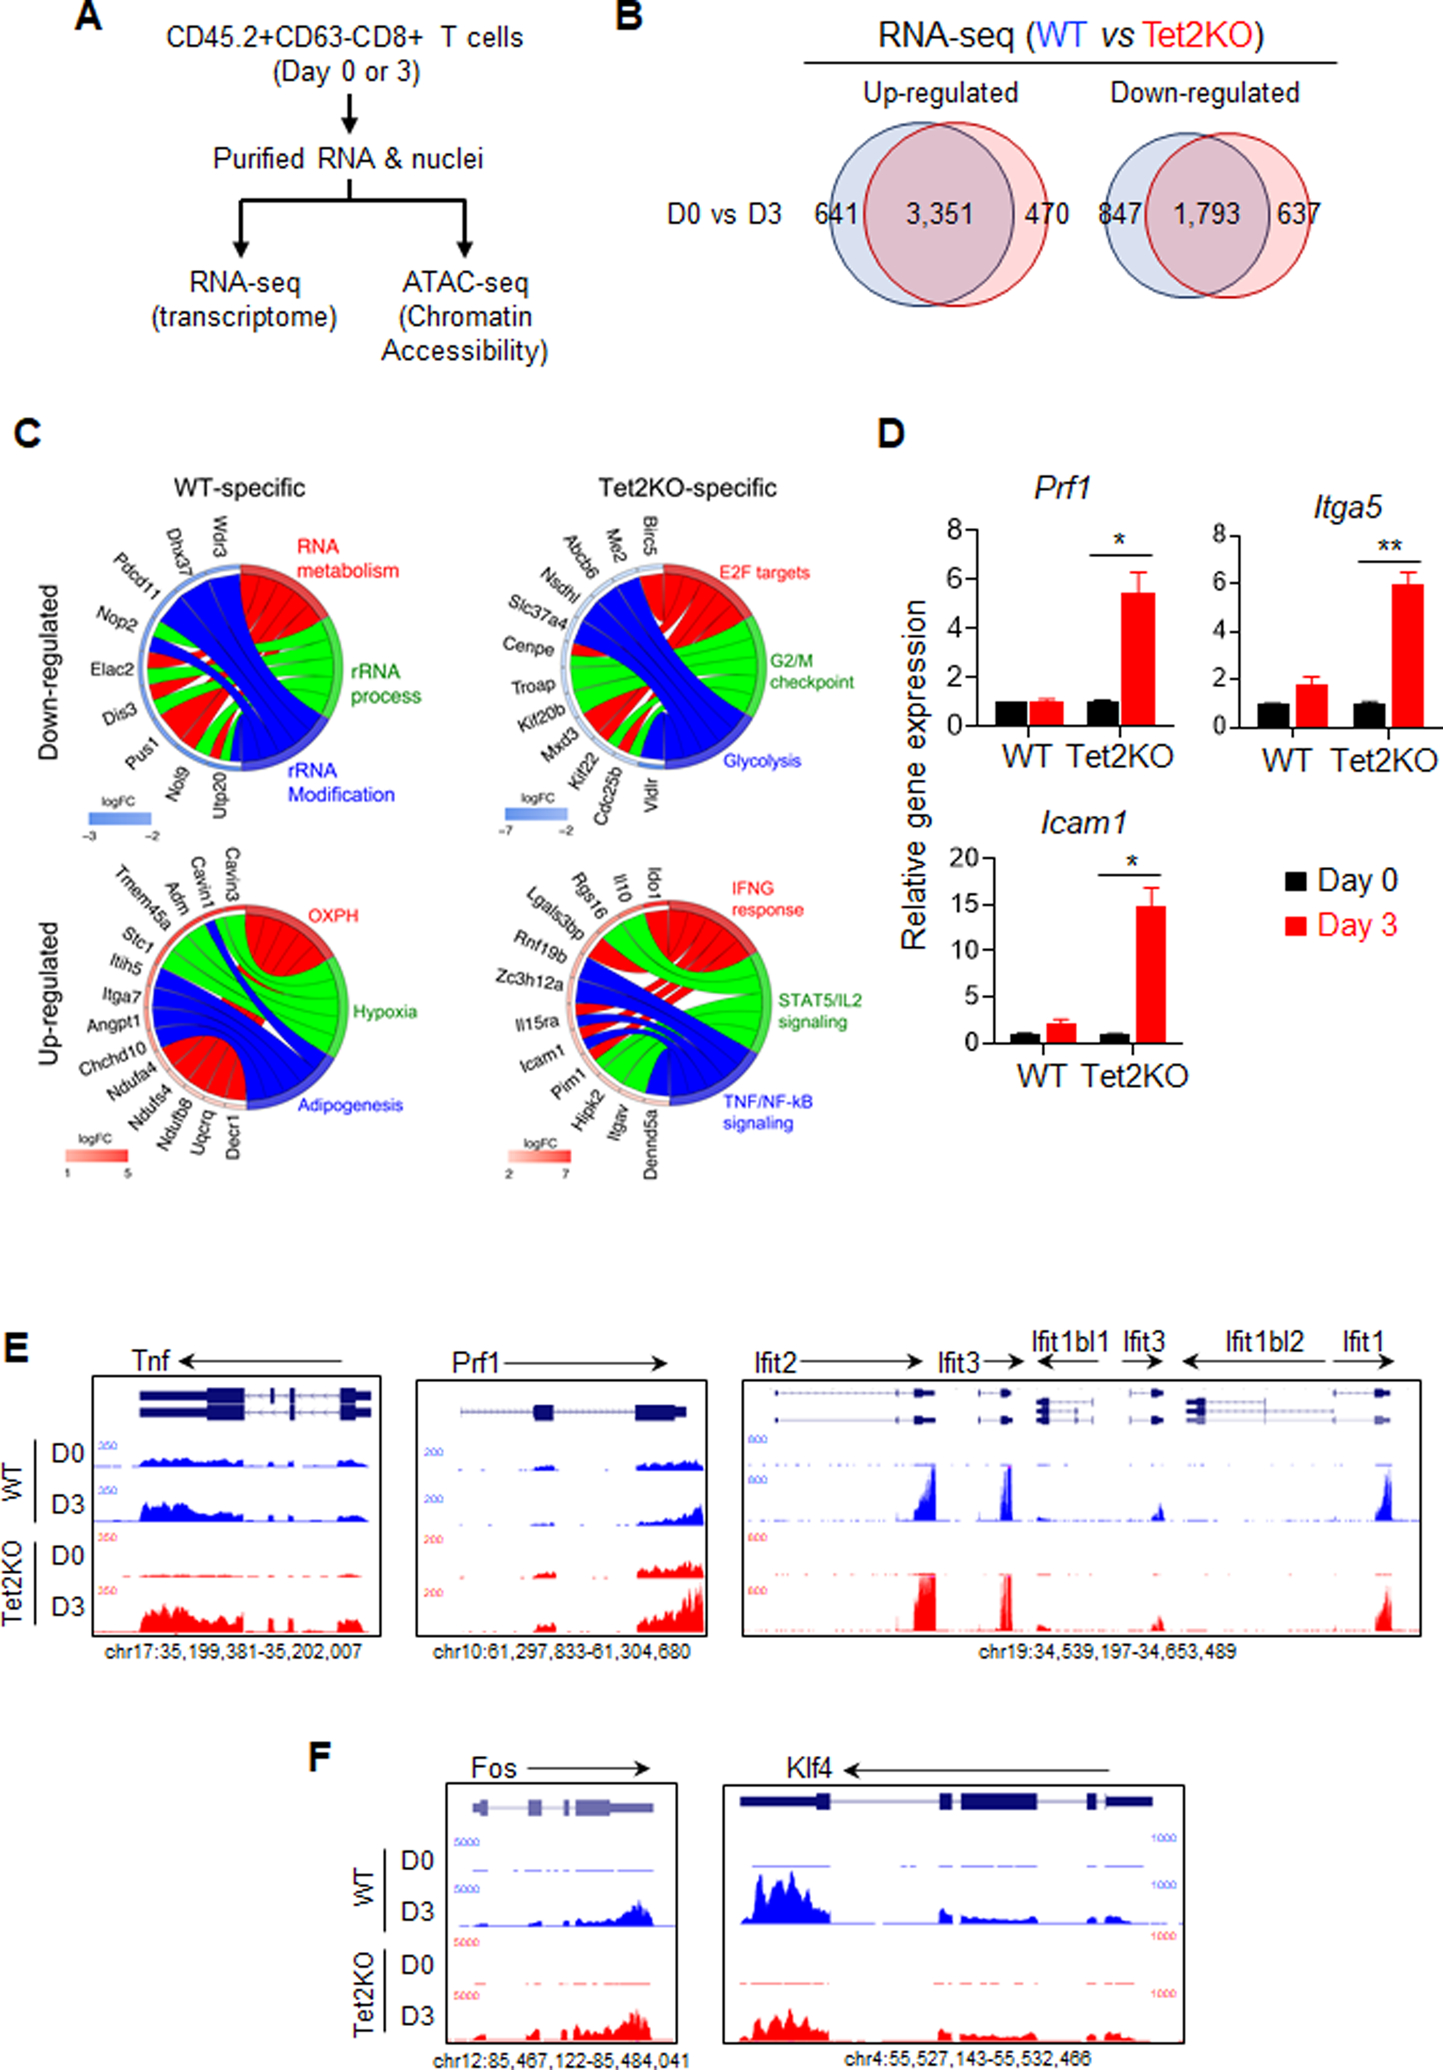
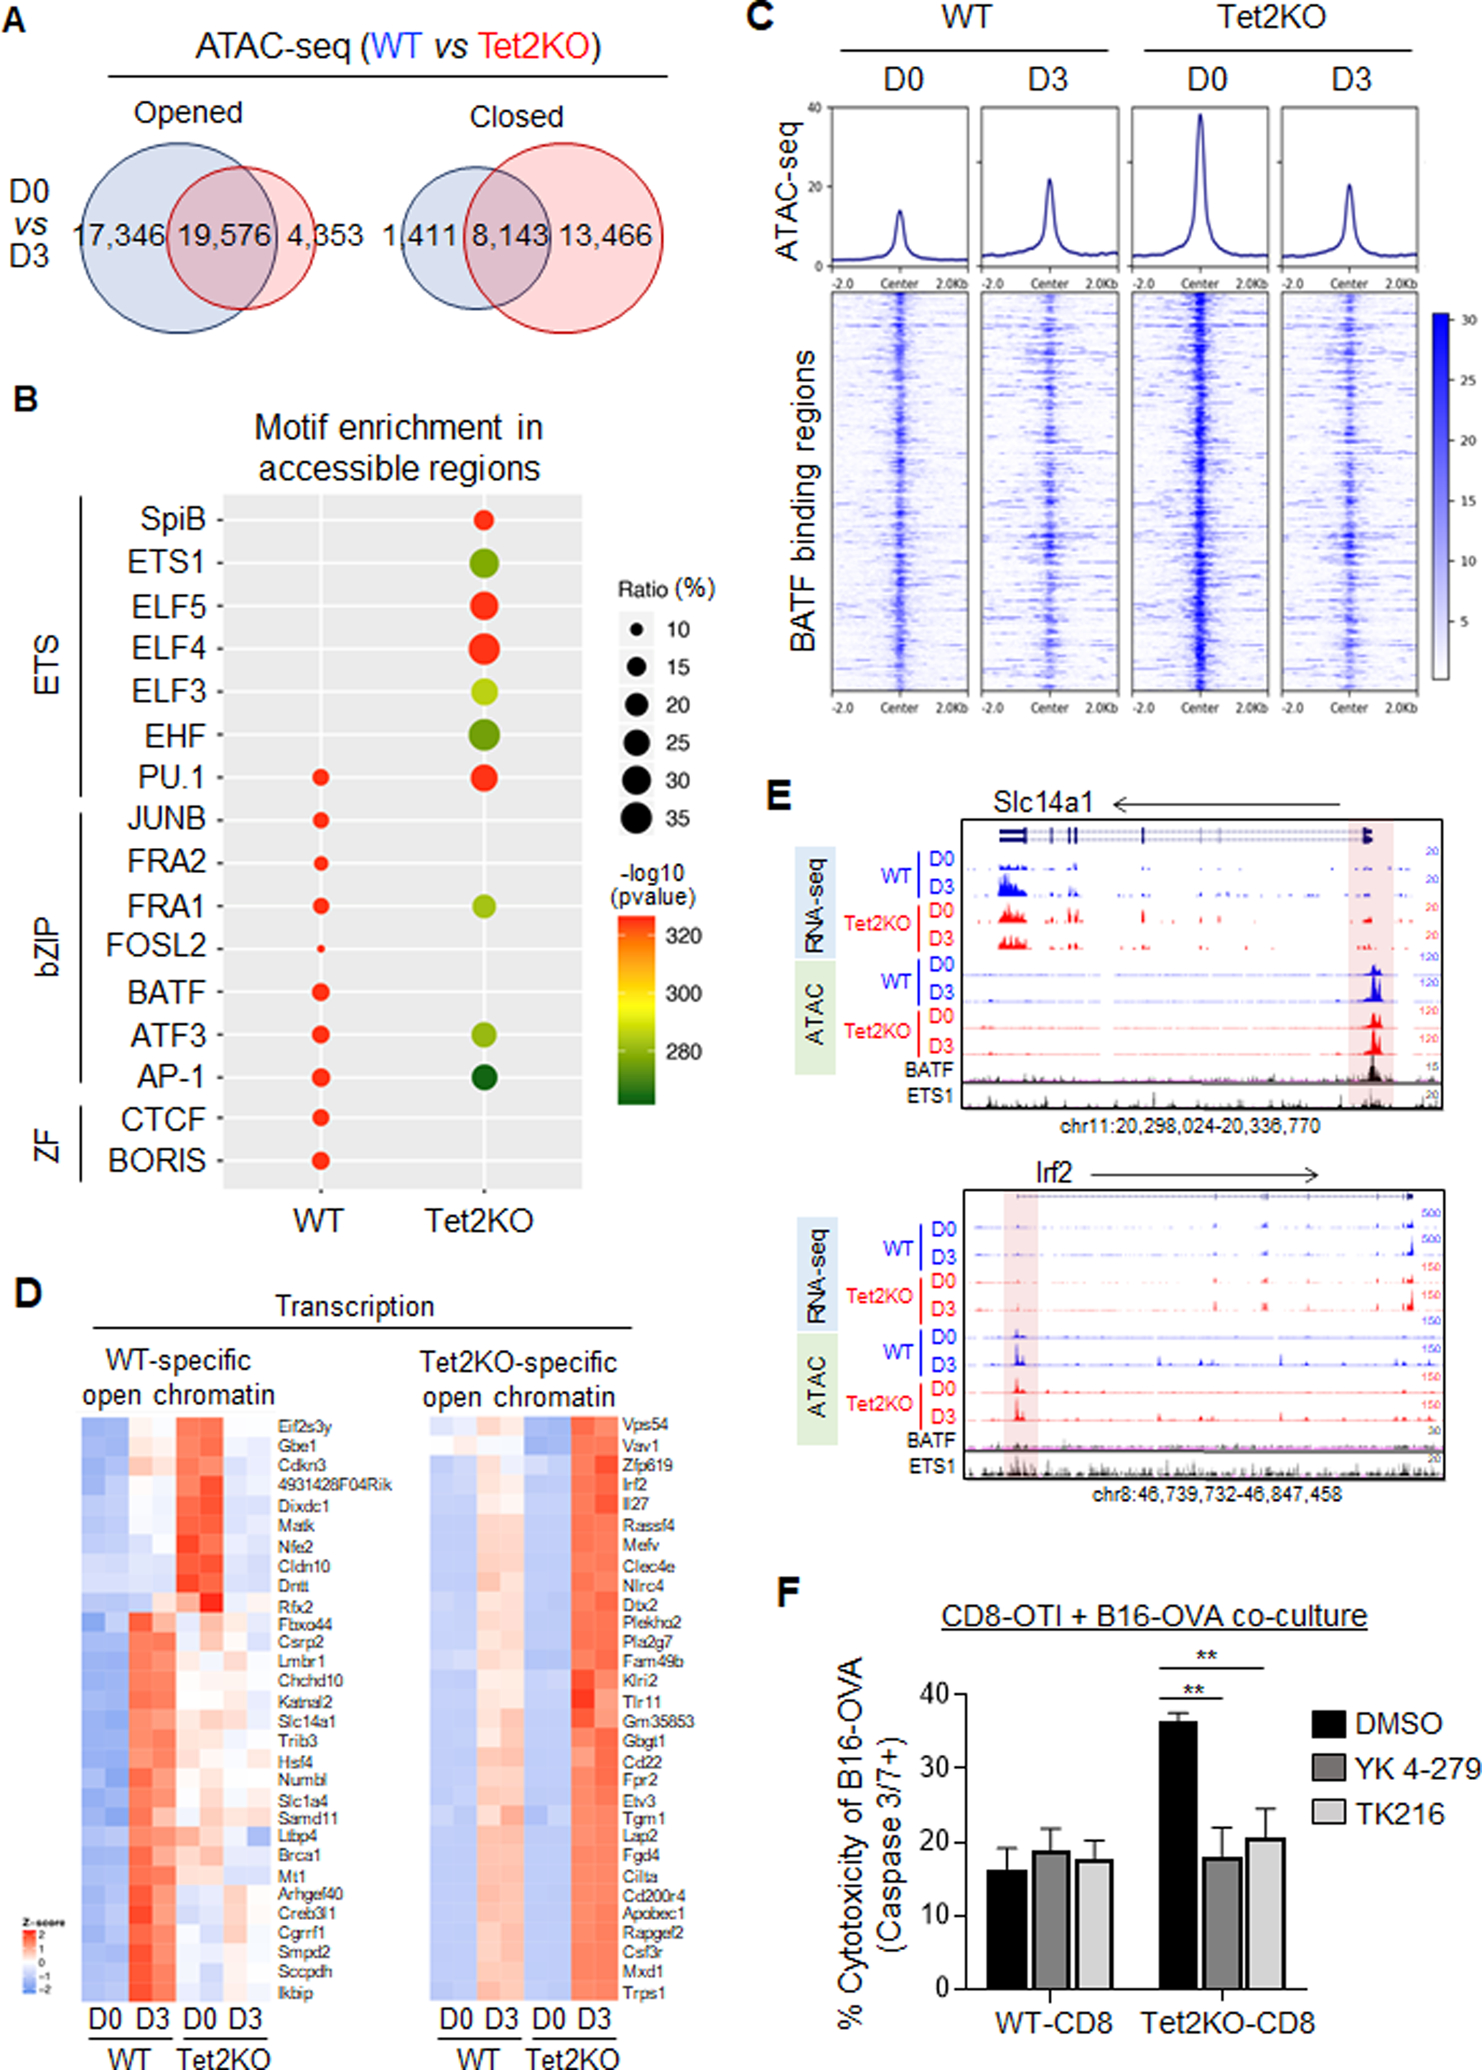
Inactivation of tumor-infiltrating lymphocytes (TIL) is one of the mechanisms mitigating antitumor immunity during tumor onset and progression. Epigenetic abnormalities are regarded as a major culprit contributing to the dysfunction of TILs within tumor microenvironments. In this study, we used a murine model of melanoma to discover that Tet2 inactivation significantly enhances the antitumor activity of TILs with an efficacy comparable to immune checkpoint inhibition imposed by anti-PD-L1 treatment. Single-cell RNA-sequencing analysis suggested that Tet2-deficient TILs exhibit effector-like features. Transcriptomic and ATAC-sequencing analysis showed that Tet2 ablation reshapes chromatin accessibility and favors binding of transcription factors geared toward CD8+ T-cell activation. Furthermore, the ETS family of transcription factors contributed to augmented CD8+ T-cell function following Tet2 depletion. Overall, our study establishes that Tet2 constitutes one of the epigenetic barriers that account for dysfunction of TILs and that Tet2 inactivation could promote antitumor immunity to suppress tumor growth. SIGNIFICANCE: This study suggests that ablation of TET2+ from TILs could promote their antitumor function by reshaping chromatin accessibility for key transcription factors and enhancing the transcription of genes essential for antitumor activity.


Conflict of interest statement

Disclosure of Conflicts of Interest: The authors declare no competing interests.

Figures

Figure 1.
Figure 1.. Tet2-deficient TILs exhibit enhanced anti-tumor activity in vivo.
A. Experimental design of adoptive transferring in vitro-generated OT-I CD8+ T cells (WT and Tet2KO; CD45.2+) into recipient mice (CD45.1+) bearing subcutaneous B16-OVA tumors. The mice were then treated with or without an anti-PD-L1 antibody at 3 and 6 days after T cell transfer. B. Quantification of B16-OVA melanoma tumor size in four experimental groups: WT control (CTL; black), WT with anti-PD-L1 treatment (green), Tet2KO (red), Tet2KO with anti-PD-L1 treatment (blue). Data were shown as mean ± S.D; n=16–27 mice; P values were listed on the right next to the curves (two-tailed Student’s t-test). C. Quantification of the percentage of CD45.2+CD8+ TILs (WT vs Tet2KO) in CD8+ T cells population with and without anti-PD-L1 treatment at 8 days after adoptive transfer. Data were shown as mean ± S.D; n=12–24 mice, ** P < 0.005 (two-tailed Student’s t-test). D. Comparison of the relative distribution of adoptively transferred WT (black) and Tet2KO (red) CD45.2+CD8+ cells in tumor (TILs), spleen (SPL) and peripheral blood (PB) at 8 days in the recipient mice. The data were shown as the fold change relative to WT in TILs, spleen and peripheral blood. Data were shown as mean ± S.D; n=6–11 mice, * p < 0.05, by two-tailed Student’s t-test. E. Percentage of adoptively transferred WT (left) and Tet2KO (right) CD45.2+CD8+ T cells within tumor (TILs), spleen (SPL) and peripheral blood (PB) at 8 days after adoptive transfer. Data were shown as mean ± S.D; n=6–11 mice.
Figure 2.
Figure 2.. Tet2-deficient TILs show enhanced immune response and cytotoxicity at the early stage of tumorigenesis.
A-B. Quantification of the percentage of IFN-γ or TNF-α (A), or PD-1/Tim-3 (B) positive populations in adoptively transferred WT (black) and Tet2KO (red) CD45.2+CD8+ T cells at 3 and 8 days in the recipient mice. Data were shown as mean ± S.D; n=7–22, * P < 0.05, *** P < 0.0001, by two-tailed Student’s t-test. C. Experimental design for the in vitro co-culture cytotoxicity assay. In vitro cultured B16-OVA cells were labeled with cell proliferation dye and co-cultured with WT or Tet2KO CD8+ T cells for 4–8 hours. The cytotoxicity of CD8+ T cells were quantified by measuring the caspase 3/7 positive B16-OVA cells using flow cytometry. D. Quantification of caspase 3/7 positive B16-OVA melanoma cells co-cultured with WT (black) and Tet2KO (red) CD8+ T cells for 4 and 8 hrs in vitro. Data were shown as mean ± S.D; n=3, * P < 0.05, ** P < 0.005, by two-tailed Student’s t-test. E. The quantification of flow cytometry analysis of Propidium Iodide (PI) staining in WT and Tet2KO CD8+OTI T cells co-cultured with B16-OVA cells for 4 hrs. Data were shown as mean ± S.D; n=3, *** P < 0.0001, by two-tailed Student’s t-test.
Figure 3.
Figure 3.. Single-cell RNA-seq (scRNA-seq) reveals enhanced activation of Tet2KO TILs.
A. tSNE plots of scRNA-seq data obtained from CD45.2+CD8+ TILs (WT or Tet2KO) purified 8 days after adoptive transfer, treated with or without anti-PD-L1. Top: tSNE plot comparison between the indicated experimental groups. Bottom: the matched tSNE plots with identified cell populations. B. The tSNE plots (top) and clustering analysis (bottom) of CD8α-expressing cells in the indicated TILs purified 8 days after adoptive transfer. C. The percentage of cells from four experimental groups (WT control, WT anti-PD-L1, Tet2KO control, and Tet2KO anti-PD-L1) within each cluster identified from panel B. The total cell number within each cluster was listed at the bottom. D. Heatmaps showing the differential expression of signature genes in each cluster identified from Figure 3B in the indicated cell populations. DP: PD1+Tim3+ double positive CD8+ T cells. E. Violin plots showing the distribution of normalized expression levels of representative cluster specific genes.
Figure 4.
Figure 4.. Tet2 deletion enhances the transcription of tumor-suppressive genes in TILs.
A. The experimental design for comparative RNA-seq and ATAC-seq analyses. B. Venn diagrams showing WT- and Tet2-specific differentially expressed genes (DEGs) identified between Day 0 and Day 3 adoptively transferred TILs (WT vs Tet2KO). C. GOplot illustrating the top 5 genes in the top three categories from the GSEA analysis of WT- and Tet2-specific DEGs. The left side of the circle displays the DEGs and color represents the log2 fold change (logFC). Red, upregulated genes; Blue, downregulated genes. The right side of the circle shows the GSEA categories. D. Real-time quantitative PCR validation of selected DEGs annotated as regulators of immune response. E-F. The UCSC genome browser view of RNA-seq data for representative genes that are involved in CD8+ T cell immunity and are up-regulated in the Tet2KO group.
Figure 5.
Figure 5.. Tet2 knockout reshapes the chromatin accessibility in TILs.
A. Venn diagrams showing WT- and Tet2-specific differential chromatin accessible regions identified in the indicated groups. B. The top 10 significantly enriched transcription factor binding motifs within the WT- and Tet2-specific differential chromatin accessible regions. C. The enrichment of chromatin accessibility within BATF binding regions in WT and Tet2KO TILs at day 0 and day 3 after adoptive transfer. D. Heatmap representation of gene expression for the top 30 selected genes that displayed increased chromatin accessibility in either WT (left) or Tet2KO (right) TILs (day 3 group compared with day 0). E. The UCSC genome browser view of RNA-seq and ATAC-seq results for representative genes listed in Figure 5D. The published BATF and ETS1 ChIP-seq data were also included. The highlighted regions were promoter regions of the indicated genes. F. Quantification of caspase 3/7 positive B16-OVA melanoma cells co-cultured with WT or Tet2KO CD8+ T cells for 4 hrs in the presence of DMSO or ETS inhibitors (100 nM YK-4–279 or 500 nM TK-216). Data were shown as mean ± S.D; n=8, ** P < 0.005, by two-tailed Student’s t-test.

References

    1. Yang R, Cheng S, Luo N, Gao R, Yu K, Kang B, et al. Distinct epigenetic features of tumor-reactive CD8+ T cells in colorectal cancer patients revealed by genome-wide DNA methylation analysis. Genome Biol 2019;21:2. - PMC - PubMed
    1. Philip M, Fairchild L, Sun L, Horste EL, Camara S, Shakiba M, et al. Chromatin states define tumour-specific T cell dysfunction and reprogramming. Nature 2017;545:452–6 - PMC - PubMed
    1. Scharer CD, Barwick BG, Youngblood BA, Ahmed R, Boss JM. Global DNA methylation remodeling accompanies CD8 T cell effector function. J Immunol 2013;191:3419–29 - PMC - PubMed
    1. Ghoneim HE, Fan Y, Moustaki A, Abdelsamed HA, Dash P, Dogra P, et al. De Novo Epigenetic Programs Inhibit PD-1 Blockade-Mediated T Cell Rejuvenation. Cell 2017;170:142–57 e19 - PMC - PubMed
    1. Ahn E, Youngblood B, Lee J, Lee J, Sarkar S, Ahmed R. Demethylation of the PD-1 Promoter Is Imprinted during the Effector Phase of CD8 T Cell Exhaustion. J Virol 2016;90:8934–46 - PMC - PubMed

Publication types

MeSH terms