. 2021 Feb;9(2):e001749.
doi: 10.1136/jitc-2020-001749.

Therapeutic depletion of CCR8+ tumor-infiltrating regulatory T cells elicits antitumor immunity and synergizes with anti-PD-1 therapy

Affiliations

Therapeutic depletion of CCR8+ tumor-infiltrating regulatory T cells elicits antitumor immunity and synergizes with anti-PD-1 therapy

Helena Van Damme et al. J Immunother Cancer. 2021 Feb.

Abstract

Background: Modulation and depletion strategies of regulatory T cells (Tregs) constitute valid approaches in antitumor immunotherapy but suffer from severe adverse effects due to their lack of selectivity for the tumor-infiltrating (ti-)Treg population, indicating the need for a ti-Treg specific biomarker.

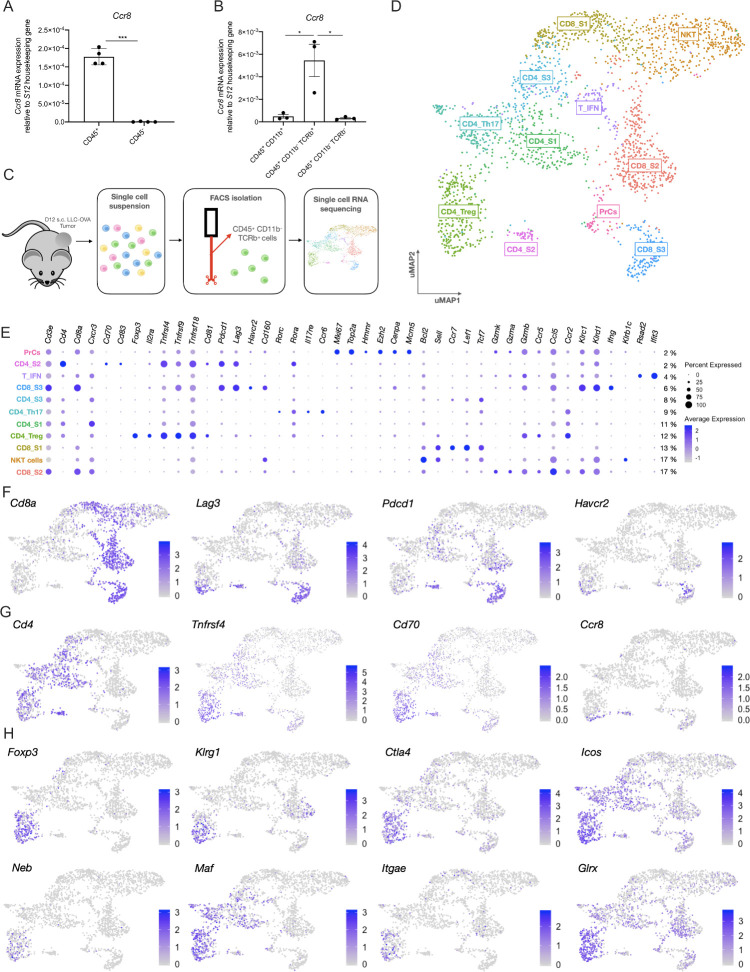
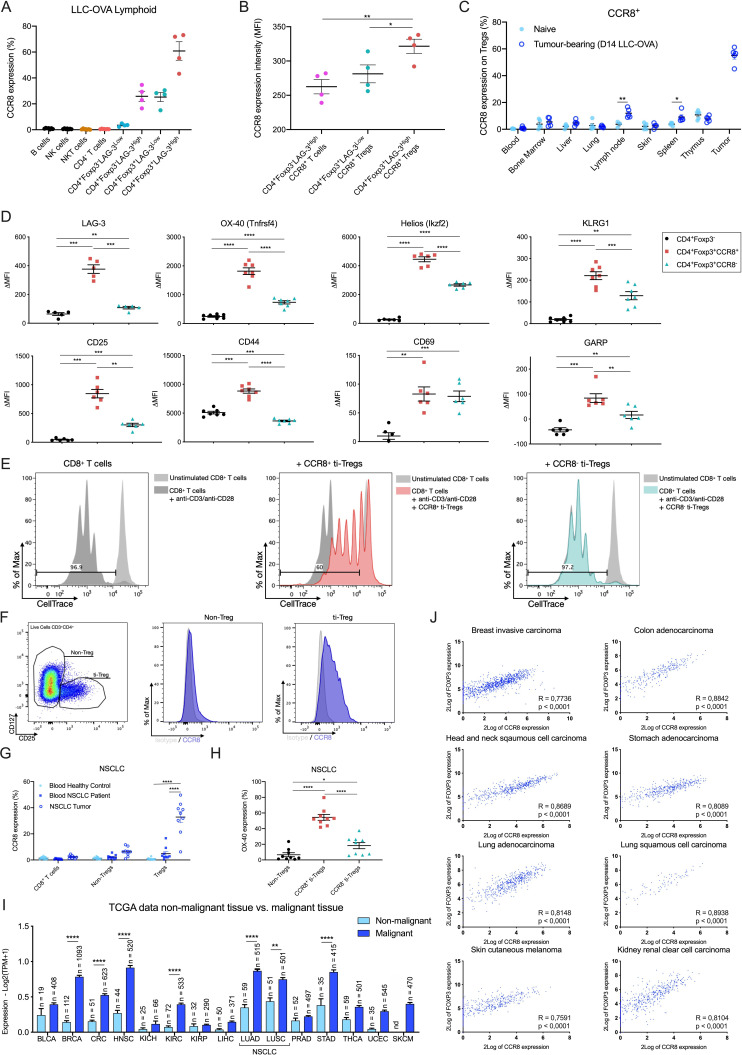
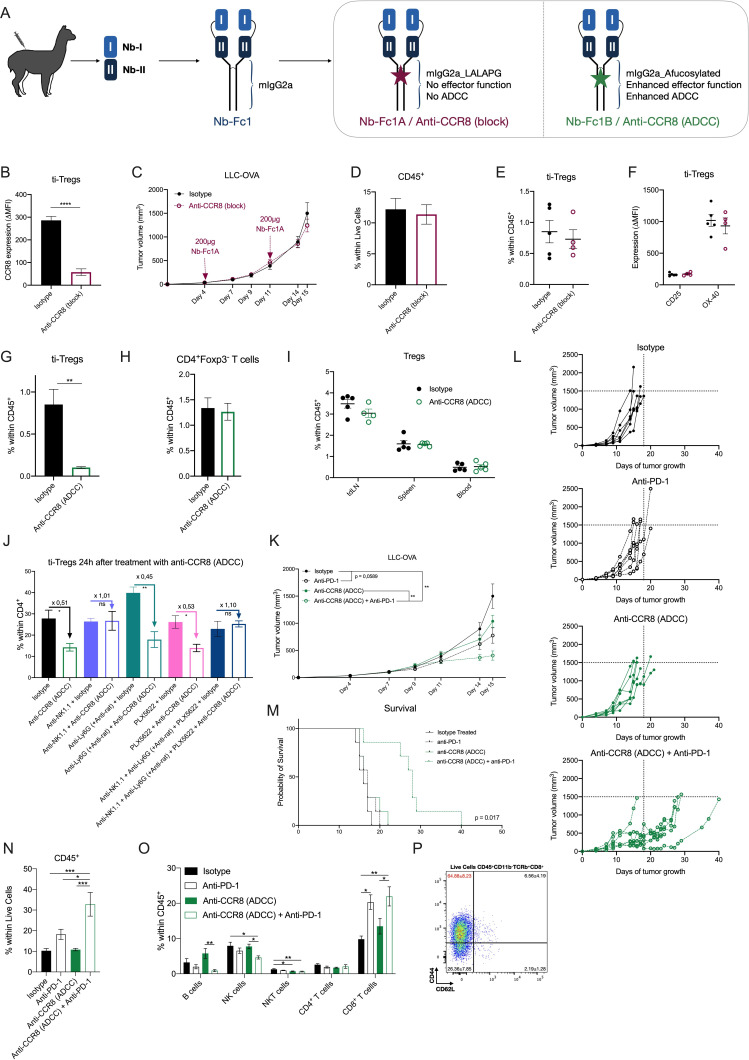
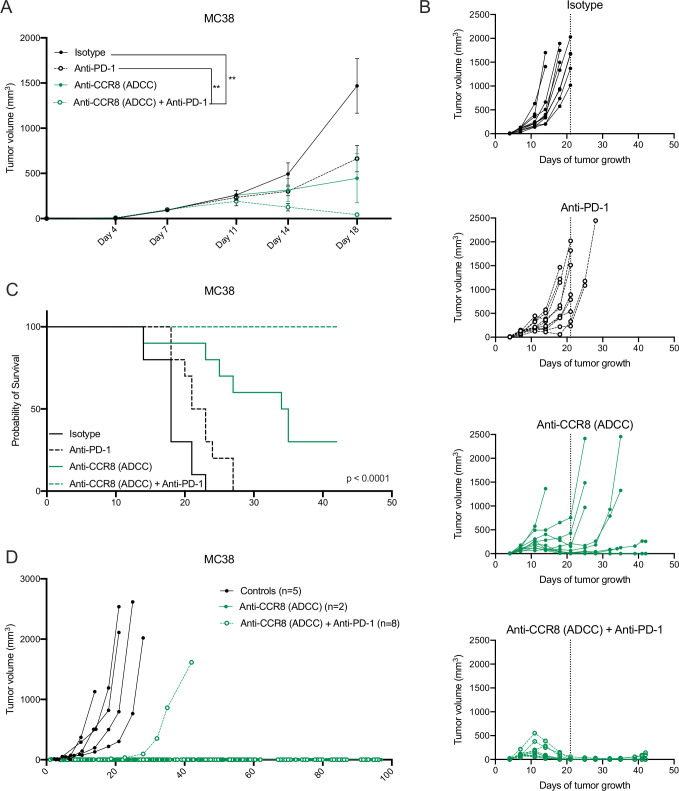
Methods: We employed single-cell RNA-sequencing in a mouse model of non-small cell lung carcinoma (NSCLC) to obtain a comprehensive overview of the tumor-infiltrating T-cell compartment, with a focus on ti-Treg subpopulations. These findings were validated by flow cytometric analysis of both mouse (LLC-OVA, MC38 and B16-OVA) and human (NSCLC and melanoma) tumor samples. We generated two CCR8-specific nanobodies (Nbs) that recognize distinct epitopes on the CCR8 extracellular domain. These Nbs were formulated as tetravalent Nb-Fc fusion proteins for optimal CCR8 binding and blocking, containing either an antibody-dependent cell-mediated cytotoxicity (ADCC)-deficient or an ADCC-prone Fc region. The therapeutic use of these Nb-Fc fusion proteins was evaluated, either as monotherapy or as combination therapy with anti-programmed cell death protein-1 (anti-PD-1), in both the LLC-OVA and MC38 mouse models.

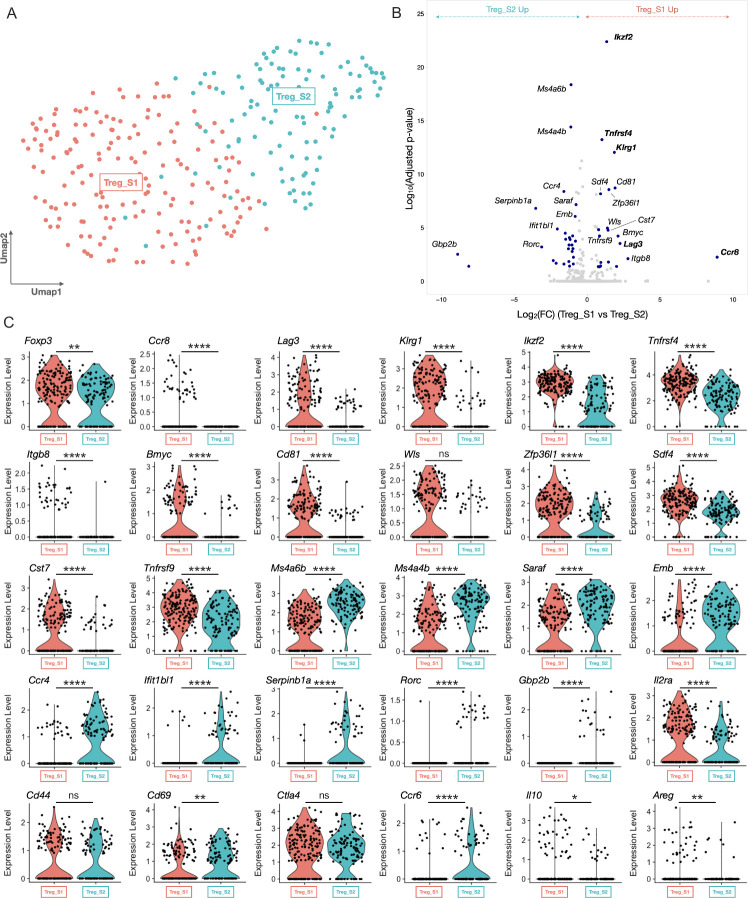
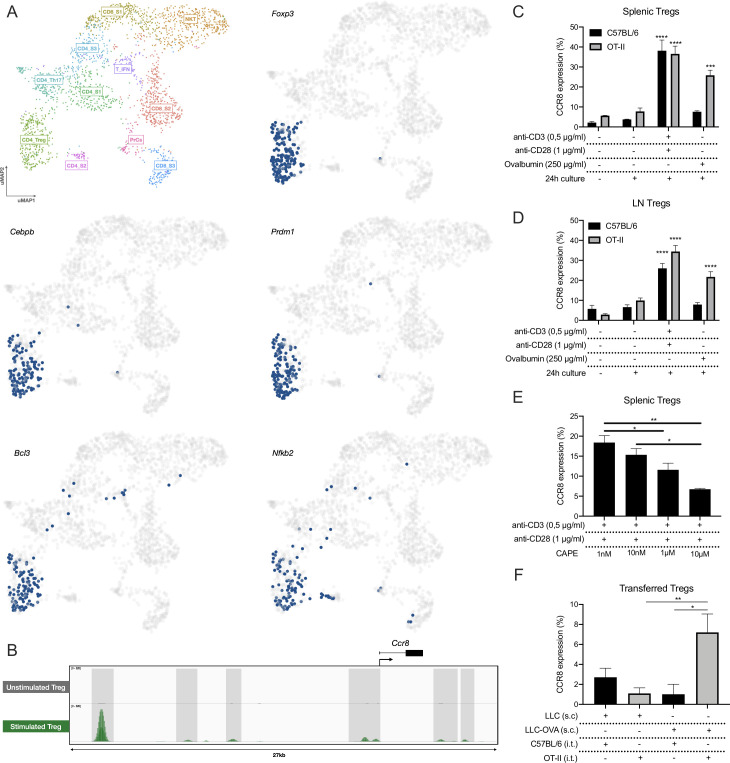
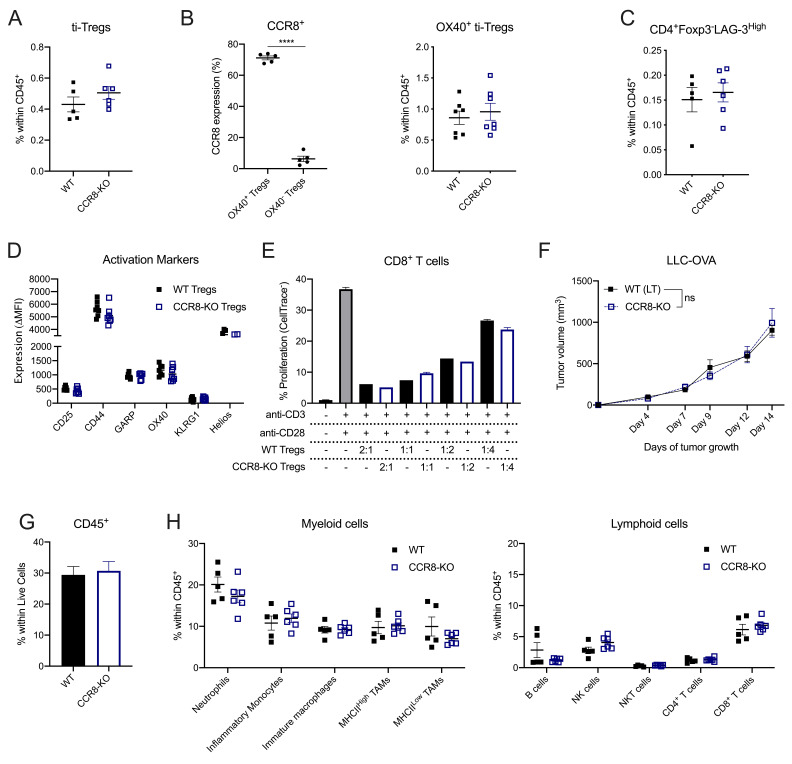
Results: We were able to discern two ti-Treg populations, one of which is characterized by the unique expression of Ccr8 in conjunction with Treg activation markers. Ccr8 is also expressed by dysfunctional CD4+ and CD8+ T cells, but the CCR8 protein was only prominent on the highly activated and strongly T-cell suppressive ti-Treg subpopulation of mouse and human tumors, with no major CCR8-positivity found on peripheral Tregs. CCR8 expression resulted from TCR-mediated Treg triggering in an NF-κB-dependent fashion, but was not essential for the recruitment, activation nor suppressive capacity of these cells. While treatment of tumor-bearing mice with a blocking ADCC-deficient Nb-Fc did not influence tumor growth, ADCC-prone Nb-Fc elicited antitumor immunity and reduced tumor growth in synergy with anti-PD-1 therapy. Importantly, ADCC-prone Nb-Fc specifically depleted ti-Tregs in a natural killer (NK) cell-dependent fashion without affecting peripheral Tregs.

Conclusions: Collectively, our findings highlight the efficacy and safety of targeting CCR8 for the depletion of tumor-promoting ti-Tregs in combination with anti-PD-1 therapy.

Keywords: biomarkers; immunologic; immunotherapy; lymphocytes; receptors; tumor; tumor-infiltrating.


Conflict of interest statement

Competing interests: HR and EA are employees of Oncurious NV. PM is a consultant to Oncurious NV.

Figures

Figure 1
Figure 1
Single cell RNA-seq analysis of the LLC-OVA tumor-infiltrating T-cell compartment. (A) Ccr8 expression in the CD45+ hematopoietic cell subset and CD45 non-hematopoietic cell subset of LLC-OVA tumors measured via qRT-PCR (n=4). (B) Ccr8 expression in the CD45+CD11b+, CD45+CD11bTCRβ+ and CD45CD11bTCRβ cell subsets measured via qRT-PCR (n=3). (C) Schematic overview of the single cell RNA-seq experiment. (D) UMAP plot of 2.603 WT NKT/T cells isolated from s.c. LLC-OVA tumors revealing the presence of 11 T-cell subsets. (E) Dot plot showing the relative gene expression of several signature genes within the distinct T-cell subsets. The size of the dots relates to the % positive cells within each T-cell population. The color code relates to the relative expression level of the gene. (F) UMAP plots showing expression of several key marker genes of the CD8_S3 subset. (G) UMAP plots showing expression of several key marker genes of the CD4_S2 subset. (H) UMAP plots showing expression of several key marker genes of the CD4_Treg subset. (A, B) Data shown as mean±SEM. (A) ***p<0.001 by paired Student’s t-test, (B) *p<0.05 by one-way ANOVA. ANOVA, analysis of variance; LLC, Lewis Lung Carcinoma; mRNA, messenger RNA; NK, natural killer; s.c., subcutaneously; Treg, regulatory T cell; UMAP, Uniform Manifold Approximation and Projection; WT, wild type.
Figure 2
Figure 2
Single cell RNA-seq analysis of the ti-Tregs. (A) UMAP plot of 289 ti-Tregs isolated from s.c. LLC-OVA tumors revealing the existence of two ti-Treg subsets. (B) Volcano plot showing the genes that are differentially expressed between Treg_S1 and Treg_S2. (C) Violin plots showing expression of several key marker genes of the Tregs_S1 (red) and Treg_S2 (turquoise) subsets. (C) *p<0.05, **p<0.01 and ****p<0.0001 by unpaired Student’s t-test. LLC, Lewis Lung Carcinoma; s.c., subcutaneously; ti-Treg, tumor-infiltrating regulatory T cell; UMAP, Uniform Manifold Approximation and Projection.
Figure 3
Figure 3
CCR8 is mainly expressed on the highly activated ti-Tregs. (A) Percentage CCR8+cells within different LLC-OVA tumor-infiltrating lymphoid cell subsets as measured via flow cytometry (n=5). (B) CCR8 expression level (MFI) on the CCR8+ tumor-infiltrating T-cell populations as measured via flow cytometry (n=4). (C) Percentage CCR8+cells within Tregs in different organs of tumor-bearing (dark blue) and naive C57BL/6 mice (light blue) as measured via flow cytometry (n=5). (D) Expression (ΔMFI) of LAG-3, OX-40, Helios, KLRG1, CD25, CD44, CD69 and GARP in the CD4+Foxp3- (black circle), CD4+Foxp3+CCR8+ (red square) and CD4+Foxp3+CCR8- (turquoise triangle) T-cell subsets as determined via flow cytometry (n=6). (E) Treg suppression assay. Splenic CD8+ T-cell proliferation after stimulation (anti-CD3+anti-CD28) in the presence of CCR8+ (red) or CCR8 (turquoise) ti-Tregs at a ratio of one ti-Treg for five splenic T cells (1:5). (F) Representative flow cytometry plots showing Isotype/CCR8 expression (MFI) by non-Tregs and ti-Tregs of NSCLC patients. (G) Percentage CCR8+cells within different lymphoid subsets found in the blood or tumors of patients with NSCLC or healthy volunteers as measured via flow cytometry (n=9-11). (H) Percentage OX-40+cells within different lymphoid subsets found in the tumors of patients with NSCLC as measured via flow cytometry (n=9). (I) Expression of the CCR8 gene within cancerous and surrounding healthy tissue of bladder urothelial carcinoma (BLCA), breast invasive carcinoma (BRCA), colorectal cancer (CRC), head and neck squamous cell carcinoma (HNSC), kidney chromophobe (KICH), kidney renal clear cell carcinoma (KIRC), kidney renal papillary cell carcinoma (KIRP), liver hepatocellular carcinoma (LIHC), lung adenocarcinoma (LUAD), lung squamous cell carcinoma (LUSC), prostate adenocarcinoma (PRAD), stomach adenocarcinoma (STAD), thyroid carcinoma (THCA), uterine corpus endometrial carcinoma (UCEC) and skin cutaneous melanoma (SKCM) (data retrieved from TCGA). (J) Correlation between the expression of FOXP3 and CCR8 in different human tumors (data retrieved from TCGA). (A to D and G to I) Data shown as mean±SEM. (B, D, G, H) *p<0.05, **p<0.01, ***p<0.001 and ****p<0.0001 by one-way ANOVA, (C, I) *p<0.05, **p<0.01 and ****p<0.0001 by (un)paired Student’s t-test. ANOVA, analysis of variance; LLC, Lewis Lung Carcinoma; NK, natural killer; NSCLC, non-small cell lung carcinoma; TCGA, The Cancer Genome Atlas; ti-Treg, tumor-infiltrating regulatory T cell.
Figure 4
Figure 4
CCR8 upregulation is induced by TCR stimulation. (A) UMAP plots showing the activity of the Foxp3, Cebpb, Prdm1, Bcl3 and Nfkb2 regulons within the distinct T-cell subsets, cells in which the regulons are active are indicated in blue. (B) ChIP-seq (p65) signal profiles across the Ccr8 locus. Data obtained from Oh et al. Peaks that are gained after Treg stimulation are highlighted (gray). (C) Percentage CCR8+ cells within C57BL/6 or OT-II splenic Tregs after 24 hours of in vitro co-culture with TCR stimulants (anti-CD3 +anti-CD28) or Chicken ovalbumin (OVA) (n=3). (D) Percentage CCR8+ cells within C57BL/6 or OT-II LN-derived Tregs after 24 hours of in vitro co-culture with TCR stimulants (anti-CD3+anti-CD28) or Chicken ovalbumin (OVA) (n=3). (E) Percentage CCR8+ cells within C57BL/6 splenic Tregs after 24 hours of in vitro co-culture with TCR stimulants (anti-CD3+anti-CD28) and distinct concentrations of CAPE (n=4). (F) Percentage CCR8+ cells within transferred C57BL/6 or OT-II splenic Tregs 48 hours after intratumoral (i.t.) adoptive transfer into LLC or LLC-OVA tumors (n=3). (C to F) Data shown as mean±SEM. (C, D) ***p<0.001 and ****p<0.0001 by one-way ANOVA where each condition was compared with prior to culture, (E, F) *p<0.05 and **p<0.01 by one-way ANOVA. ANOVA, analysis of variance; LLC, Lewis Lung Carcinoma; UMAP, Uniform Manifold Approximation and Projection.
Figure 5
Figure 5
CCR8 is redundant for the functionality of ti-Tregs. (A) Percentage of Foxp3+ Tregs within the CD45+ population of LLC-OVA tumors in CCR8-KO (blue) and WT littermate (black) control mice (n=5–6). (B) Percentage of OX-40+ Tregs and OX-40 Tregs that stains positive for CCR8 expression (n=5-6) (and) Percentage of OX-40+ Tregs within the CD45+ population of D14 LLC-OVA tumors in WT littermate (black) and CCR8-KO (blue) mice (n=7). (C) Percentage of CD4+Foxp3LAG-3high cells within the CD45+ population of LLC-OVA tumors in CCR8-KO (blue) and WT littermate (black) control mice (n=7). (D) Comparison of activation marker expression between ti-Tregs of the WT (black) and CCR8-KO (blue) TME in LLC-OVA tumors (n=7). (E) Treg suppression assay. Splenic CD8+ T-cell proliferation after stimulation (anti-CD3 + anti-CD28) in the presence of WT (black) or CCR8-KO (blue) ti-Tregs at distinct ti-Treg:splenic T cell ratios. (F) Tumor growth of s.c. injected LLC-OVA in CCR8-KO (blue) and WT littermate (black) control mice (n=7). (G) Influx of CD45+ cells within the TME of D13 LLC-OVA tumors grown in CCR8-KO (blue) or WT littermate (black) control mice (n=5-6). (H) Influx of distinct myeloid cell types (% of CD45+ cells) and lymphoid cell types (% of CD45+ cells) within the TME of D13 LLC-OVA tumors grown in CCR8-KO (blue) versus WT littermate (black) control mice (n=5–6). (A to H) Data shown as mean±SEM. (A to E, G, H) ****p<0.0001 by unpaired Student’s t-test, (F) by two-way ANOVA with Holm-Sidak multiple comparisons test. ANOVA, analysis of variance; LLC, Lewis LungCarcinoma; NK, natural killer; s.c., subcutaneously; TME, tumor microenvironment; ti-Treg, tumor-infiltrating regulatory T cell; WT, wild type.
Figure 6
Figure 6
Specific depletion of CCR8+ ti-Tregs, but not CCR8 blockade, results in reduced LLC-OVA tumor growth and synergizes with anti-PD-1 therapy. (A) Schematic overview of tetravalent Nb-Fc generation. (B) Delta-MFI of CCR8 expression on ti-Tregs of isotype (black) or anti-CCR8 (block) (red) treated mice (n=5). (C) LLC-OVA tumor growth in isotype (black) or anti-CCR8 (block)-treated mice (red) (n=12). (D) Percentage of CD45+ hematopoietic cells within the TME of D16 LLC-OVA tumors of isotype (black) or anti-CCR8 (block)-treated mice (red) (n=5). (E) Percentage of CD4+Foxp3+ Tregs within the CD45+ compartment of D16 LLC-OVA tumors of isotype (black) or anti-CCR8 (block)-treated mice (red) (n=5). (F) Activation marker expression determined via flow cytometry, on ti-Tregs of D16 LLC-OVA tumors of isotype (black) or anti-CCR8 (block)-treated mice (red) (n=5). (G) Percentage of CD4+Foxp3+ Tregs within the CD45+ compartment of D16 LLC-OVA tumors of isotype (black) or anti-CCR8 (ADCC)-treated mice (green) (n=5). (H) Percentage of CD4+Foxp3 T cells within the CD45+ compartment of D16 LLC-OVA tumors of isotype (black) or anti-CCR8 (ADCC)-treated mice (green) (n=5). (I) Percentage of CD4+Foxp3+ Tregs within the CD45+ compartment of distinct organs of isotype (black) or anti-CCR8 (ADCC)-treated (green) LLC-OVA tumor-bearing mice (n=5). (J) Percentage of CD4+Foxp3+ Tregs within the CD4+ compartment of D12 LLC-OVA tumors treated with isotype control or anti-CCR8 (ADCC) in combination with anti-NK1.1, anti-Ly6G (+ anti-rat) and/or PLX5622 (n=4). (K) s.c. LLC-OVA tumor growth in mice treated with isotype (black, closed circle), anti-PD-1 (black, open circle), anti-CCR8 (ADCC) (green, closed circle) or the combination of anti-PD-1 and anti-CCR8 (ADCC) (green, open circle) (n=12). (L) Growth of individual subcutaneous LLC-OVA tumors in mice treated with isotype (black, closed circle), anti-PD-1 (black, open circle), anti-CCR8 (ADCC) (green, closed circle) or the combination of anti-PD-1 and anti-CCR8 (ADCC) (green, open circle) (n=7). (M) Survival (tumor volume <1500 mm3) of LLC-OVA tumor-bearing mice treated with isotype (black, solid line), anti-PD-1 (black, dotted line), anti-CCR8 (ADCC) (green, solid line) or the combination of anti-PD-1 and anti-CCR8 (ADCC) (green, dotted line) (n=7). (N) Percentage of CD45+ hematopoietic cells within the TME of LLC-OVA tumors grown in mice treated with isotype, anti-PD-1, anti-CCR8 (ADCC) or the combination of anti-PD-1 and anti-CCR8 (ADCC) (n=5). (O) Percentage of distinct lymphocyte populations within the CD45+ compartment of LLC-OVA tumors grown in mice treated with isotype, anti-PD-1, anti-CCR8 (ADCC) or the combination of anti-PD-1 and anti-CCR8 (ADCC) (n=5). (P) Representative FACS plot showing the expression level of CD44 and CD62L on the CD8+ T cells within the TME of mice treated with a combination of anti-PD-1 and anti-CCR8 (ADCC) (n=5). (B to K, N to P) Data shown as mean±SEM. (B, D to J) *p<0.05, **p<0.01 and ****p<0.0001 by unpaired Student’s t-test, (C. K) **p<0.01 by two-way ANOVA with Holm-Sidak multiple comparisons test, (N, O) *p<0.05, **p<0.01 and ***p<0.001 by one-way ANOVA. ADCC, antibody-dependent cell-mediated cytotoxicity; anti-PD-1, anti-programmed cell death protein-1; ANOVA, analysis of variance; LLC, Lewis Lung Carcinoma; MFI, median fluorescence intensity; NK, natural killer; s.c., subcutaneously; ti-Treg, tumor-infiltrating regulatory T cell.
Figure 7
Figure 7
Specific depletion of CCR8+ ti-Tregs reduces MC38 tumor growth as monotherapy and synergizes with anti-PD-1 therapy. (A) s.c. MC38 tumor growth in mice treated with isotype (black, closed circle), anti-PD-1 (black, open circle), anti-CCR8 (ADCC) (green, closed circle) or the combination of anti-PD-1 and anti-CCR8 (ADCC) (green, open circle) (n=10). (B) Tumor growth of individual subcutaneous MC38 tumors grown in mice treated with isotype (black, closed circle), anti-PD-1 (black, open circle), anti-CCR8 (ADCC) (green, closed circle) or the combination of anti-PD-1 and anti-CCR8 (ADCC) (green, open circle) (n=10). (C) Survival (tumor volume <1500 mm3) of MC38 tumor-bearing mice treated with isotype (black, solid line), anti-PD-1 (black, dotted line), anti-CCR8 (ADCC) (green, solid line) or the combination of anti-PD-1 and anti-CCR8 (ADCC) (green, dotted line) (n=10). (D) Individual tumor volumes in mice subcutaneously re-challenged with MC38 after complete tumor regression on treatment with anti-CCR8 (ADCC) (green, closed circle) (n=2) or the combination of anti-PD-1 and anti-CCR8 (ADCC) (green, open circle) (n=8). (A) Data shown as mean±SEM. (A) **p<0.01 by two-way ANOVA with Holm-Sidak multiple comparisons test. ADCC, antibody-dependent cell-mediated cytotoxicity; anti-PD-1, anti-programmed cell death protein-1; ANOVA, analysis of variance; s.c., subcutaneously.

References

    1. Sakaguchi S, Yamaguchi T, Nomura T, et al. . Regulatory T cells and immune tolerance. Cell 2008;133:775–87. 10.1016/j.cell.2008.05.009 - DOI - PubMed
    1. Wang L, Simons DL, Lu X, et al. . Connecting blood and intratumoral Treg cell activity in predicting future relapse in breast cancer. Nat Immunol 2019;20:1220–30. 10.1038/s41590-019-0429-7 - DOI - PMC - PubMed
    1. Curiel TJ, Coukos G, Zou L, et al. . Specific recruitment of regulatory T cells in ovarian carcinoma fosters immune privilege and predicts reduced survival. Nat Med 2004;10:942–9. 10.1038/nm1093 - DOI - PubMed
    1. Chaudhary B, Elkord E. Regulatory T cells in the tumor microenvironment and cancer progression: role and therapeutic targeting. Vaccines 2016;4:28. 10.3390/vaccines4030028 - DOI - PMC - PubMed
    1. Tanaka A, Sakaguchi S. Targeting Treg cells in cancer immunotherapy. Eur J Immunol 2019;49:eji.201847659 10.1002/eji.201847659 - DOI - PubMed

Publication types

MeSH terms