. 2021 Feb 15;12(2):180.
doi: 10.1038/s41419-021-03465-6.

Neuroinflammation induces synaptic scaling through IL-1β-mediated activation of the transcriptional repressor REST/NRSF

Affiliations

Neuroinflammation induces synaptic scaling through IL-1β-mediated activation of the transcriptional repressor REST/NRSF

Federica Buffolo et al. Cell Death Dis. .

Erratum in

Abstract

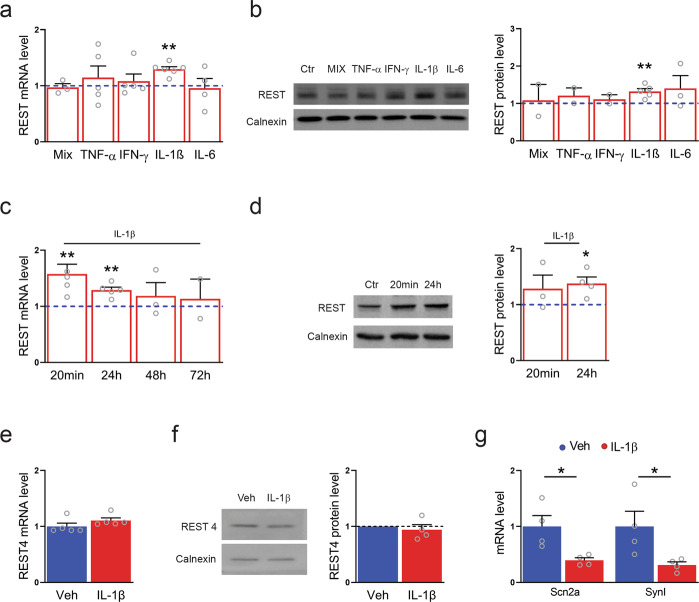
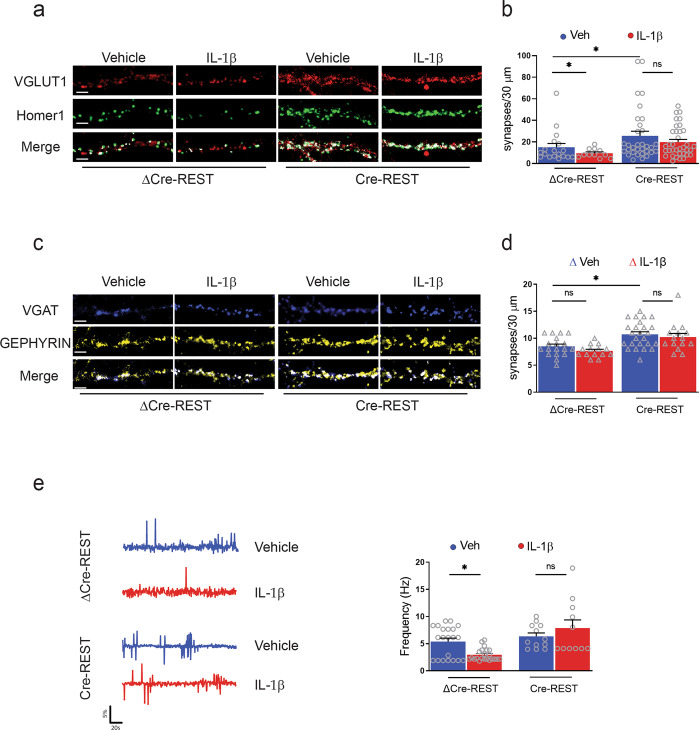
Neuroinflammation is associated with synapse dysfunction and cognitive decline in patients and animal models. One candidate for translating the inflammatory stress into structural and functional changes in neural networks is the transcriptional repressor RE1-silencing transcription factor (REST) that regulates the expression of a wide cluster of neuron-specific genes during neurogenesis and in mature neurons. To study the cellular and molecular pathways activated under inflammatory conditions mimicking the experimental autoimmune encephalomyelitis (EAE) environment, we analyzed REST activity in neuroblastoma cells and mouse cortical neurons treated with activated T cell or microglia supernatant and distinct pro-inflammatory cytokines. We found that REST is activated by a variety of neuroinflammatory stimuli in both neuroblastoma cells and primary neurons, indicating that a vast transcriptional change is triggered during neuroinflammation. While a dual activation of REST and its dominant-negative splicing isoform REST4 was observed in N2a neuroblastoma cells, primary neurons responded with a pure full-length REST upregulation in the absence of changes in REST4 expression. In both cases, REST upregulation was associated with activation of Wnt signaling and increased nuclear translocation of β-catenin, a well-known intracellular transduction pathway in neuroinflammation. Among single cytokines, IL-1β caused a potent and prompt increase in REST transcription and translation in neurons, which promoted a delayed and strong synaptic downscaling specific for excitatory synapses, with decreased frequency and amplitude of spontaneous synaptic currents, decreased density of excitatory synaptic connections, and decreased frequency of action potential-evoked Ca2+ transients. Most important, the IL-1β effects on excitatory transmission were strictly REST dependent, as conditional deletion of REST completely occluded the effects of IL-1β activation on synaptic transmission and network excitability. Our results demonstrate that REST upregulation represents a new pathogenic mechanism for the synaptic dysfunctions observed under neuroinflammatory conditions and identify the REST pathway as therapeutic target for EAE and, potentially, for multiple sclerosis.


Conflict of interest statement

The authors declare no competing interests.

Figures

Fig. 1
Fig. 1. Exposure to activated T cell supernatant differentially regulates alternative splicing of REST in N2a cells and primary cortical neurons.
ad Differentiated N2a cells were exposed to either activated (Stim) or non-activated (NS) T cell supernatant for 24 h. a, b qRT-PCR (left) and western blotting analysis (right) were used to assess full-length REST (a) and REST4 (b) expression. c, d Analysis of nSR100 (c) and nuclear β-catenin (d) signals in Stim N2a cells compared to the control condition. eh The same experimental procedures were carried out for primary cortical neurons. e, f qRT-PCR (left panels) and western blotting analysis (right panels) were used to assess REST (e) and REST4 (f) expression. g, h nSR100 (g) and nuclear β-catenin (h) signals in Stim neurons as compared to the control condition. Gapdh, Actin, and Hprt1 were used as housekeeping genes in qRT-PCR analyses. Calnexin was used as loading control for western blotting analyses. d, h Analysis of nuclear β-catenin signal. Representative images (top) and quantification (bottom) of nuclear β-catenin immunoreactivity (red) in N2a cells (d) and primary cortical neurons (h) treated with either control supernatant (NS) or activated T cell supernatant (Stim) for 24 h. DAPI-stained nuclei are shown in blue. Separate channels are shown for the high-magnification images of the boxed regions. Scale bars, 50 and 10 μm for low and high magnification, respectively. Bars show mean ± sem of at least n = 3 independent experiments with individual data points. *p < 0.05, **p < 0.01, ***p < 0.001, ns: p > 0.05; Mann–Whitney U test/unpaired two-tailed Student’s t test.
Fig. 2
Fig. 2. Contactless co-cultures of neurons and stimulated microglia increases the neuronal expression of REST.
a, b Timeline (a) and schematics (b) of the experimental procedures for the contactless microglial/neuronal co-cultures. Primary microglial cells were harvested from the mixed primary glial cultures at 18 DIV and seeded on matrigel-coated TranswellsTM for 1 day before being treated for 24 h with either LPS (Stim) or vehicle (NS). After treatment, microglia-coated transwells were added to 14 DIV primary cortical neurons that were harvested 24 h later. c Microglial activation was verified by staining with the microglial marker Iba1. DAPI-stained nuclei are shown in blue. Scale bar, 25 µm. d After 24 h of contactless co-culture with either control or activated microglia, TranswellsTM were removed and neurons were harvested and subjected to qRT-PCR to assess the full-length REST expression. Gapdh, Actin, and Hprt1 were used as housekeeping genes. Bars show mean ± sem with superimposed individual points obtained from three independent preparations. Similar to activated T cell supernatant, the secretory activity of activated microglia increases REST expression in the co-cultured neurons. *p < 0.05; Mann–Whitney U test.
Fig. 3
Fig. 3. Expression of REST is selectively regulated by IL-1β in primary cortical neurons.
a qRT-PCR analysis of REST mRNA levels upon treatment with the indicated pro-inflammatory cytokines for 24 h. b Representative immunoblot (left) and corresponding quantification (right) of REST protein levels under the same experimental conditions. c qRT-PCR analysis of REST mRNA levels upon IL-1β treatment for various times, as indicated. d Representative immunoblot (left) and corresponding quantification (right) of REST protein levels upon treatment with IL-1β for 20 min and 24 h, as compared to control condition. e, f qRT-PCR analysis (e) and immunoblotting (f) of REST4 upon exposure to either IL-1β or vehicle (Veh) for 24 h. g The mRNA levels of the Na+ channel NaV1.2 (Scn2a) and synapsin I (SynI) were quantified by qRT-PCR in IL-1β-treated neurons and compared to control. Gapdh, Actin, and Hprt1 were used as housekeeping genes in qRT-PCR analyses. Calnexin was used as loading control for western blotting analyses. Bar graphs show mean ± sem of at least n = 2 independent experiments with superimposed individual points. *p < 0.05, **p < 0.01; one-way ANOVA/Bonferroni’s tests (ad); unpaired two-tailed Student’s t test (eg).
Fig. 4
Fig. 4. IL-1β treatment increases nuclear β-catenin and CREB activation, while it decreases excitatory synaptic strength in cortical neurons.
a Representative images (left) and quantification (right) of nuclear β-catenin signal in primary neurons treated with either vehicle (Veh, blue bar) or IL-1β (red bar) for 24 h and stained for β-catenin (red). DAPI-stained nuclei are in blue. Separate channels are shown for the high-magnification images of the boxed regions. Scale bars, 50 and 10 μm for low and high magnification, respectively. b Representative immunoblots (left) and quantification (right) of β-catenin levels in nuclear and cytosolic fractions from primary neurons treated as in a. Immunoblotting for Lamin B1 and GAPDH as nuclear and cytosolic markers, respectively, was used to check the purity of the subcellular fractions. The changes in β-catenin levels in nuclear and cytosolic fractions upon treatment with IL-1β are expressed in percentage of the respective values in vehicle-treated samples. c Quantitative western blotting analysis of CREB phosphorylation in neurons treated with either IL-1β or vehicle (Veh) for 20 min. Calnexin was used as loading control. d Representative image of patch-clamped neurons (left) and representative traces of mEPSCs (right) recorded in cortical neurons treated with either vehicle (blue trace) or IL-1β (red trace) for 20 min at 7 DIV. Recordings were performed at 14 DIV. e Cumulative distribution of inter-event intervals (left) and mean (±sem) frequency (right) of mEPSCs. f Cumulative distribution (left) and mean (± sem) amplitude (right) of mEPSCs. Bar graphs show mean ± sem with superimposed individual points obtained from distinct culture dishes prepared from at least n = 3 independent preparations. Veh: n = 23 and IL-1β: n = 22. *p < 0.05, **p < 0.01, ***p < 0.001; unpaired two-tailed Student’s t test.
Fig. 5
Fig. 5. REST deletion occludes the effects of IL-1β treatment on excitatory transmission.
ac Representative traces (a), cumulative distribution of inter-event intervals (left) and mean frequency (right) (b), and cumulative distribution (left) and mean amplitude (right) (c) of mEPSCs in ΔCre-REST and Cre-REST transduced cortical neurons treated with either vehicle (blue traces) or IL-1β (red traces) for 20 min at 7 DIV. Recordings were performed at 14 DIV. df Representative traces (d), cumulative distribution of inter-event intervals and mean frequency (e), and cumulative distribution and mean amplitudes (f) of mIPSCs recorded under the same experimental conditions described above. Graphs show mean ± sem of at least three independent preparations with superimposed individual points. Excitatory synapses: n = 16, 18, 13, and 15; inhibitory synapses: n = 27, 29, 30, and 26 for ΔCRE-REST Veh, ΔCRE-REST IL-1β, CRE-REST Veh, and CRE-REST IL-1β, respectively. **p < 0.01, ***p < 0.001, ns: p > 0.05; two-way ANOVA/Bonferroni’s tests.
Fig. 6
Fig. 6. REST deletion occludes the IL-1β-mediated decrease in the density of excitatory synapses.
a, b Excitatory synapses. a Representative images of excitatory synaptic boutons in proximal dendrites from ΔCre- and Cre-infected neurons treated with either vehicle or IL-1β for 20 min at 7 DIV and analyzed at 14 DIV. Excitatory synapses were identified by double immunostaining with VGLUT1/Homer1. The merged panels highlight the double-positive puncta (white) corresponding to bona fide synapses. b Quantification of the linear density of inhibitory synapses expressed as the mean number of excitatory boutons counted on 30-µm dendritic branches starting from the cell body in ΔCre- and Cre-infected neurons treated with vehicle (veh; blue bars) or IL-1β (red bars). c, d Inhibitory synapses. c Representative images of inhibitory synaptic boutons identified by double immunostaining with VGAT/Gephyrin under the same experimental conditions shown in a. d Quantification of the linear density of inhibitory synapses expressed as the number of inhibitory boutons counted on 30-µm dendritic branches starting from the cell body in ΔCre- and Cre-infected neurons treated with vehicle (veh; blue bars) or IL-1β (red bars). Scale bars, 6 µm. e Representative traces (left) and frequency of calcium oscillations (right) in ΔCre-REST and Cre-REST transduced cortical neurons treated with either vehicle (blue traces) or IL-1β (red traces) for 20 min at 7 DIV. Recordings were performed at 14 DIV. Peaks with at least 2% of difference with respect to the baseline were considered and their frequency was calculated as total number of significant peaks over the recording time. Bar graphs in b, d, e show mean ± sem with superimposed individual points from independent coverslips prepared from at least n = 3 distinct preparations. *p < 0.05; two-way ANOVA/Bonferroni’s tests.

References

    1. Schoenherr CJ, Anderson DJ. The neuron-restrictive silencer factor (NRSF): a coordinate repressor of multiple neuron-specific genes. Science. 1995;267:1360–1363. doi: 10.1126/science.7871435. - DOI - PubMed
    1. Chong JA, et al. REST: a mammalian silencer protein that restricts sodium channel gene expression to neurons. Cell. 1995;80:949–957. doi: 10.1016/0092-8674(95)90298-8. - DOI - PubMed
    1. Ballas N, Grunseich C, Lu DD, Speh JC, Mandel G. REST and its corepressors mediate plasticity of neuronal gene chromatin throughout neurogenesis. Cell. 2005;121:645–657. doi: 10.1016/j.cell.2005.03.013. - DOI - PubMed
    1. Bruce AW, et al. Genome-wide analysis of repressor element 1 silencing transcription factor/neuron-restrictive silencing factor (REST/NRSF) target genes. Proc. Natl Acad. Sci. USA. 2004;101:10458–10463. doi: 10.1073/pnas.0401827101. - DOI - PMC - PubMed
    1. Otto SJ, et al. A new binding motif for the transcriptional repressor REST uncovers large gene networks devoted to neuronal functions. J. Neurosci. 2007;27:6729–6739. doi: 10.1523/JNEUROSCI.0091-07.2007. - DOI - PMC - PubMed

Publication types

MeSH terms

Substances

LinkOut - more resources