. 2021 Feb 15;12(1):1033.
doi: 10.1038/s41467-021-21330-0.

Machine learning identifies candidates for drug repurposing in Alzheimer's disease

Affiliations

Machine learning identifies candidates for drug repurposing in Alzheimer's disease

Steve Rodriguez et al. Nat Commun. .

Abstract

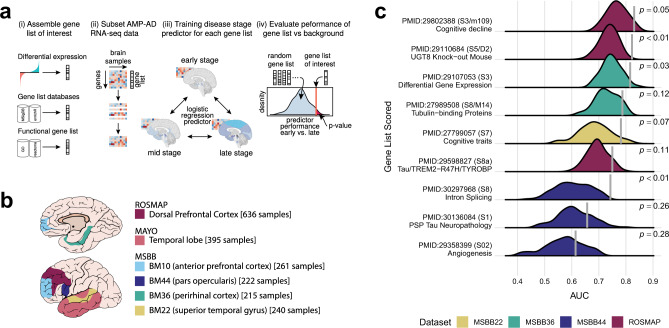
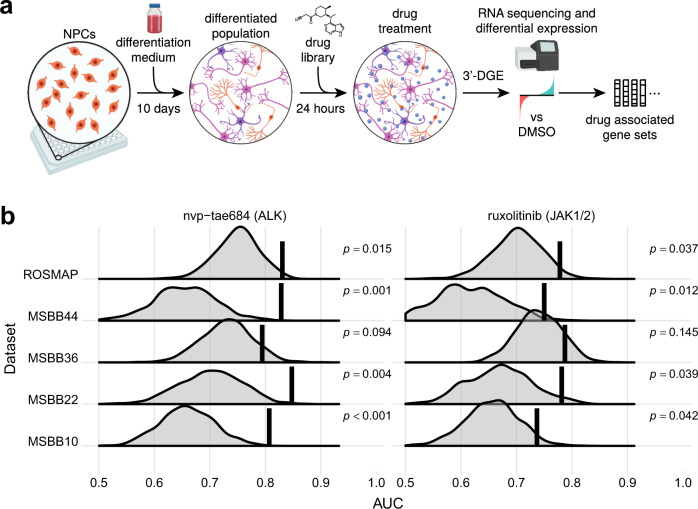
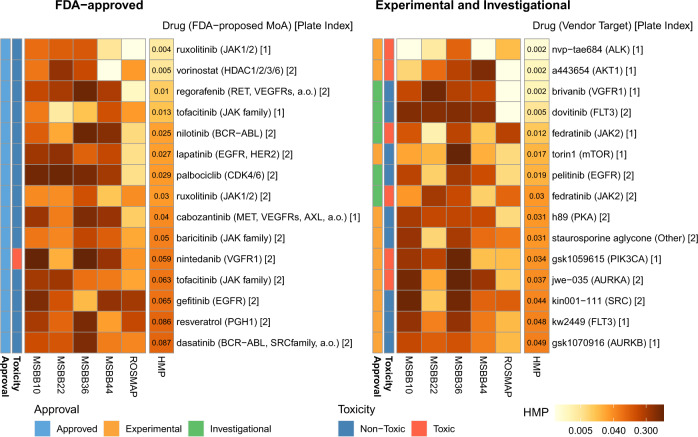
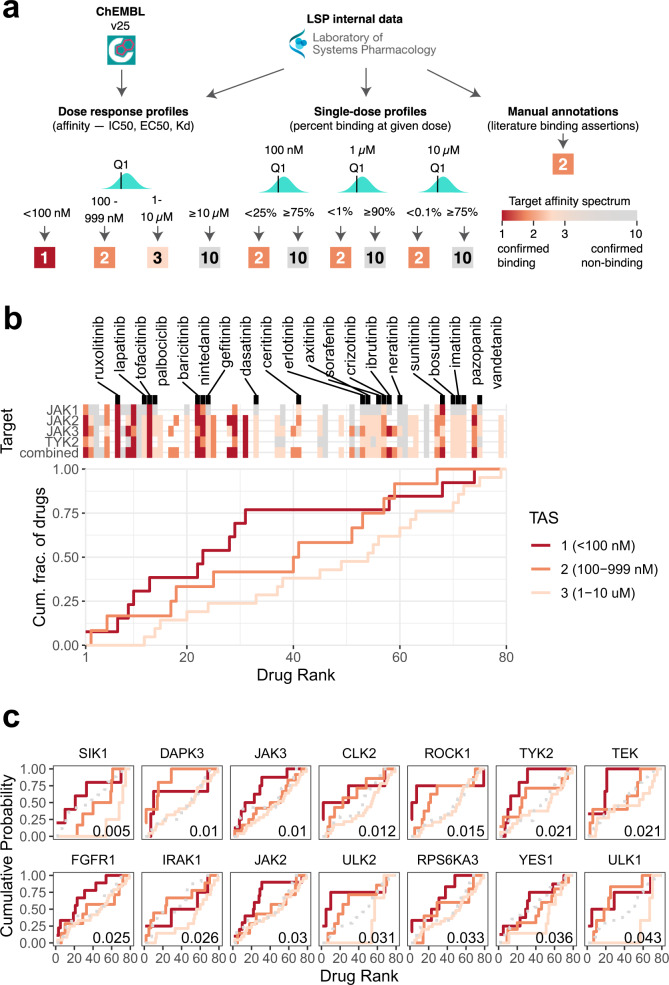
Clinical trials of novel therapeutics for Alzheimer's Disease (AD) have consumed a large amount of time and resources with largely negative results. Repurposing drugs already approved by the Food and Drug Administration (FDA) for another indication is a more rapid and less expensive option. We present DRIAD (Drug Repurposing In AD), a machine learning framework that quantifies potential associations between the pathology of AD severity (the Braak stage) and molecular mechanisms as encoded in lists of gene names. DRIAD is applied to lists of genes arising from perturbations in differentiated human neural cell cultures by 80 FDA-approved and clinically tested drugs, producing a ranked list of possible repurposing candidates. Top-scoring drugs are inspected for common trends among their targets. We propose that the DRIAD method can be used to nominate drugs that, after additional validation and identification of relevant pharmacodynamic biomarker(s), could be readily evaluated in a clinical trial.


Conflict of interest statement

The authors declare the following competing interests. P.K.S. is a member of the SAB or Board of Directors of Applied Biomath, RareCyte, NanoString and Glencoe Software and has equity in some of these companies. In the last 5 years, the Sorger lab has received research funding from Novartis and Merck. P.K.S. declares that none of these relationships are directly or indirectly related to the content of this manuscript. B.T.H. has stock in Novartis and Dewpoint. N.T.J. is an employee of H3 Biomedicine, a subsidiary of Eisai Inc. that develops therapies for Alzheimer’s. S.R., P.K.S., M.W.A., and A.S. are inventors on a patent application (WO/2017/173451) for novel targets in neurodegenerative diseases. All other authors (C.H., P.T., N.M., S.B., K.E., G.Z.) declare no competing interests.

Figures

Fig. 1
Fig. 1. The definition and validation of the DRIAD framework.
a Overview of the machine learning framework used to establish potential associations between gene lists and Alzheimer’s disease. (i) The framework accepts as input gene lists derived from experimental data or extracted from database resources or literature. (ii) Given a gene expression matrix, the framework subsamples it to a particular gene list of interest, and (iii) subsequently trains and evaluates through cross-validation a predictor of Braak stage of disease. (iv) The process is repeated for randomly selected gene lists of equal lengths to determine whether predictor performance associated with the gene list of interest is significantly higher than what is expected by chance. b AMP-AD datasets used by the machine learning framework. The three datasets used to evaluate the predictive power of gene lists are provided by The Religious Orders Study and Memory and Aging Project (ROSMAP), The Mayo Clinic Brain Bank (MAYO), and The Mount Sinai/JJ Peters VA Medical Center Brain Bank (MSBB). The schematic highlights regions of the brain that are represented in each dataset. The MSBB dataset spans four distinct regions, which are designated using Brodmann (BM) area codes. c Performance of predictors trained on gene lists reported in previous studies of AMP-AD datasets. The predictors are evaluated for their ability to distinguish early-vs-late disease stages with performance reported as area under the ROC curve (AUC). The vertical line on each row denotes predictor performance associated with a gene list reported in the literature, while the background distribution is constructed over randomly selected lists of matching lengths. Each row is annotated with the pubmed ID of the study, the supplemental resource that contained the gene list, and a short keyphrase providing functional context. Shown unadjusted p-values were computed with a one-sided empirical test, by counting the fraction of randomly selected lists in the background distribution that outperformed the corresponding literature lists.
Fig. 2
Fig. 2. Collection and evaluation of drug-associated gene lists.
a Overview of the 3′ DGE experimental protocol used to derive drug-associated gene expression signatures. ReNcell VM human neural progenitor cells were plated and differentiated for 10 days, resulting in a mixed cell population of neurons, glia, and oligodendrocytes. The mixed culture was subsequently treated with a panel of drugs (Supplementary Data 3) at 10 µM for 24 h and frozen in a lysis buffer until library preparation. RNA was extracted and reverse transcribed into cDNA in each well of the plate, followed by pooling and preparation of mRNA libraries. After sequencing, mRNA reads were demultiplexed according to well barcodes, and the resulting gene expression profiles were processed by a standard differential expression method to derive drug-associated gene lists. b A highlight of two compounds whose gene lists consistently yield improved performance over the randomly selected lists of equal length. Shown is performance associated with predicting early-vs-late disease stages in several AMP-AD datasets. Each row corresponds to an evaluation of gene lists in a single dataset; MSBB evaluation is subdivided into four brain regions, specified as Brodmann Area. The vertical line denotes performance of the drug-associated list, while the background distribution shows performance of gene lists randomly selected from the same dataset. The drugs are annotated with their nominal targets. The unadjusted p-values were computed with a one-sided empirical test, by counting the fraction of randomly selected lists that outperformed the corresponding drug-associated lists.
Fig. 3
Fig. 3. Top 15 FDA-approved (left) and experimental/investigational (right) drugs, sorted by harmonic mean p-value.
Each heatmap shows unadjusted empirical p-values associated with a drug’s predictive performance across two AMP-AD datasets, ROSMAP and MSBB. The MSBB analysis is further subdivided by the brain region, specified as Brodmann Area. The empirical p-values were computed by counting the proportion of randomly selected lists that outperformed the gene lists of interest (i.e., a one-sided test). The p-values were then aggregated across the datasets by computing the harmonic mean p-value (HMP), which is shown in the last column of each heatmap. The rows are annotated with the name of the drug/compound, its nominal target, and the index of the corresponding DGE experiment. Additional annotations include information about each compound’s approval status (approved/investigational/experimental) and whether compounds were found to be toxic in neuronal cell cultures.
Fig. 4
Fig. 4. Analysis of target affinity among the top-scoring drugs.
a Overview of target affinity spectrum (TAS) score computation from raw drug binding data. Three types of drug binding data were sourced from ChEMBL and from the internal Laboratory Systems of Pharmacology dataset that have not yet been incorporated into ChEMBL. Empirically derived thresholds for the different data types were used to assign TAS scores to each drug–target pair. Multiple measurements for the same drug–target combination were aggregated along the first quartile to define the final TAS value. b Binding affinity of compounds in the ranked list to every member of the Janus Kinase family. The compounds are sorted in increasing order by the harmonic mean p-value (as defined in Fig. 3) along the x-axis. The top heatmap shows the binding affinity of each compound to the selected targets, explicitly naming the FDA-approved drugs. Colored and gray tiles denote confirmed binders and non-binders, respectively; missing entries correspond to unknown affinity values. The combined affinity is defined as the strongest binding (lowest TAS score) among all four JAK targets. The bottom plot shows the breakdown of the combined affinity values by TAS-specific empirical cumulative distribution functions (ECDFs). Each line shows ECDFs for all drugs that bind the corresponding target with a TAS score of 1 (dark orange), 2 (orange), or 3 (light orange). c Top targets whose binding affinity correlates most strongly with the compound ranking. The ECDFs of confirmed non-binders (TAS = 10) are shown as gray dashed lines for reference. Area under ECDF can be interpreted as a summary statistic that captures the position of drugs binding to that target with the corresponding affinity in the ranked list. Correlation between the drug ranking and TAS values was computed using the one-sided Kendall’s Tau test, with the associated unadjusted p-value displayed in the bottom right corner of each plot.
Fig. 5
Fig. 5. Analysis of polypharmacology effects among the top-scoring drugs.
a An example polypharmacology test with a focus on RPS6KA1 and TYK2. The drugs are ranked by the harmonic mean p-value (as in Figs. 3 and 4), and the distributions of drugs bindings to both RPS6KA1 and TYK2 (left), those binding to RPS6KA1 but not TYK2 (middle) and, conversely, TYK2 but not RPS6KA1 (right) are shown along this ranking. Individual drugs that bind those targets are annotated by vertical tick marks directly below the corresponding distribution. b Top ten positive and top ten negative interactions between pairs of targets. The distributions in each plot are compared using Wilcoxon Rank Sum test, with the resulting p-value presented in the bottom right corner. If compounds that bind both targets appear significantly closer to the top of the ranked list (left side of the x axis), we define the target pair to be a positive interaction. Conversely, a pair of targets with an explicit non-binding interaction observed among the top-ranking compounds is defined to be antagonistic. A set of five neutral target pairs (i.e., no significant positive or negative effect) is included for reference.

Similar articles

Cited by

References

    1. Hebert LE, Weuve J, Scherr PA, Evans DA. Alzheimer disease in the United States (2010-2050) estimated using the 2010 census. Neurology. 2013;80:1778–1783. doi: 10.1212/WNL.0b013e31828726f5. - DOI - PMC - PubMed
    1. Alzheimer’s Association. 2019 Alzheimer’s disease facts and figures. Alzheimers Dement. 15, 321–387 (2019).
    1. Mehta D, Jackson R, Paul G, Shi J, Sabbagh M. Why do trials for Alzheimer’s disease drugs keep failing? A discontinued drug perspective for 2010–2015. Expert Opin. Investig. Drugs. 2017;26:735–739. doi: 10.1080/13543784.2017.1323868. - DOI - PMC - PubMed
    1. Pushpakom S, et al. Drug repurposing: progress, challenges and recommendations. Nat. Rev. Drug Discov. 2019;18:41–58. doi: 10.1038/nrd.2018.168. - DOI - PubMed
    1. Hernandez, J. J. et al. Giving drugs a second chance: overcoming regulatory and financial hurdles in repurposing approved drugs as cancer therapeutics. Front. Oncol. 7, 273 (2017). - PMC - PubMed

Publication types

MeSH terms