. 2021 Feb 15;12(1):1024.
doi: 10.1038/s41467-021-21056-z.

Causal network models of SARS-CoV-2 expression and aging to identify candidates for drug repurposing

Affiliations

Causal network models of SARS-CoV-2 expression and aging to identify candidates for drug repurposing

Anastasiya Belyaeva et al. Nat Commun. .

Abstract

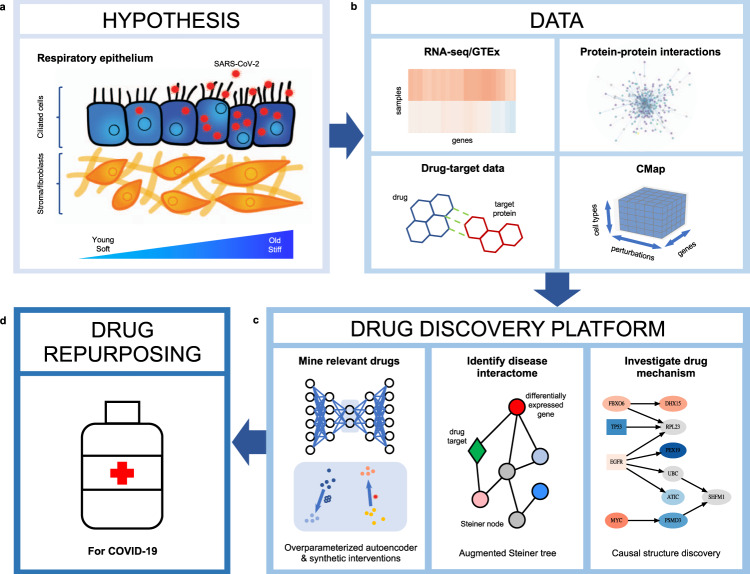
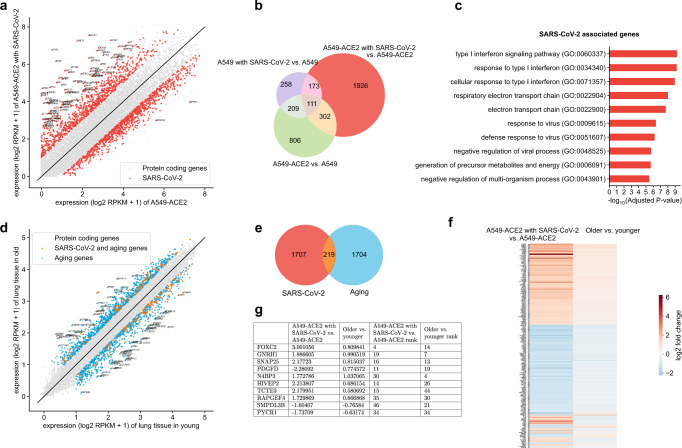
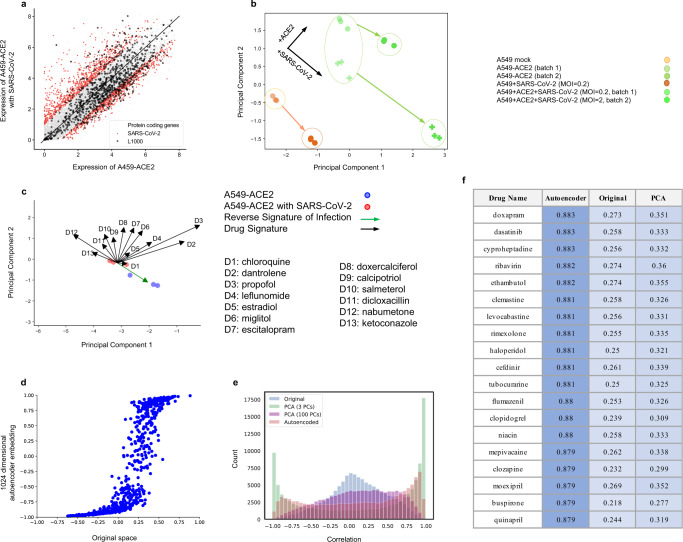
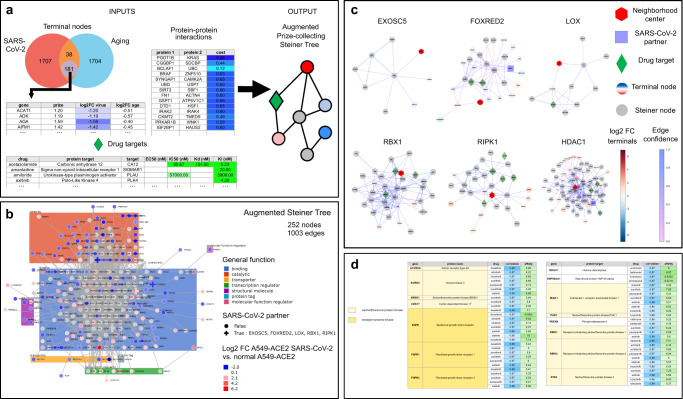
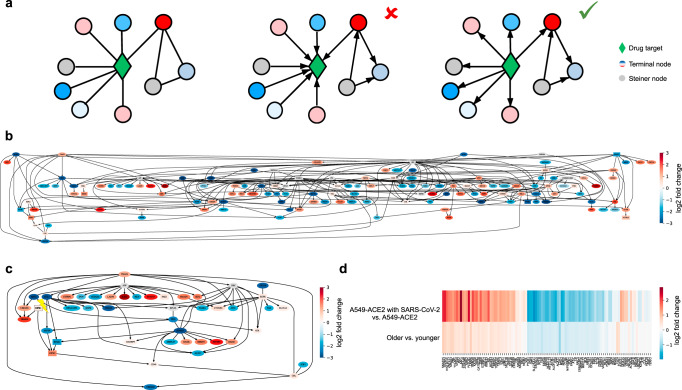
Given the severity of the SARS-CoV-2 pandemic, a major challenge is to rapidly repurpose existing approved drugs for clinical interventions. While a number of data-driven and experimental approaches have been suggested in the context of drug repurposing, a platform that systematically integrates available transcriptomic, proteomic and structural data is missing. More importantly, given that SARS-CoV-2 pathogenicity is highly age-dependent, it is critical to integrate aging signatures into drug discovery platforms. We here take advantage of large-scale transcriptional drug screens combined with RNA-seq data of the lung epithelium with SARS-CoV-2 infection as well as the aging lung. To identify robust druggable protein targets, we propose a principled causal framework that makes use of multiple data modalities. Our analysis highlights the importance of serine/threonine and tyrosine kinases as potential targets that intersect the SARS-CoV-2 and aging pathways. By integrating transcriptomic, proteomic and structural data that is available for many diseases, our drug discovery platform is broadly applicable. Rigorous in vitro experiments as well as clinical trials are needed to validate the identified candidate drugs.


Conflict of interest statement

The authors declare no competing interests.

Figures

Fig. 1
Fig. 1. Overview of computational drug repurposing platform for COVID-19.
a COVID-19 is associated with more severe outcomes in older individuals, suggesting that gene expression programs associated with SARS-CoV-2 and aging must be analyzed in tandem. A potential hypothesis regarding the cross-talk between SARS-CoV-2 and aging relies on changes in tissue stiffness in older individuals, outlined in ref. . Ciliated cells are denoted in blue, stromal/fibroblast cells are in orange and SARS-CoV-2 viral particles are in red. b In order to identify potential drug candidates for COVID-19, we integrated RNA-seq data from SARS-CoV-2-infected cells, obtained from ref. , and RNA-seq data from the lung tissue of young and old individuals, collected as part of the Genotype-Tissue Expression (GTEx) project, with protein–protein interaction data (from ref. ), drug–target data (from DrugCentral) and the large-scale transcriptional drug screen Connectivity Map (CMap). c, d Based on this data, we develop a drug repurposing pipeline, which consists of first, mining relevant drugs by matching their signatures with the reverse disease signature in the latent embedding obtained by an overparameterized autoencoder and sharing data across cell types to obtain missing drug signatures via synthetic interventions. Blue and orange points in the latent space represent data associated with the drug screen and the SARS-CoV-2 infection study. Second, we identify a disease interactome within the protein–protein interaction network by identifying a minimal subnetwork that connects the genes differentially expressed by SARS-CoV-2 infection and aging using a Steiner tree analysis. Third, we validate the drugs identified in the first step that have targets in the interactome (greed diamond) by identifying the potential drug mechanism using causal structure discovery. Nodes are colored according to the log2-fold gene expression change associated with SARS-CoV-2 infection, and gray nodes indicate Steiner nodes.
Fig. 2
Fig. 2. Identification of differentially regulated genes in SARS-CoV-2 infection and aging.
a Gene expression (log2 RPKM + 1) of A549-ACE2 cells infected with SARS-CoV-2 versus normal A549-ACE2 cells. Genes associated with ACE2-mediated SARS-CoV-2 infection after removing just ACE2-specific or just SARS-CoV-2 infection-specific genes are shown in red with the remaining protein-coding genes shown in gray. b Venn diagram, showing the number of genes in sets considered for obtaining the 1926 genes in the red subset and shown in red in (a) associated with ACE2-mediated SARS-CoV-2 infection. Purple, red, and green whole circles indicate differentially expressed genes associated with A549 cells infected with SARS-CoV-2, A549-ACE2 cells infected with SARS-CoV-2, and A549 cells with and without ACE2, respectively. c Top ten gene ontology terms associated with SARS-CoV-2 infection (adjusted p value < 0.05, Benjamini–Hochberg procedure). d Gene expression (log2 RPKM + 1) of cells collected from lung tissue of older (70–79 years old) versus younger (20–29 years old) individuals. Differentially expressed genes associated with aging are shown in blue and genes that are associated with both aging and SARS-CoV-2 are shown in orange with the remaining protein-coding genes shown in gray. e Venn diagram of genes associated with SARS-CoV-2 (red circle) and aging (blue circle); intersection (orange) is significant (p value = 0.01999, one-sided Fisher’s exact test). f Heatmap of log2-fold changes of differentially expressed genes shared by SARS-CoV-2 and aging; most genes show concordant expression, i.e., they are both upregulated or both downregulated with SARS-CoV-2 infection and aging. g Table of the top ten most differentially expressed genes across aging and SARS-CoV-2, based on the sum of their ranks with log2-fold changes for each gene.
Fig. 3
Fig. 3. Mining FDA-approved drugs by correlating disease and drug signatures using an overparameterized autoencoder embedding.
a Gene expression (log2 RPKM + 1) of A549-ACE2 cells infected with SARS-CoV-2 versus normal A549-ACE2 cells with genes collected as part of the CMap study using the L1000 reduced representation expression profiling method highlighted as stars, showing that L1000 genes significantly overlap with SARS-CoV-2 associated genes, shown in red, (p value = 7.94 × 10−16, one-sided Fisher’s exact test). b Signature of SARS-CoV-2 infection on A549 and A549-ACE2 cells visualized using the first two principal components based on RNA-seq data from ref. . The signature of SARS-CoV-2 infection is aligned across normal A549 and A549-ACE2 cells as well as across different levels of infection. Green and orange points indicate data from A549-ACE2 and A549 cells, respectively. Circles and crosses indicate data from two different batches, the multiplicity of infection (MOI) of 0.2 versus 2, respectively. c Comparison of the signatures of a selection of 13 representative FDA-approved drugs (black arrows) as compared to the reverse signature of SARS-CoV-2 infection based on A549-ACE2 cells (green arrow) visualized using the first two principal components. Drugs whose signatures maximally align with the direction from SARS-CoV-2-infected cells (red) to normal cells (blue) are considered candidates for treatment. As expected, drugs have varying signatures of varying magnitudes. d Correlation between drug signatures in A549 and MCF7 cells when using the original L1000 expression space versus the embedding obtained from an overparameterized autoencoder. The overparameterized autoencoder aligns the drug signatures in A549 and MCF7 cells by shifting the correlations towards −1 or 1 while maintaining the sign of the correlation in the original space. e Histogram of correlations between cell types for a given drug using original L1000 gene expression vectors (blue), overparameterized autoencoder embedding (pink), top 100 principal components (purple), and top 3 principal components (green). The overparameterized autoencoder achieves about the same alignment of drug signatures as using the top three principal components, while at the same time faithfully reconstructing the data (10−7 training error). f A list of drugs whose signatures maximally align with the direction from SARS-CoV-2 infection to normal in A549-ACE2 cells (MOI 2) with respect to correlations using the overparameterized autoencoder embedding, the original L1000 gene expression space, and the top 100 principal components.
Fig. 4
Fig. 4. Drug target discovery via Steiner tree analysis to identify putative molecular pathways linking differentially expressed genes in SARS-CoV-2 infection and aging.
a The general procedure takes as input a list of genes of interest (terminal nodes) with prizes indicating their respective importance, a protein–protein interaction (PPI) network with edge cost/confidence information (e.g., from IRefIndex v14, edge cost shown by blue shading), and a list of drugs of interest along with their protein targets and available activity constants (e.g., from DrugCentral,, activity constants shown by green shading). In this study, we consider 181 terminal nodes, shown as a purple circle in the Venn diagram (of which 162 are present in the PPI network) corresponding to genes differentially expressed in SARS-CoV-2 infection (red circle) and aging (blue circle) from Fig. 2 that are either upregulated in both SARS-CoV-2 infection and aging or downregulated in both SARS-CoV-2 infection and aging. The prize of a terminal node equals the absolute value of its log2-fold change in SARS-CoV-2-infected A549-ACE2 cells versus normal A549-ACE2 cells (shown in purple shading) based on the data from ref. . Terminals and PPI data are processed using OmicsIntegrator2 to output the disease interactome, i.e., the subnetwork induced by a Steiner tree, with drug targets indicated by green diamonds and terminal nodes colored according to their prizes. Gray nodes represent Steiner nodes. b Interactome obtained using this procedure. Proteins are grouped by general function (colored boxes in the background) and marked with a cross if they are known to interact with SARS-CoV-2 proteins based on data from. c 2-Nearest-neighborhoods of nodes of interest (denoted by a red hexagon) in the interactome. Proteins known to interact with SARS-CoV-2 are denoted by blue squares, drug targets are denoted as green diamonds, terminal nodes are colored according to their log2-fold change in SARS-CoV-2-infected A549-ACE2 cells versus normal A549-ACE2 cells, Steiner nodes appear in gray. Edges are colored according to edge confidence, which is thresholded to improve readability (see “Methods”). d Table of drug targets and corresponding drugs in the interactome. Selected drugs are FDA-approved, high affinity (at least one of the activity constants Ki, Kd, IC50 or EC50 is below 10 μM), and match the SARS-CoV-2 signature well (correlation > 0.86). The affinity column displays (and is colored by) log10(activity). The correlation column displays (and is colored by) correlations between drug signatures and the reverse signature of SARS-CoV-2 infection based on the overparameterized autoencoder embedding. Discovered drug targets generally fall into two categories: serine/threonine protein kinases (light yellow) and receptor tyrosine kinases (dark yellow). The remaining drug targets are in white. The protein name corresponding to each gene is included.
Fig. 5
Fig. 5. Causal mechanism discovery of potential drug targets.
a In an undirected protein–protein interaction network (left), edge directions for a particular drug target (green diamond) are unknown. Establishing causal directions is important since it is of interest to avoid drug targets that do not have many downstream nodes in the disease interactome (middle) and instead choose drug targets that have a causal effect on many downstream nodes in the disease interactome (right). b Causal network underlying the combined SARS-CoV-2 and aging interactome in A549 cells with gene targets of selected drugs in boxes (largest connected component shown). c Causal subnetwork of A549 cells corresponding to nodes within five nearest neighbors of RIPK1 (highlighted with lightning bolt). Drug targets are represented by boxes. In ac, the node color corresponds to the log2-fold change of expression in A549-ACE2 cells with SARS-CoV-2 infection versus without SARS-CoV-2 infection. Gray nodes represent Steiner nodes. d Heatmap of log2-fold change of genes that are downstream of RIPK1.

Similar articles

Cited by

References

    1. Pushpakom S, et al. Drug repurposing: progress, challenges and recommendations. Nat. Rev. Drug Discov. 2019;18:41–58. doi: 10.1038/nrd.2018.168. - DOI - PubMed
    1. Subramanian A, et al. A next generation connectivity map: L1000 platform and the first 1,000,000 profiles. Cell. 2017;171:1437-1452.e1. doi: 10.1016/j.cell.2017.10.049. - DOI - PMC - PubMed
    1. Dudley JT, Deshpande T, Butte AT. Exploiting drug-disease relationships for computational drug repositioning. Brief. Bioinform. 2011;12:303–311. doi: 10.1093/bib/bbr013. - DOI - PMC - PubMed
    1. Greene CS, Voight BF. Pathway and network-based strategies to translate genetic discoveries into effective therapies. Hum. Mol. Genet. 2016;25:R94–R98. doi: 10.1093/hmg/ddw160. - DOI - PMC - PubMed
    1. Smith SB, Dampier W, Tozeren A, Brown JR, Magid-Slav M. Identification of common biological pathways and drug targets across multiple respiratory viruses based on human host gene expression analysis. PLoS ONE. 2012;7:e331741. - PMC - PubMed

Publication types