. 2021 Feb 15;12(1):1029.
doi: 10.1038/s41467-021-21312-2.

Fast and precise single-cell data analysis using a hierarchical autoencoder

Affiliations

Fast and precise single-cell data analysis using a hierarchical autoencoder

Duc Tran et al. Nat Commun. .

Abstract

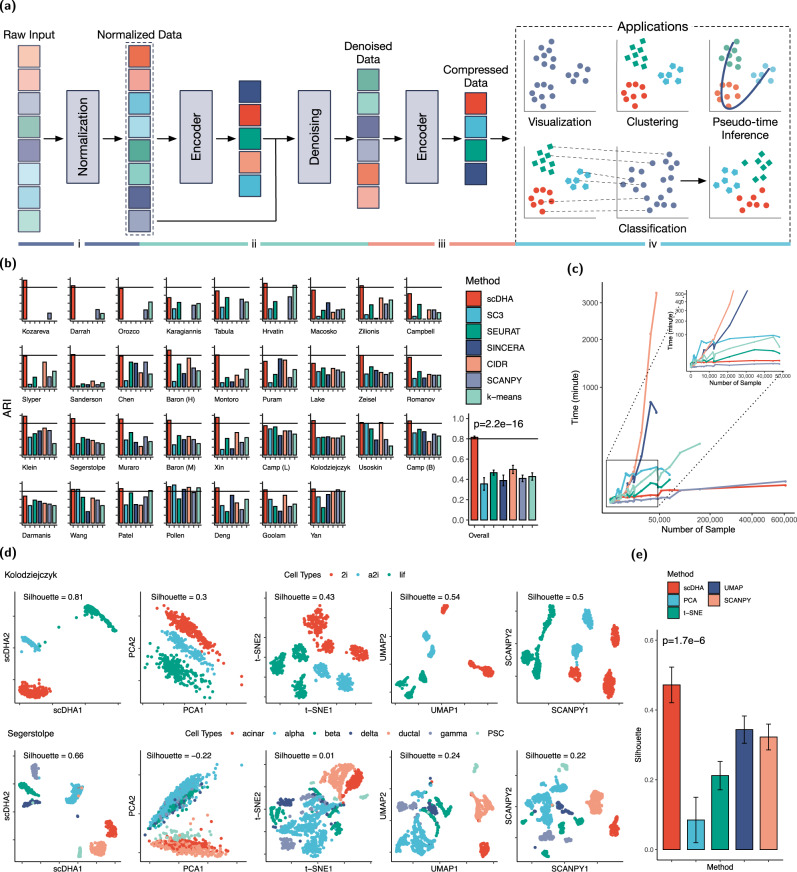
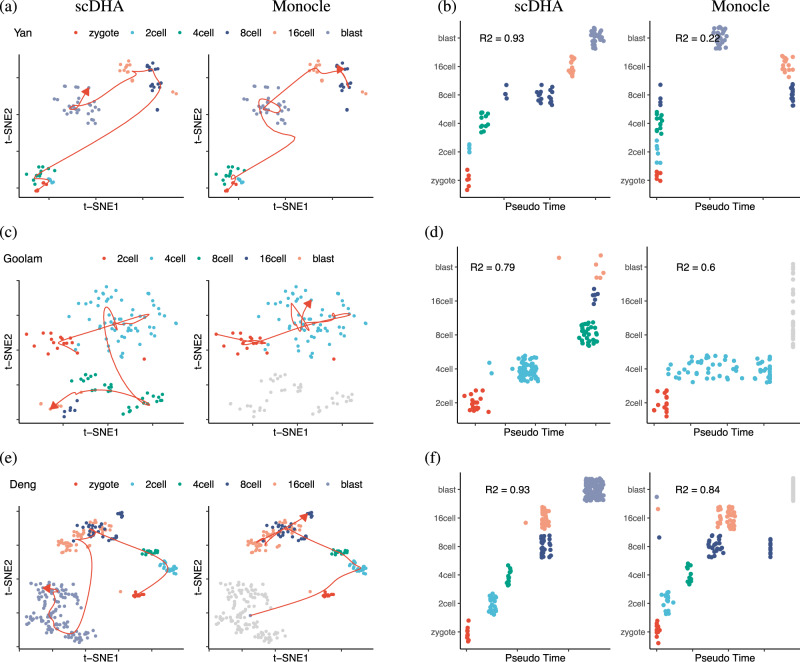
A primary challenge in single-cell RNA sequencing (scRNA-seq) studies comes from the massive amount of data and the excess noise level. To address this challenge, we introduce an analysis framework, named single-cell Decomposition using Hierarchical Autoencoder (scDHA), that reliably extracts representative information of each cell. The scDHA pipeline consists of two core modules. The first module is a non-negative kernel autoencoder able to remove genes or components that have insignificant contributions to the part-based representation of the data. The second module is a stacked Bayesian autoencoder that projects the data onto a low-dimensional space (compressed). To diminish the tendency to overfit of neural networks, we repeatedly perturb the compressed space to learn a more generalized representation of the data. In an extensive analysis, we demonstrate that scDHA outperforms state-of-the-art techniques in many research sub-fields of scRNA-seq analysis, including cell segregation through unsupervised learning, visualization of transcriptome landscape, cell classification, and pseudo-time inference.


Conflict of interest statement

The authors declare no competing interests.

Figures

Fig. 1
Fig. 1. Overview of scDHA architecture and analysis performance on 34 scRNA-seq data sets.
a Schematic overview of scDHA and applications: cell segregation through unsupervised learning, visualization, pseudo-temporal ordering, and cell classification. b Clustering performance of scDHA, SC3, SEURAT, SINCERA, CIDR, SCANPY, and k-means measured by adjusted Rand index (ARI). The first 34 panels show the ARI values obtained for individual data sets whereas the last panel shows the average ARIs and their variance (vertical segments). scDHA significantly outperforms other clustering methods by having the highest ARI values (p = 2.2 × 10−16 using one-sided Wilcoxon test). c Running time of the clustering methods, each using 10 cores. scDHA is the fastest among the six methods. d Color-coded representation of the Kolodziejczyk and Segerstolpe data sets using scDHA, PCA, t-SNE, UMAP, and SCANPY (from left to right). For each representation, we report the silhouette index, which measures the cohesion among cells of the same type, as well as the separation between different cell types. e Average silhouette values (bar plot) and their variance (vertical lines). scDHA significantly outperforms other dimension reduction methods by having the highest silhouette values (p = 1.7 × 10−6 using one-sided Wilcoxon test).
Fig. 2
Fig. 2. Classification accuracy of scDHA, XGBoost (XGB), Random Forest (RF), Deep Learning (DL), Gradient Boosted Machine (GBM) using five human pancreatic data sets.
In each scenario (row), we use one data set as training and the rest as testing, resulting in 20 train-predict pairs. The overall panel shows the average accuracy values and their variance (vertical segment). The accuracy values of scDHA are significantly higher than those of other methods (p = 2.1 × 10−8 using Wilcoxon one-tailed test).
Fig. 3
Fig. 3. Pseudo-time inference of three mouse embryo development data sets (Yan, Goolam, and Deng) using scDHA and Monocle.
a Visualized time-trajectory of the Yan data set in the first two t-SNE dimensions using scDHA (left) and Monocle (right). b Pseudo-temporal ordering of the cells in the Yan data set. The horizontal axis shows the inferred time for each cell while the vertical axis shows the true developmental stages. c, d Time-trajectory of the Goolam data set. Monocle is unable to estimate the time for most cells in 8cell, 16cell, and blast (colored in gray). e, f Time-trajectory of the Deng data set. Monocle is unable to estimate the pseudo-time for most blast cells.
Fig. 4
Fig. 4. High-level representation of stacked Bayesian autoencoder.
The encoder projects input data to multiple low-dimensional latent spaces (outputs of z1 to zn layers). The decoders infer original data from these latent data. Minimizing the difference between inferred data and original one leads to a high quality representation of the original data at bottleneck layer (outputs of μ layer).
Fig. 5
Fig. 5. Accuracy and running time of scDHA on large data sets with and without using the voting procedure.
The voting procedure significantly reduces the running time without compromising the accuracy. Each point represents the result of a single run, while the bar shows the average of 10 runs.

References

    1. Saliba A-E, Westermann AJ, Gorski SA, Vogel J. Single-cell RNA-seq: advances and future challenges. Nucleic Acids Res. 2014;42:8845–8860. doi: 10.1093/nar/gku555. - DOI - PMC - PubMed
    1. Shields IV CW, Reyes CD, López GP. Microfluidic cell sorting: a review of the advances in the separation of cells from debulking to rare cell isolation. Lab Chip. 2015;15:1230–1249. doi: 10.1039/C4LC01246A. - DOI - PMC - PubMed
    1. Zeisel A, et al. Cell types in the mouse cortex and hippocampus revealed by single-cell RNA-seq. Science. 2015;347:1138–1142. doi: 10.1126/science.aaa1934. - DOI - PubMed
    1. Patel AP, et al. Single-cell RNA-seq highlights intratumoral heterogeneity in primary glioblastoma. Science. 2014;344:1396–1401. doi: 10.1126/science.1254257. - DOI - PMC - PubMed
    1. Nguyen, H., Tran, D., Tran, B., Pehlivan, B. & Nguyen, T. A comprehensive survey of regulatory network inference methods using single cell RNA sequencing data. Brief. Bioinform. bbaa190 (2020). - PMC - PubMed

Publication types

MeSH terms