. 2021 Feb 15;12(1):1018.
doi: 10.1038/s41467-021-21336-8.

Discrete SARS-CoV-2 antibody titers track with functional humoral stability

Affiliations

Discrete SARS-CoV-2 antibody titers track with functional humoral stability

Yannic C Bartsch et al. Nat Commun. .

Abstract

Antibodies serve as biomarkers of infection, but if sustained can confer long-term immunity. Yet, for most clinically approved vaccines, binding antibody titers only serve as a surrogate of protection. Instead, the ability of vaccine induced antibodies to neutralize or mediate Fc-effector functions is mechanistically linked to protection. While evidence has begun to point to persisting antibody responses among SARS-CoV-2 infected individuals, cases of re-infection have begun to emerge, calling the protective nature of humoral immunity against this highly infectious pathogen into question. Using a community-based surveillance study, we aimed to define the relationship between titers and functional antibody activity to SARS-CoV-2 over time. Here we report significant heterogeneity, but limited decay, across antibody titers amongst 120 identified seroconverters, most of whom had asymptomatic infection. Notably, neutralization, Fc-function, and SARS-CoV-2 specific T cell responses were only observed in subjects that elicited RBD-specific antibody titers above a threshold. The findings point to a switch-like relationship between observed antibody titer and function, where a distinct threshold of activity-defined by the level of antibodies-is required to elicit vigorous humoral and cellular response. This response activity level may be essential for durable protection, potentially explaining why re-infections occur with SARS-CoV-2 and other common coronaviruses.


Conflict of interest statement

G.A. is a founder of Seromyx Systems Inc. P.C. S. is a co-founder of, a shareholder in, and advisor to Sherlock Biosciences Inc, as well as a Board member of and shareholder in Danaher Corporation. M. J. Gluck, S.B., Y.H., J.R., E.P., B.M., A.S.M., and E.R.M. are employees of Space Exploration Technologies Corp. All other authors have declared that no conflict of interest exists.

Figures
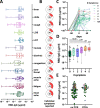
Fig. 1
Fig. 1. SARS-CoV-2 titer heterogeneity by symptoms.
A IgG-RBD titer by reported symptom (values for individuals with multiple symptoms are shown for each symptom individually; LOS loss of smell, LOT loss of taste) (box extends from 25th to 75th percentile, whiskers show min and max, and vertical line indicates the median). B Donut plots with the proportion of individuals who reported the individual symptom in (A), the number in the donut hole indicates the absolute number of individuals (from a total of 116 individuals with symptom data). C The line plot shows the trajectory of SARS-CoV-2 RBD-specific antibody titers following seroconversion in 120 individuals (colors and symbols indicate the number of reported symptoms). D The whisker box plots show study maximum observed RBD titers grouped by individuals reporting 0–5 symptoms (box extends from 25th to 75th percentile, whiskers show min and max, and the horizontal line indicates the median; n0 = 73, n1 = 8, n2 = 12, n3 = 7, n4 = 9, n5 = 7). E The dot plot shows RBD-specific IgG titers in individuals that tested PCR+ (n = 32) prior to developing antibody responses or that did not have a PCR test at the time or within 2 weeks prior to seroconversion (n = 88; colors indicate the number of reported symptoms as in (C) and (D)). Statistical differences in (D) were assessed with the Kruskal–Wallis test followed by a post hoc Dunn’s correction for multiple testing. Source data are provided as a Source Data file.
Fig. 2
Fig. 2. SARS-CoV-2 titer heterogeneity over time.
A The line graph shows the trajectory of the humoral immune response after the first antibody-positive timepoint (red lines show individuals that experience an increase in their antibody titers and gray shows individuals that exhibit stable or low-level waning) (n = 48). B The violin plots show the T0 and T1 RBD-specific IgG titers across individuals that experience an increase (reds) or experience stable or decreasing (grays). C The line plot shows the overall decay profiles once all samples were aligned based on study maximum observed titer (highest titer per individual observed in this study) (n = 32). The shades of blue show the individuals with the higher study maximum titers in the deep blue or lower observed titers in the light blue. Statistical differences between T0 and T1 within a group in (A) and (B) were assessed with a paired Wilcoxon-test and differences across groups and timepoints were assessed with the Kruskal–Wallis test followed by a post hoc Dunn’s correction for multiple testing. ****p < 0.0001 or exact p-values for not significant comparisons. Source data are provided as a Source Data file.
Fig. 3
Fig. 3. A discrete titer cut-off tracks with functional SARS-CoV-2 humoral and T cell immunity.
A The dot plot shows the distribution of study maximum observed antibody titers (highest titer per individual observed in this study) across the cohort, split based on median titers. Dark blue shading indicates all individuals above the median and the light blue shows all the individuals below the median (ntotal = 120; nlow = 60, nhigh = 60). B The violin plots show the distribution of neutralizing antibody titers (dilution factor, left), antibody-dependent complement deposition (ADCD, mean fluorescence intensity, middle), and antibody-dependent neutrophil phagocytosis (ADNP, phagocytosis score, right)(nlow = 60, nhigh = 60) against SARS-CoV-2 S. C The violin plots show the neutralization levels, ADCD, and ADNP (n = 15) from the maximum observed titers to the next timepoint (P + 1) in a subset of individuals in the high titer group. D The correlation heat maps (Spearman-correlation) show significant correlations (p < 0.05) between RBD, Spike (S), and Nucleocapsid (N) titers in the high titer (right; n = 15) and low titer (left; n = 26) groups. Statistical differences between two groups were assessed with a two-sided non-parametric Mann–Whitney test in (B) and paired Wilcoxon-test in (C). ****p < 0.0001 or exact p-values for not significant comparisons. Source data are provided as a Source Data file.
Fig. 4
Fig. 4. A discrete titer cut-off tracks with functional SARS-CoV-2 humoral and T cell immunity.
A, B The flower plots summarize titer and functional data against SARS-CoV-2 RBD, S or N antigen in high or low titer group at maximum observed titers (A) and the following timepoint (B) (the petal color corresponds to features as indicated; the univariate data are also shown in Fig. 3 and Supplementary Fig. 2). CE Antibody-dependent virus neutralization (C), ADCD (D) or ADNP (E) by ELISA RBD titer. The black dotted line indicates the median split (0.45 μg/ml) and the red dashed line the threshold titer for the individual functions. F, G The violin plots show the number of spots forming cells (SFC) of interferon-gamma (IFNγ) secreting T cells after overnight stimulation with either an overlapping peptide pool covering SARS-CoV-2 S (F) or N (G) in individuals with low titers (light blue, n = 10), high titers (dark blue, n = 12) or negative controls (white, n = 14). Statistical differences between two groups were assessed with a two-sided non-parametric Mann–Whitney test (in (F) *:p = 0.039, in (G) *:p = 0.018). Source data are provided as a Source Data file.

References

    1. Robbiani DF, et al. Convergent antibody responses to SARS-CoV-2 in convalescent individuals. Nature. 2020;584:437–442. doi: 10.1038/s41586-020-2456-9. - DOI - PMC - PubMed
    1. Iyer, A. S. et al. Persistence and decay of human antibody responses to the receptor binding domain of SARS-CoV-2 spike protein in COVID-19 patients. Sci Immunol. eabe0367 (2020). - PMC - PubMed
    1. To, K. K. et al. COVID-19 re-infection by a phylogenetically distinct SARS-coronavirus-2 strain confirmed by whole genome sequencing. Clin. Infect. Dis. ciaa1275 (2020). - PMC - PubMed
    1. Tillett, R. et al. Genomic evidence for a case of reinfection with SARS-CoV-2 SSRN (2020). - PMC - PubMed
    1. Long QX, et al. Antibody responses to SARS-CoV-2 in patients with COVID-19. Nat. Med. 2020;26:845–848. doi: 10.1038/s41591-020-0897-1. - DOI - PubMed

Publication types

MeSH terms