

Analysis of SARS-CoV-2 mutations in the United States suggests presence of four substrains and novel variants
- PMID: 33589648
- PMCID: PMC7884689
- DOI: 10.1038/s42003-021-01754-6
Analysis of SARS-CoV-2 mutations in the United States suggests presence of four substrains and novel variants
Erratum in
-
Author Correction: Analysis of SARS-CoV-2 mutations in the United States suggests presence of four substrains and novel variants.Commun Biol. 2021 Mar 3;4(1):311. doi: 10.1038/s42003-021-01867-y. Commun Biol. 2021. PMID: 33658599 Free PMC article. No abstract available.
Abstract
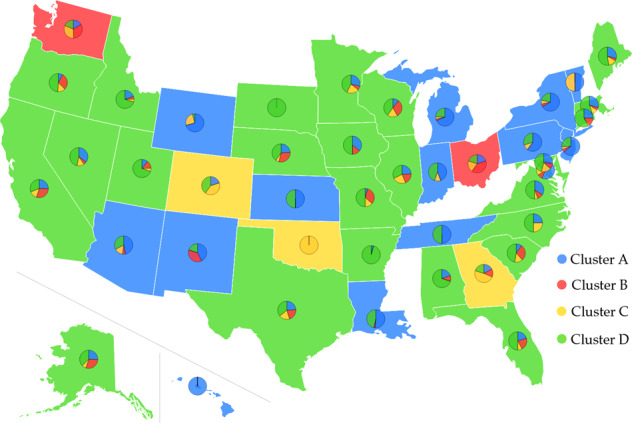
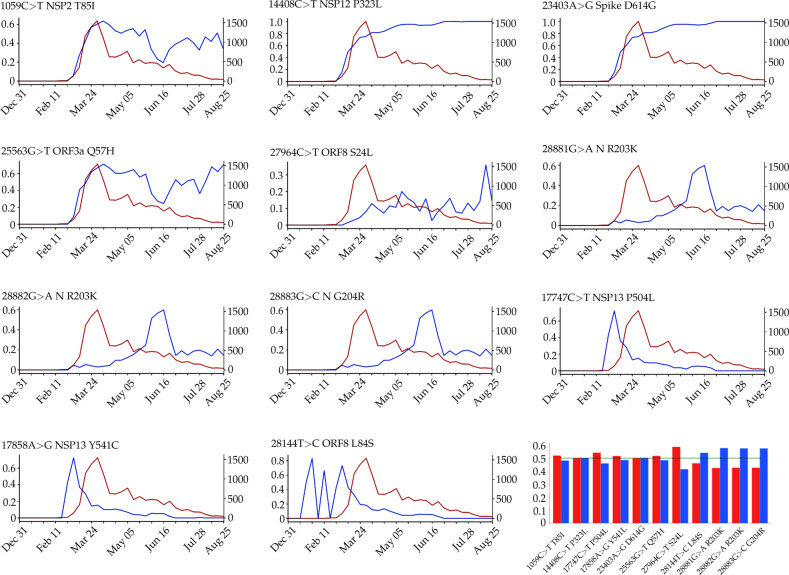
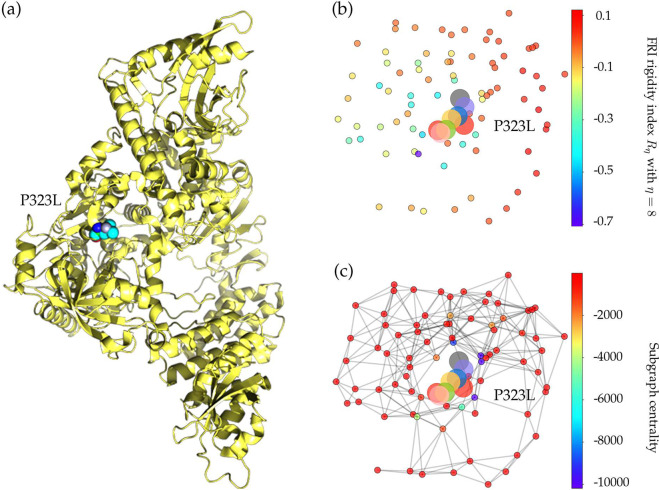
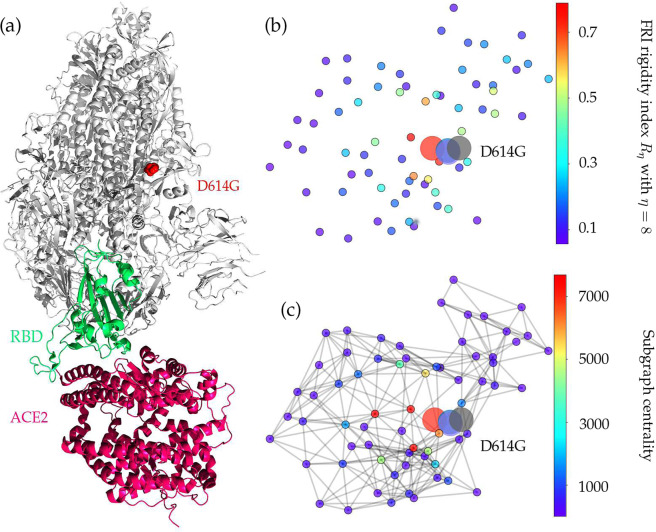
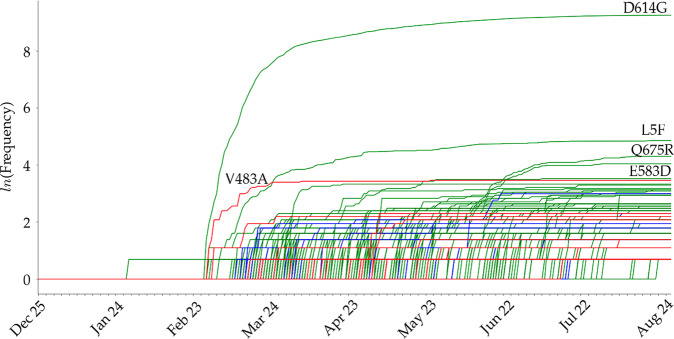
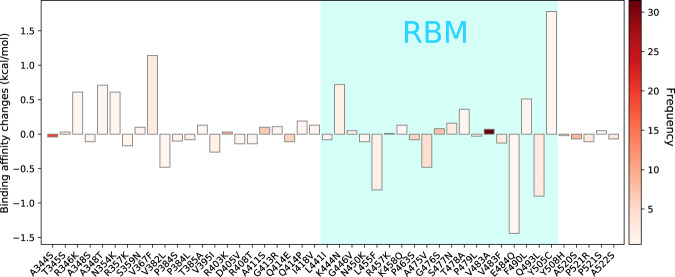
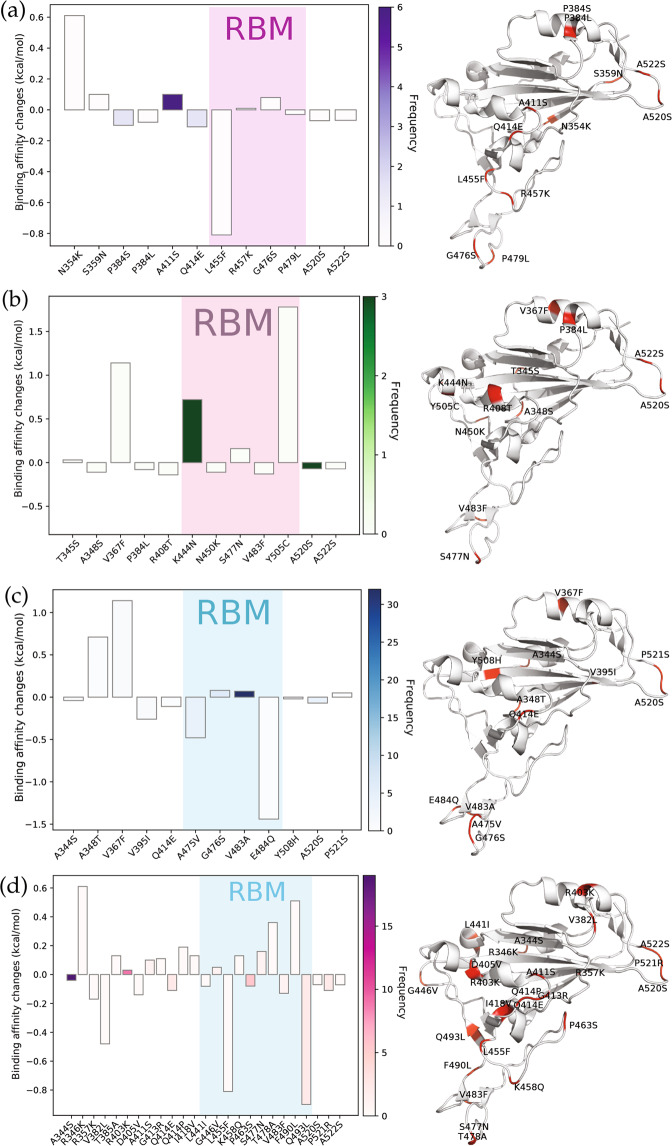
SARS-CoV-2 has been mutating since it was first sequenced in early January 2020. Here, we analyze 45,494 complete SARS-CoV-2 geneome sequences in the world to understand their mutations. Among them, 12,754 sequences are from the United States. Our analysis suggests the presence of four substrains and eleven top mutations in the United States. These eleven top mutations belong to 3 disconnected groups. The first and second groups consisting of 5 and 8 concurrent mutations are prevailing, while the other group with three concurrent mutations gradually fades out. Moreover, we reveal that female immune systems are more active than those of males in responding to SARS-CoV-2 infections. One of the top mutations, 27964C > T-(S24L) on ORF8, has an unusually strong gender dependence. Based on the analysis of all mutations on the spike protein, we uncover that two of four SASR-CoV-2 substrains in the United States become potentially more infectious.
Conflict of interest statement
The authors declare no competing interests.
Figures
Update of
-
Characterizing SARS-CoV-2 mutations in the United States.Res Sq [Preprint]. 2020 Aug 11:rs.3.rs-49671. doi: 10.21203/rs.3.rs-49671/v1. Res Sq. 2020. Update in: Commun Biol. 2021 Feb 15;4(1):228. doi: 10.1038/s42003-021-01754-6. PMID: 32818213 Free PMC article. Updated. Preprint.
Similar articles
-
Characterizing SARS-CoV-2 mutations in the United States.Res Sq [Preprint]. 2020 Aug 11:rs.3.rs-49671. doi: 10.21203/rs.3.rs-49671/v1. Res Sq. 2020. Update in: Commun Biol. 2021 Feb 15;4(1):228. doi: 10.1038/s42003-021-01754-6. PMID: 32818213 Free PMC article. Updated. Preprint.
-
V367F Mutation in SARS-CoV-2 Spike RBD Emerging during the Early Transmission Phase Enhances Viral Infectivity through Increased Human ACE2 Receptor Binding Affinity.J Virol. 2021 Jul 26;95(16):e0061721. doi: 10.1128/JVI.00617-21. Epub 2021 Jul 26. J Virol. 2021. PMID: 34105996 Free PMC article.
-
Longitudinal analysis of SARS-CoV-2 spike and RNA-dependent RNA polymerase protein sequences reveals the emergence and geographic distribution of diverse mutations.Infect Genet Evol. 2022 Jan;97:105153. doi: 10.1016/j.meegid.2021.105153. Epub 2021 Nov 18. Infect Genet Evol. 2022. PMID: 34801754 Free PMC article.
-
Mutations in the SARS-CoV-2 spike receptor binding domain and their delicate balance between ACE2 affinity and antibody evasion.Protein Cell. 2024 May 28;15(6):403-418. doi: 10.1093/procel/pwae007. Protein Cell. 2024. PMID: 38442025 Free PMC article. Review.
-
COVID-19: Structural Considerations for Virus Pathogenesis, Therapeutic Strategies and Vaccine Design in the Novel SARS-CoV-2 Variants Era.Mol Biotechnol. 2021 Oct;63(10):885-897. doi: 10.1007/s12033-021-00353-4. Epub 2021 Jun 18. Mol Biotechnol. 2021. PMID: 34145550 Free PMC article. Review.
Cited by
-
Multiple Mutations Associated with Emergent Variants Can Be Detected as Low-Frequency Mutations in Early SARS-CoV-2 Pandemic Clinical Samples.Viruses. 2022 Dec 13;14(12):2775. doi: 10.3390/v14122775. Viruses. 2022. PMID: 36560780 Free PMC article.
-
The Slowing Rate of CpG Depletion in SARS-CoV-2 Genomes Is Consistent with Adaptations to the Human Host.Mol Biol Evol. 2022 Mar 2;39(3):msac029. doi: 10.1093/molbev/msac029. Mol Biol Evol. 2022. PMID: 35134218 Free PMC article.
-
Analysis of SARS-CoV-2 Genomes from West Java, Indonesia.Viruses. 2021 Oct 18;13(10):2097. doi: 10.3390/v13102097. Viruses. 2021. PMID: 34696527 Free PMC article.
-
Relative Consolidation of the Kappa Variant Pre-Dates the Massive Second Wave of COVID-19 in India.Genes (Basel). 2021 Nov 16;12(11):1803. doi: 10.3390/genes12111803. Genes (Basel). 2021. PMID: 34828410 Free PMC article.
-
SARS-CoV-2: is there neuroinvasion?Fluids Barriers CNS. 2021 Jul 14;18(1):32. doi: 10.1186/s12987-021-00267-y. Fluids Barriers CNS. 2021. PMID: 34261487 Free PMC article. Review.
References
-
- WHO. Coronavirus disease 2019 (COVID-19) situation report - 172. Coronavirus Disease (COVID-2019) Situation Reports (2020).
Publication types
MeSH terms
Substances
Grants and funding
LinkOut - more resources
Full Text Sources
Other Literature Sources
Medical
Miscellaneous
