. 2021 Feb 15;11(1):3816.
doi: 10.1038/s41598-020-78678-4.

Molecular changes tracking through multiscale fluorescence microscopy differentiate Meningioma grades and non-tumoral brain tissues

Affiliations

Molecular changes tracking through multiscale fluorescence microscopy differentiate Meningioma grades and non-tumoral brain tissues

Hussein Mehidine et al. Sci Rep. .

Abstract

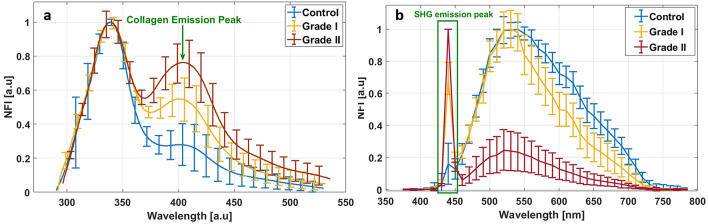
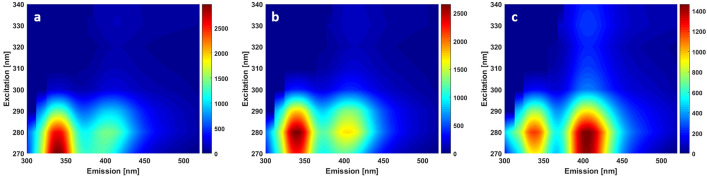
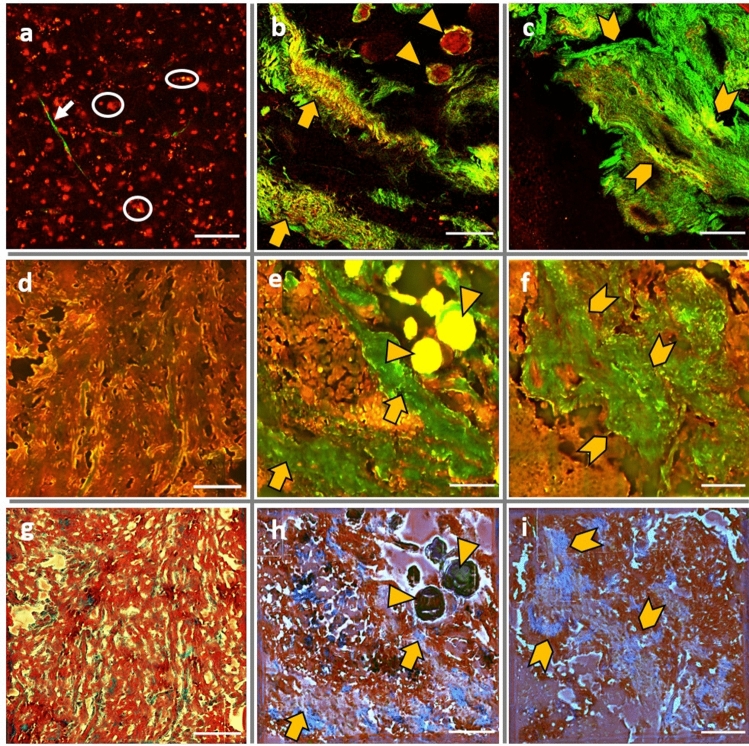
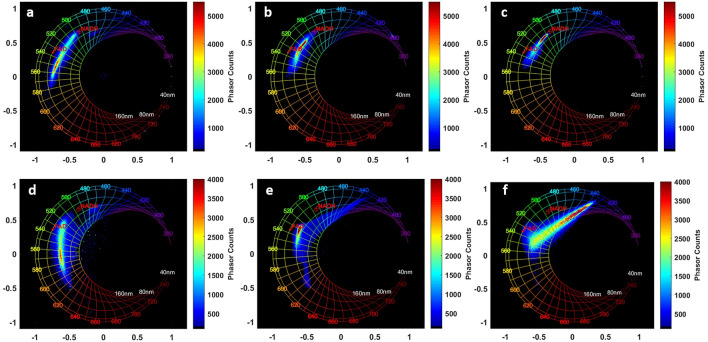
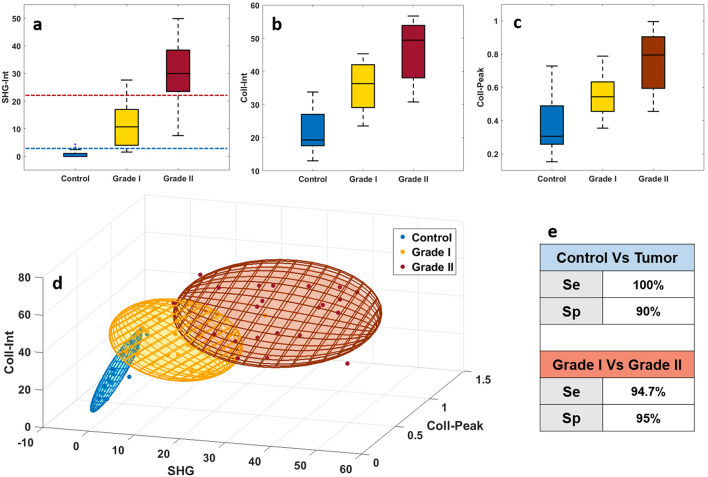
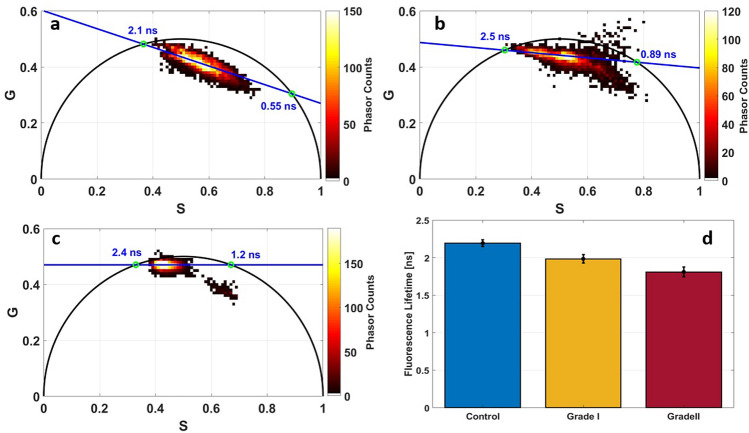
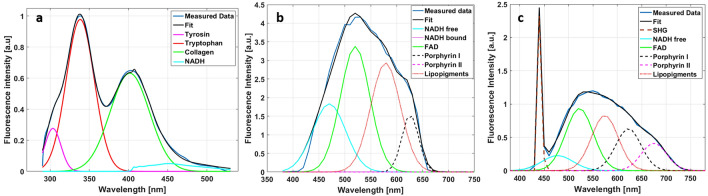
Meningioma is the most common primary intracranial extra-axial tumor. Total surgical removal is the standard therapeutic method to treat this type of brain tumors. However, the risk of recurrence depends on the tumor grade and the extent of the resection including the infiltrated dura mater and, if necessary, the infiltrated bone. Therefore, proper resection of all invasive tumor borders without touching eloquent areas is of primordial in order to decrease the risk of recurrence. Nowadays, none of the intraoperative used tools is able to provide a precise real-time histopathological information on the tumor surrounding areas to help the surgeon to achieve a gross total removal. To respond to this problem, our team is developing a multimodal two-photon fluorescence endomicroscope, compatible with the surgeon tool, to better delimitate tumor boundaries, relying on the endogenous fluorescence of brain tissues. In this context, we are building a tissue database in order to specify each brain tissue, whether healthy or tumoral, with its specific optical signature. In this study, we present a multimodal and multiscale optical measurements on non-tumoral control brain tissue obtained in epilepsy surgery patients and several meningioma grades. We investigated tissue auto-fluorescence to track the molecular changes associated with the tumor grade from deep ultra-violet (DUV) to near infrared (NIR) excitation. Micro-spectroscopy, fluorescence lifetime imaging, two-photon fluorescence imaging and Second Harmonic Generation (SHG) imaging were performed. Several optically derived parameters such as collagen crosslinks fluorescence in DUV, SHG emission in NIR and long lifetime intensity fraction of Nicotinamide Adenine Dinucleotide and Flavins were correlated to discriminate cancerous tissue from control one. While collagen response managed to discriminate meningioma grades from control samples with a 100% sensitivity and 90% specificity through a 3D discriminative algorithm.


Conflict of interest statement

The authors declare no competing interests.

Figures

Figure 1
Figure 1
Spectral analysis using deep UV and NIR excitation range. (a) Normalized mean fluorescence intensity (NFI) spectra of 10 control, 7 grade I and 8 grade II meningioma samples acquired at 275 nm excitation. (b) Normalized mean fluorescence intensity (NFI) spectra of 24 control, 14 grade I and 11 grade II meningioma samples acquired at 890 nm excitation.
Figure 2
Figure 2
(a) Excitation Emission Matrix map in DUV excitation range for control (a), grade I (b) and grade II meningioma (c). The colorbars of each map reflects the emission intensity ot the spectral map.
Figure 3
Figure 3
Image comparison through the NIR and DUV imaging set-up presenting a comparison between control (a,d,g), Grade I meningioma (b,e,h) and Grade II meningioma (c,f,i) through NIR confocal TPF + SHG images (ac) 890 nm as excitation wavelength, and through DUV Tryptophan + Collagen full field images (df) using 275 nm as excitation wavelength. MT3 virtual staining Images (gi); scale bar: 100 µm.
Figure 4
Figure 4
Spectral Phasor histograms using 810 nm (ac) and 890 nm (df) for: Control (a,d), Grade I meningioma (b,e) and Grade II meningioma (c,f).
Figure 5
Figure 5
Group boxplots of six molecular ratios acquired from spectral data at 275 nm (DUV) and 810 nm excitation (NIR) for control, grade I and grade II meningioma. DUV part shows Tryptophan/Collagen (N1), Tryptophan/NADH (N2) and Tryptophan/Tyrosine (N3) ratios. NIR part shows PN ratio (Porphyrins/NADH) (N4), ratio LP (Porphyrins/Lipopigments + Porphyrins) (N5) and redox ratio (FAD/ (NADH + FAD)) (N6) ratios.
Figure 6
Figure 6
(a) Boxplot view of SHG integral proportion (SHG-int) in the total spectra at 890 nm excitation wavelength for control, grade I and grade II meningioma; (b) collagen maximum intensity peak (Coll-peak) using 275 nm as excitation wavelength for control, grade I and grade II meningioma; (c) Collagen integral proportion (Coll-int) in the total spectra acquired using 275 nm Control, Grade I and Grade II meningioma. (d) 3D-discrimination ellipsoids of control, grade I and grade II meningioma where SHG-int, Coll-peak and Coll-int were taken as 3D coordinates. (e) table gathering the sensitivity and specificity of discrimination test results realized for 10 control vs. 15 tumor samples and for 7 grade I vs. 8 grade II meningioma samples.
Figure 7
Figure 7
Fluorescence lifetime analysis of FAD (ac) and NADH (d). Phasor FLIM histogram of FAD using 810 nm as excitation wavelength for control (a), grade I meningioma (b) and grade II meningioma (c), free and protein-bound FAD lifetime values are drawn as green circles intersecting with the universal circle; mean lifetime histogram of protein-bound NADH at 810 nm for control, grade I and grade II meningioma.
Figure 8
Figure 8
Long lifetime intensity fraction (LLIF) histogram of NADH (a,c,e) and FAD (b,d,f) issued from phasor FLIM analysis at 810 nm for Control (a,b), grade I meningioma (c,d) and grade II meningioma (e,f).
Figure 9
Figure 9
Examples of spectral fitting of DUV and NIR collected data. (a) Fitted spectrum acquired using 275 nm as excitation wavelength (a); (b) fitted spectrum acquired using 810 nm as excitation wavelength; (c) fitted spectrum acquired using 890 nm as excitation wavelength.

References

    1. Buckner JC, et al. Central nervous system tumors. Mayo Clin. Proc. 2007;82:1271–1286. doi: 10.4065/82.10.1271. - DOI - PubMed
    1. Louis DN, et al. The 2016 World Health Organization Classification of Tumors of the Central Nervous System: a summary. Acta Neuropathol. (Berl.) 2016;131:803–820. doi: 10.1007/s00401-016-1545-1. - DOI - PubMed
    1. Wiemels J, Wrensch M, Claus EB. Epidemiology and etiology of meningioma. J. Neurooncol. 2010;99:307–314. doi: 10.1007/s11060-010-0386-3. - DOI - PMC - PubMed
    1. Louis, D. N., Ohgaki, H., Wiestler, O. D. & Cavenee, W. K. WHO Classification of Tumours of the Central Nervous System (International Agency for Research on Cancer, 2016).
    1. Backer-Grøndahl, T., Moen, B. H. & Torp, S. H. The histopathological spectrum of human meningiomas. 12. - PMC - PubMed

Publication types

LinkOut - more resources