. 2021 Feb 15;11(1):3802.
doi: 10.1038/s41598-021-82937-3.

Palladin isoforms 3 and 4 regulate cancer-associated fibroblast pro-tumor functions in pancreatic ductal adenocarcinoma

Affiliations

Palladin isoforms 3 and 4 regulate cancer-associated fibroblast pro-tumor functions in pancreatic ductal adenocarcinoma

J I Alexander et al. Sci Rep. .

Abstract

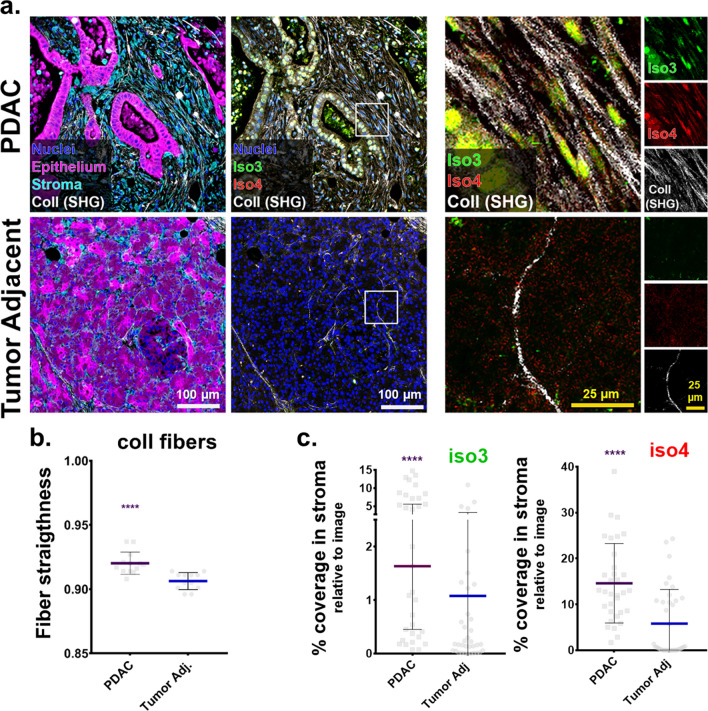
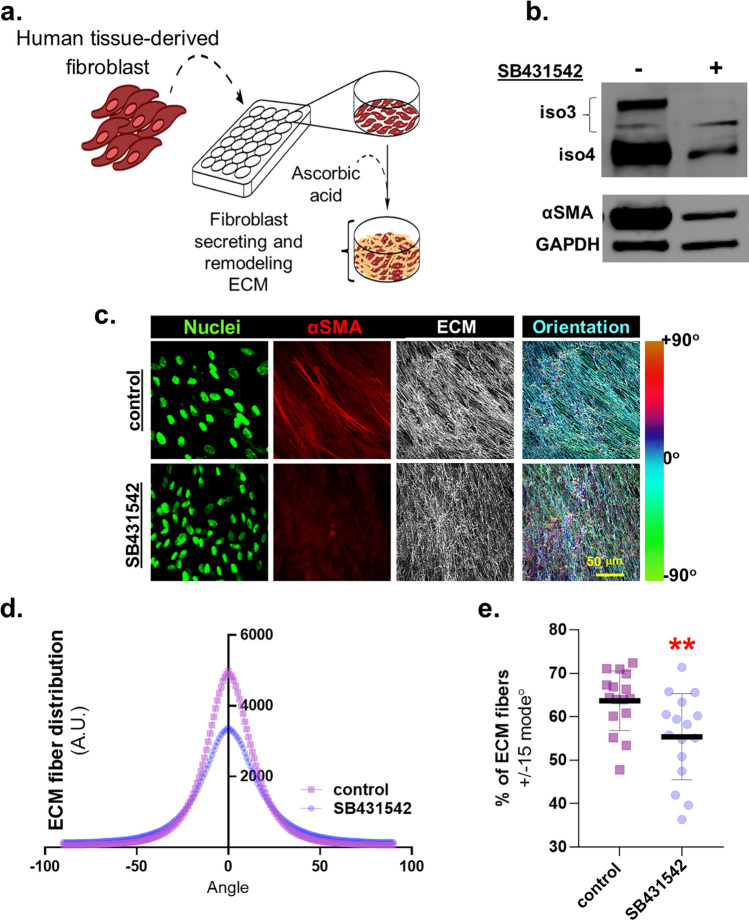
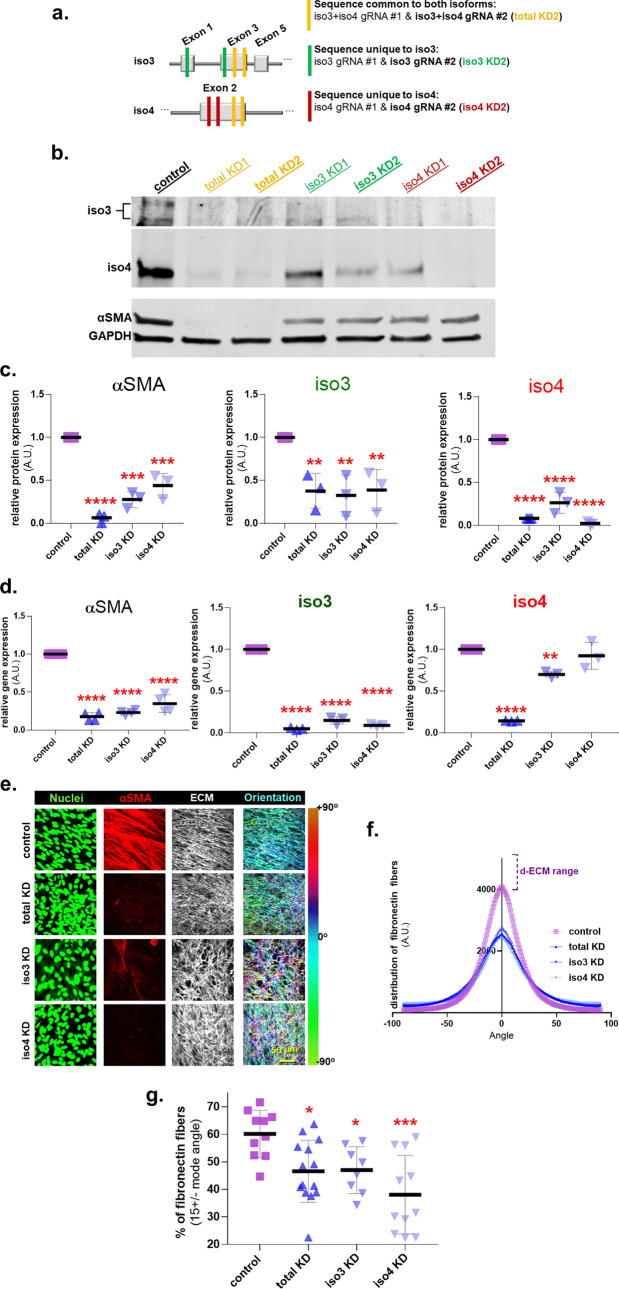
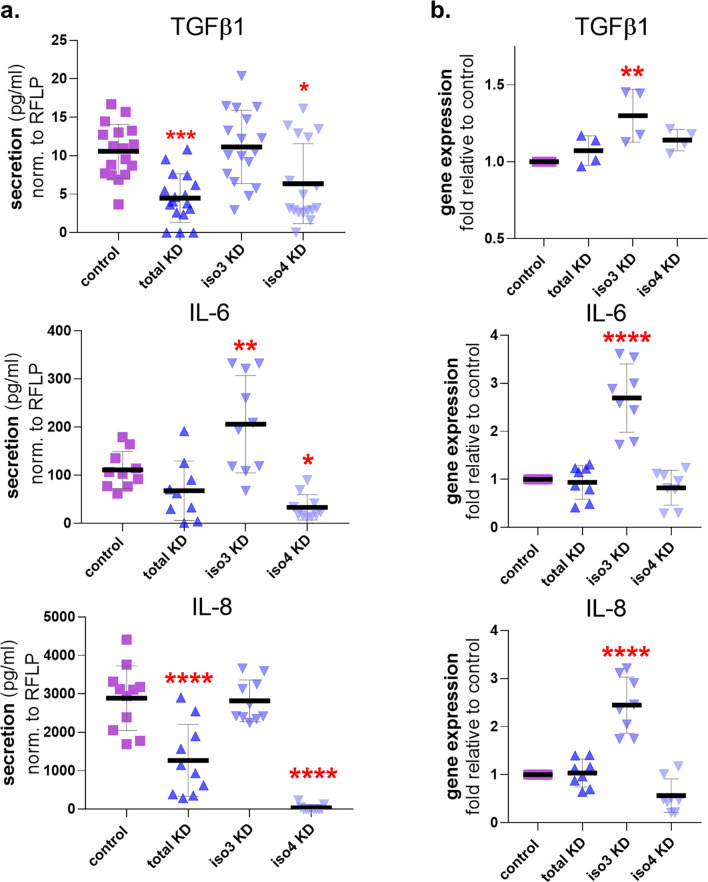
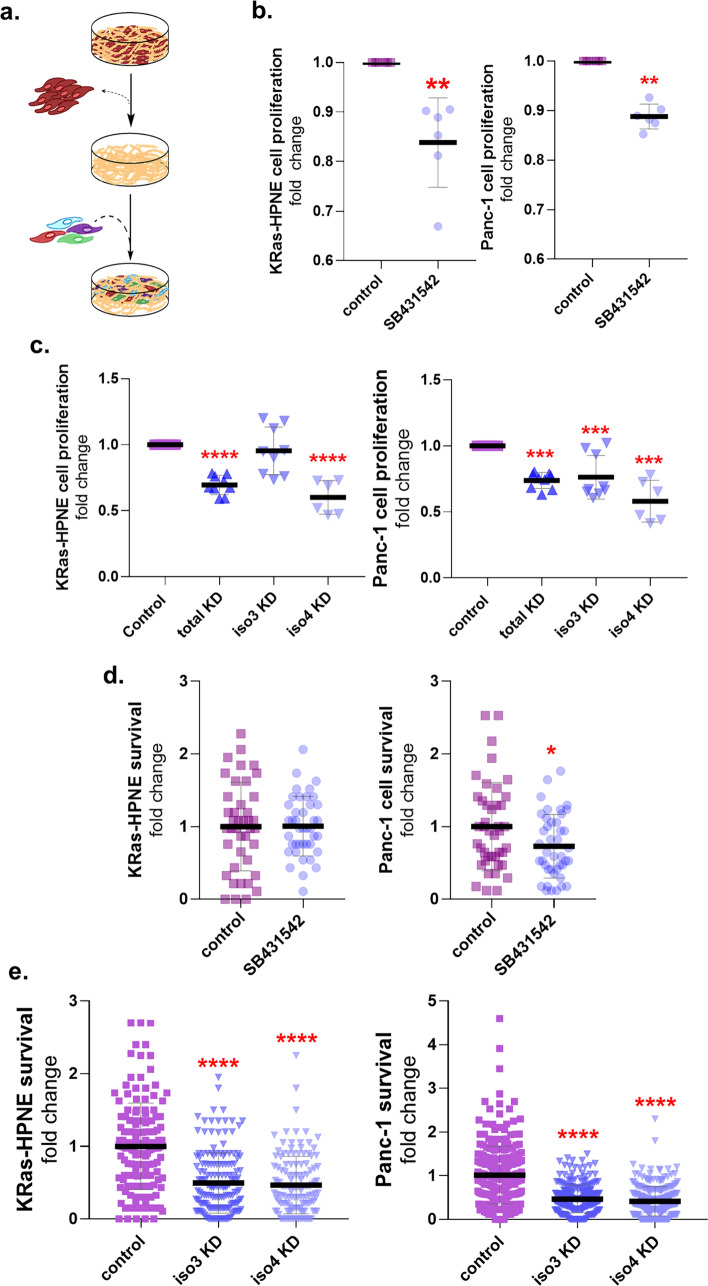
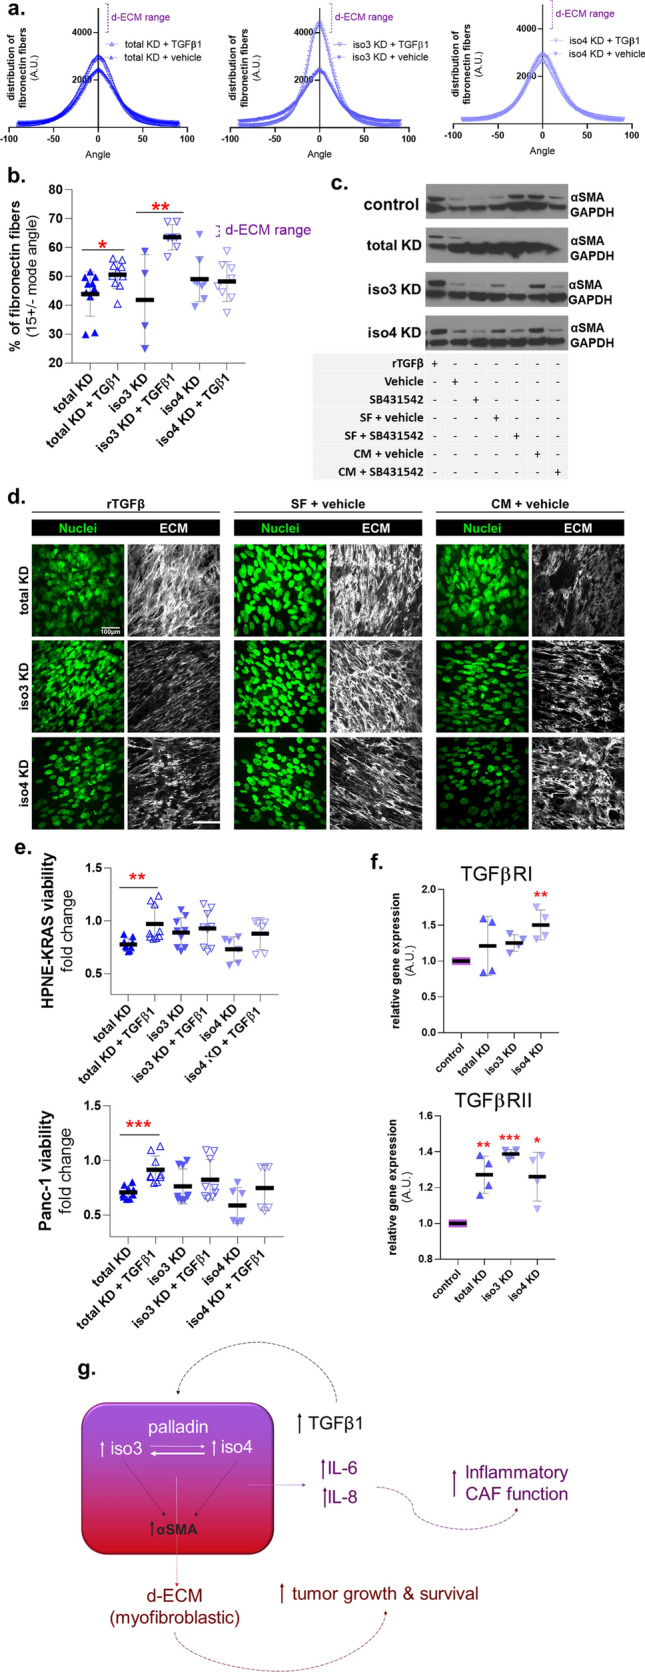
Pancreatic Ductal Adenocarcinoma (PDAC) has a five-year survival under 10%. Treatment is compromised due to a fibrotic-like stromal remodeling process, known as desmoplasia, which limits therapeutic perfusion, supports tumor progression, and establishes an immunosuppressive microenvironment. These processes are driven by cancer-associated fibroblasts (CAFs), functionally activated through transforming growth factor beta1 (TGFβ1). CAFs produce a topographically aligned extracellular matrix (ECM) that correlates with reduced overall survival. Paradoxically, ablation of CAF populations results in a more aggressive disease, suggesting CAFs can also restrain PDAC progression. Thus, unraveling the mechanism(s) underlying CAF functions could lead to therapies that reinstate the tumor-suppressive features of the pancreatic stroma. CAF activation involves the f-actin organizing protein palladin. CAFs express two palladin isoforms (iso3 and iso4) which are up-regulated in response to TGFβ1. However, the roles of iso3 and iso4 in CAF functions remain elusive. Using a CAF-derived ECM model, we uncovered that iso3/iso4 are required to sustain TGFβ1-dependent CAF activation, secrete immunosuppressive cytokines, and produce a pro-tumoral ECM. Findings demonstrate a novel role for CAF palladin and suggest that iso3/iso4 regulate both redundant and specific tumor-supportive desmoplastic functions. This study highlights the therapeutic potential of targeting CAFs to restore fibroblastic anti-tumor activity in the pancreatic microenvironment.


Conflict of interest statement

The authors declare no competing interests.

Figures

Figure 1
Figure 1
Palladin iso3 & iso4 are upregulated in the fibrillar collagen-rich stroma of human PDAC. (a) Representative images depicting epithelial/tumoral areas (magenta) as well as stroma (cyan) areas in surgical tissue sections, pathologically defined as pancreatic cancer (PDAC) or matched normal/benign pancreas (Tumor Adjacent). The images are representative of 3 patient samples that included SMI as well as SHG assessments, while SMI alone was also conducted in 2 additional surgical sample pairs. Epithelial compartments were labeled with antibodies against pan-cytokeratin, EpCAM, and CD-70 identifying all epithelial cells including cancer cells (magenta). Stromal cell compartments were identified using anti-vimentin antibodies (cyan). Nuclei were stained using DRAQ5 dye (blue). Palladin isoforms were identified using antibodies against iso3 (clone G2; green) and iso4 (clone IE6; red). Fibrillar collagen signatures, detected via SHG, are shown in white. Yellow squares correspond to magnified regions, shown to their right, while far right column shows single colored images corresponding to the same magnified regions. Scale bars are provided for each magnification. (b) Evaluation of SHG generated signatures assessing straightness of collagen fibers. Values were obtained using CT-FIRE software (see “Material and methods”). Each bullet point represents a single image. Three images were acquired from each of the three paired patient samples for a total of nine images from PDAC, and nine from matching for Tumor Adjacent samples. (c) Quantification of the percentage coverage of iso3 or iso4 immunostaining within vimentin positive areas, relative to the total image area. Analysis was carried out using readouts generated by the SMIA-CUKIE 2.1.0 software (see “Materials and methods”). Data presented in (c) correspond to specimens evaluated from all 5 patients, and included a minimum of 5 images per specimen. Graphs show median with 95% CI. Mann Whitney test was used to determine statistical significance: **** p < 0.0001.
Figure 2
Figure 2
Inhibition of TGFβ1 signaling reduces CAF iso3 & iso4 expression and d-ECM alignment. (a) Schematic of 3D fibroblastic cell-derived ECM model used to assess assorted CAF function and/or traits. (b) Representative Western blot, using lysates collected at the end of ECM production, and blotted for palladin iso3 and iso4 as well as αSMA expression in vehicle vs. SB431542 treated CAFs. GAPDH served as loading control. (c) CAF-derived ECMs were treated during ECM production as in (b); shown are representative images of reconstructed confocal image stacks of human fibroblasts in 3D cultures. Images show dye-labeled nuclei in green, immunofluorescently-labeled αSMA (in red), and fibronectin (ECM in white). Scale bar: 50 microns. Last column shows pseudo-colored ECM, depicting corresponding fiber angles distribution, referenced to tone/angle bar on the right; with cyan fibers as the mode angle. Note how ECM fiber analysis of CAFs cultured in the presence of SB431542, included additional fiber color tones suggestive of broader angle distribution compared to control condition. ECM analyses of images acquired in (c) were conducted measuring: ECM fiber angle distributions (d) and percentage of ECM fibers out of total fibers at 15° from the mode angle (e). Data presented were derived from 6 biological replicates (n = 6) and a minimum of 5 images acquired per sample. The Mann Whitney test was used to determine statistical significance. **p = 0.0096.
Figure 3
Figure 3
Palladin isoforms are required for CAFs to sustain a myofibroblastic cell identity. (a) Schematic illustrating the gRNA strategy (for CRISPR/Cas9) used to generate plasmids that target coding sequence common for both isoforms (total KD: yellow lines) or either palladin isoform (iso3 KD: green line, iso4 KD: red line). (b) Representative images of western blot analysis of palladin isoforms and αSMA, using GAPDH as loading controls, in CAFs at the end of ECM production. The upper panel corresponds to the upper portion of the middle panel shown at a higher exposure to highlight iso3 bands, while the middle panel clearly shows iso4. The bottom panel corresponds to αSMA and GAPDH (note that these images were cropped from images generated using the LICOR system). (c) Graphs corresponding to measured protein expression levels of samples as in (b) normalized to 1 arbitrary unit assigned for expression of the assorted protein/GAPDH in control CAF cultures. (d) Graphs depicting relative RT-qPCR quantification of transcripts corresponding to αSMA, iso3, and iso4 normalized to control CAFs, which were set to one arbitrary unit in each experiment. (e) Representative images of control vs palladin KD CAFs at the end of ECM production (selecting for substantial ECM produsing samples). Unextracted 3D cultures were subjected to indirect immunofluorescence. Images show in green, nuclei; in red, αSMA and in white, fibronectin (ECM). Pseudo-colored images depict fibronectin fiber angle distributions corresponding to tone bar on the right, showing cyan fibers as mode angle. ECM fibers of control CAFs present greater levels of cyan pseudo-colored fibers compared to palladin KD CAFs. Scale bar: 50 microns. Analyses of images acquired as in (e) were conducted measuring: fibronectin ECM fiber angle distributions (f) and percentage of ECM fibers out of total fibers at 15° from the mode angle (g). Data presented is derived from experimental duplicates of biological triplicates which rendered enough ECM to conduct the meassurements (n = 6). Each sample was represented by a minimum of 5 images. One Way ANOVA, Dunnett’s multiple comparison test was performed to determine statistical significance compared to control CAFs or alignment threshold * p < 0.05, ** p < 0.01, *** p < 0.001, **** p < 0.0001.
Figure 4
Figure 4
Palladin iso4 is required for CAFs to sustain inflammatory features. (a) Measurement of secreted cytokines TGFβ1, IL-6, and IL-8 by palladin KD CAFs normalized to cell number via RFLP expression and compared to control CAF secretions using assorted CAF conditioned media at the end of 5 days ECM production (see “Materials and methods” for additional details). (b) Gene expression RT-qPCR transcript analysis of TGFB1 (TGFβ1), IL6 (IL-6), and CXCL8 (IL-8) in palladin KD CAFs, compared to control CAF at the end of 5 days d-ECM production. Data presented were derived from a minimum of 4 experimental replicates of biological duplicates (n = 8). One Way ANOVA, Dunnett’s multiple comparison test was performed to determine statistical significance compared to control CAFs. *p < 0.05; ** p < 0.01; ***p < 0.001; **** p < 0.0001.
Figure 5
Figure 5
Palladin isoforms are required for CAFs to produce functional, pro-tumor, desmoplastic ECM. (a) Schematic of experimental design to assess pro-tumor function of CAF-derived matrices. CAFs are represented by the dark red cells, which are extracted to render cell voided ECMs. Cell free ECMs (deemed substantial following ECM thickness assessments) are re-plated with tumor cells (depicted as multicolored cells) and their proliferation and survival are assessed. (b) Graphs depicting metabolic capacity (i.e., proliferation), as determined by the Alamar Blue assay, of KRas-HPNE (LEFT) or Panc-1 (RIGHT) cells cultured in ECMs derived from vehicle or SB431542 treated CAFs. (c) Alamar Blue assay conducted to quantify KRas-HPNE and Panc-1 cell metabolic activity (i.e., proliferation) when cells were cultured in ECMs produced by palladin KD CAFs vs control CAFs. (d,e) RFP expressing KRas-HPNE or Panc-1 cells were cultured in assorted CAF-generated ECMs in the absence of serum and glutamine for 48hrs. Graphs depict the levels of tumorigenic cell survival under nutritional stress compared to Control CAF-generated d-ECMs. Data presented in (b,c) were derived from experimental triplicates of biological duplicates (n = 6), while data in (d,e) were derived from experimental triplicates (n = 3) and biological triplicates (n = 9) respectively. A minimum of three images per (d,e) sample were acquired, dots represent one image. The Mann Whitney Test was performed in (b,d) while the One-Way ANOVA, Dunnett’s multiple comparison test was performed in (c,e) *p < 0.05; ** p < 0.01; ***p < 0.001; **** p < 0.0001.
Figure 6
Figure 6
Adding recombinant TGFβ1 to palladin KD CAFs restores some pro-tumor features. (a) Palladin KD CAFs were treated with vehicle or recombinant TGFβ1 during ECM production. CAF cultures that produced enough ECM were included in these assessments. Analyses of images acquired as before were conducted to measure fibronectin ECM fiber angle distributions and (b) percentage of ECM fibers out of total fibers at 15° from the mode angle. (c) Palladin KD CAFs were treated with rTGFβ as in (a), cultures used represented mutants that did not generate enough ECM and controls were compared to mutant CAFs treated with DMSO (vehicle), TGFβ inhibitor (SB431542), 50% serum free media with complete DMEM plus DMSO (SF + vehicle), 50% Panc1 conditioned media and complete DMEM plus DMSO (CM + vehicle), or 50% Panc1 conditioned media complemented with complete DMEM plus TGFβ inhibitor (SB431542). (d) Confocal immunofluorecent images corresponding to (c), showing how poor ECM production cannot be restored with rTGFβ or Panc1 conditioned media. (e) KRas-HPNE and Panc-1 proliferation in ECMs generated as described in (a). (f) RT-qPCR transcript analysis of TGFβ1 type I and II receptors gene expression in palladin KD CAFs compared to control CAFs. Data presented were derived from biological triplicates for (a,b,e) three biological replicates in triplicates for (c,d), and a biological duplicate in (f) (n = 4). One Way ANOVA, Dunnett’s multiple comparison test was performed on all analyses where *p < 0.05; ** p < 0.01; ***p < 0.001; **** p < 0.0001. (g) Summary cartoon depicting cell autonomous TGFβ1 dependency of CAFs in a palladin dependent manner. The cartoon also shows that while both isoforms regulate each other, and are needed for myofibroblastic features like increased αSMA and production of d-ECM with pro tumoral features, iso4 is mostly needed for inflammatory CAF identity (i.e., secretion of IL-6).

Similar articles

Cited by

References

    1. Rahib L, et al. Projecting cancer incidence and deaths to 2030: The unexpected burden of thyroid, liver, and pancreas cancers in the United States. Cancer Res. 2014;74:2913–2921. doi: 10.1158/0008-5472.CAN-14-0155. - DOI - PubMed
    1. Drifka CR, et al. Highly aligned stromal collagen is a negative prognostic factor following pancreatic ductal adenocarcinoma resection. Oncotarget. 2016;7:76197–76213. doi: 10.18632/oncotarget.12772. - DOI - PMC - PubMed
    1. Pereira BA, et al. Caf subpopulations: A new reservoir of stromal targets in pancreatic cancer. Trends Cancer. 2019;5:724–741. doi: 10.1016/j.trecan.2019.09.010. - DOI - PubMed
    1. Sahai E, et al. A framework for advancing our understanding of cancer-associated fibroblasts. Nat. Rev. Cancer. 2020;20:174–186. doi: 10.1038/s41568-019-0238-1. - DOI - PMC - PubMed
    1. Rhim AD, et al. Stromal elements act to restrain, rather than support, pancreatic ductal adenocarcinoma. Cancer Cell. 2014;25:735–747. doi: 10.1016/j.ccr.2014.04.021. - DOI - PMC - PubMed

Publication types

MeSH terms