. 2021 Aug;35(8):2285-2298.
doi: 10.1038/s41375-021-01166-9. Epub 2021 Feb 15.

Cytoplasmic DROSHA and non-canonical mechanisms of MiR-155 biogenesis in FLT3-ITD acute myeloid leukemia

Affiliations

Cytoplasmic DROSHA and non-canonical mechanisms of MiR-155 biogenesis in FLT3-ITD acute myeloid leukemia

Le Xuan Truong Nguyen et al. Leukemia. 2021 Aug.

Erratum in

Abstract

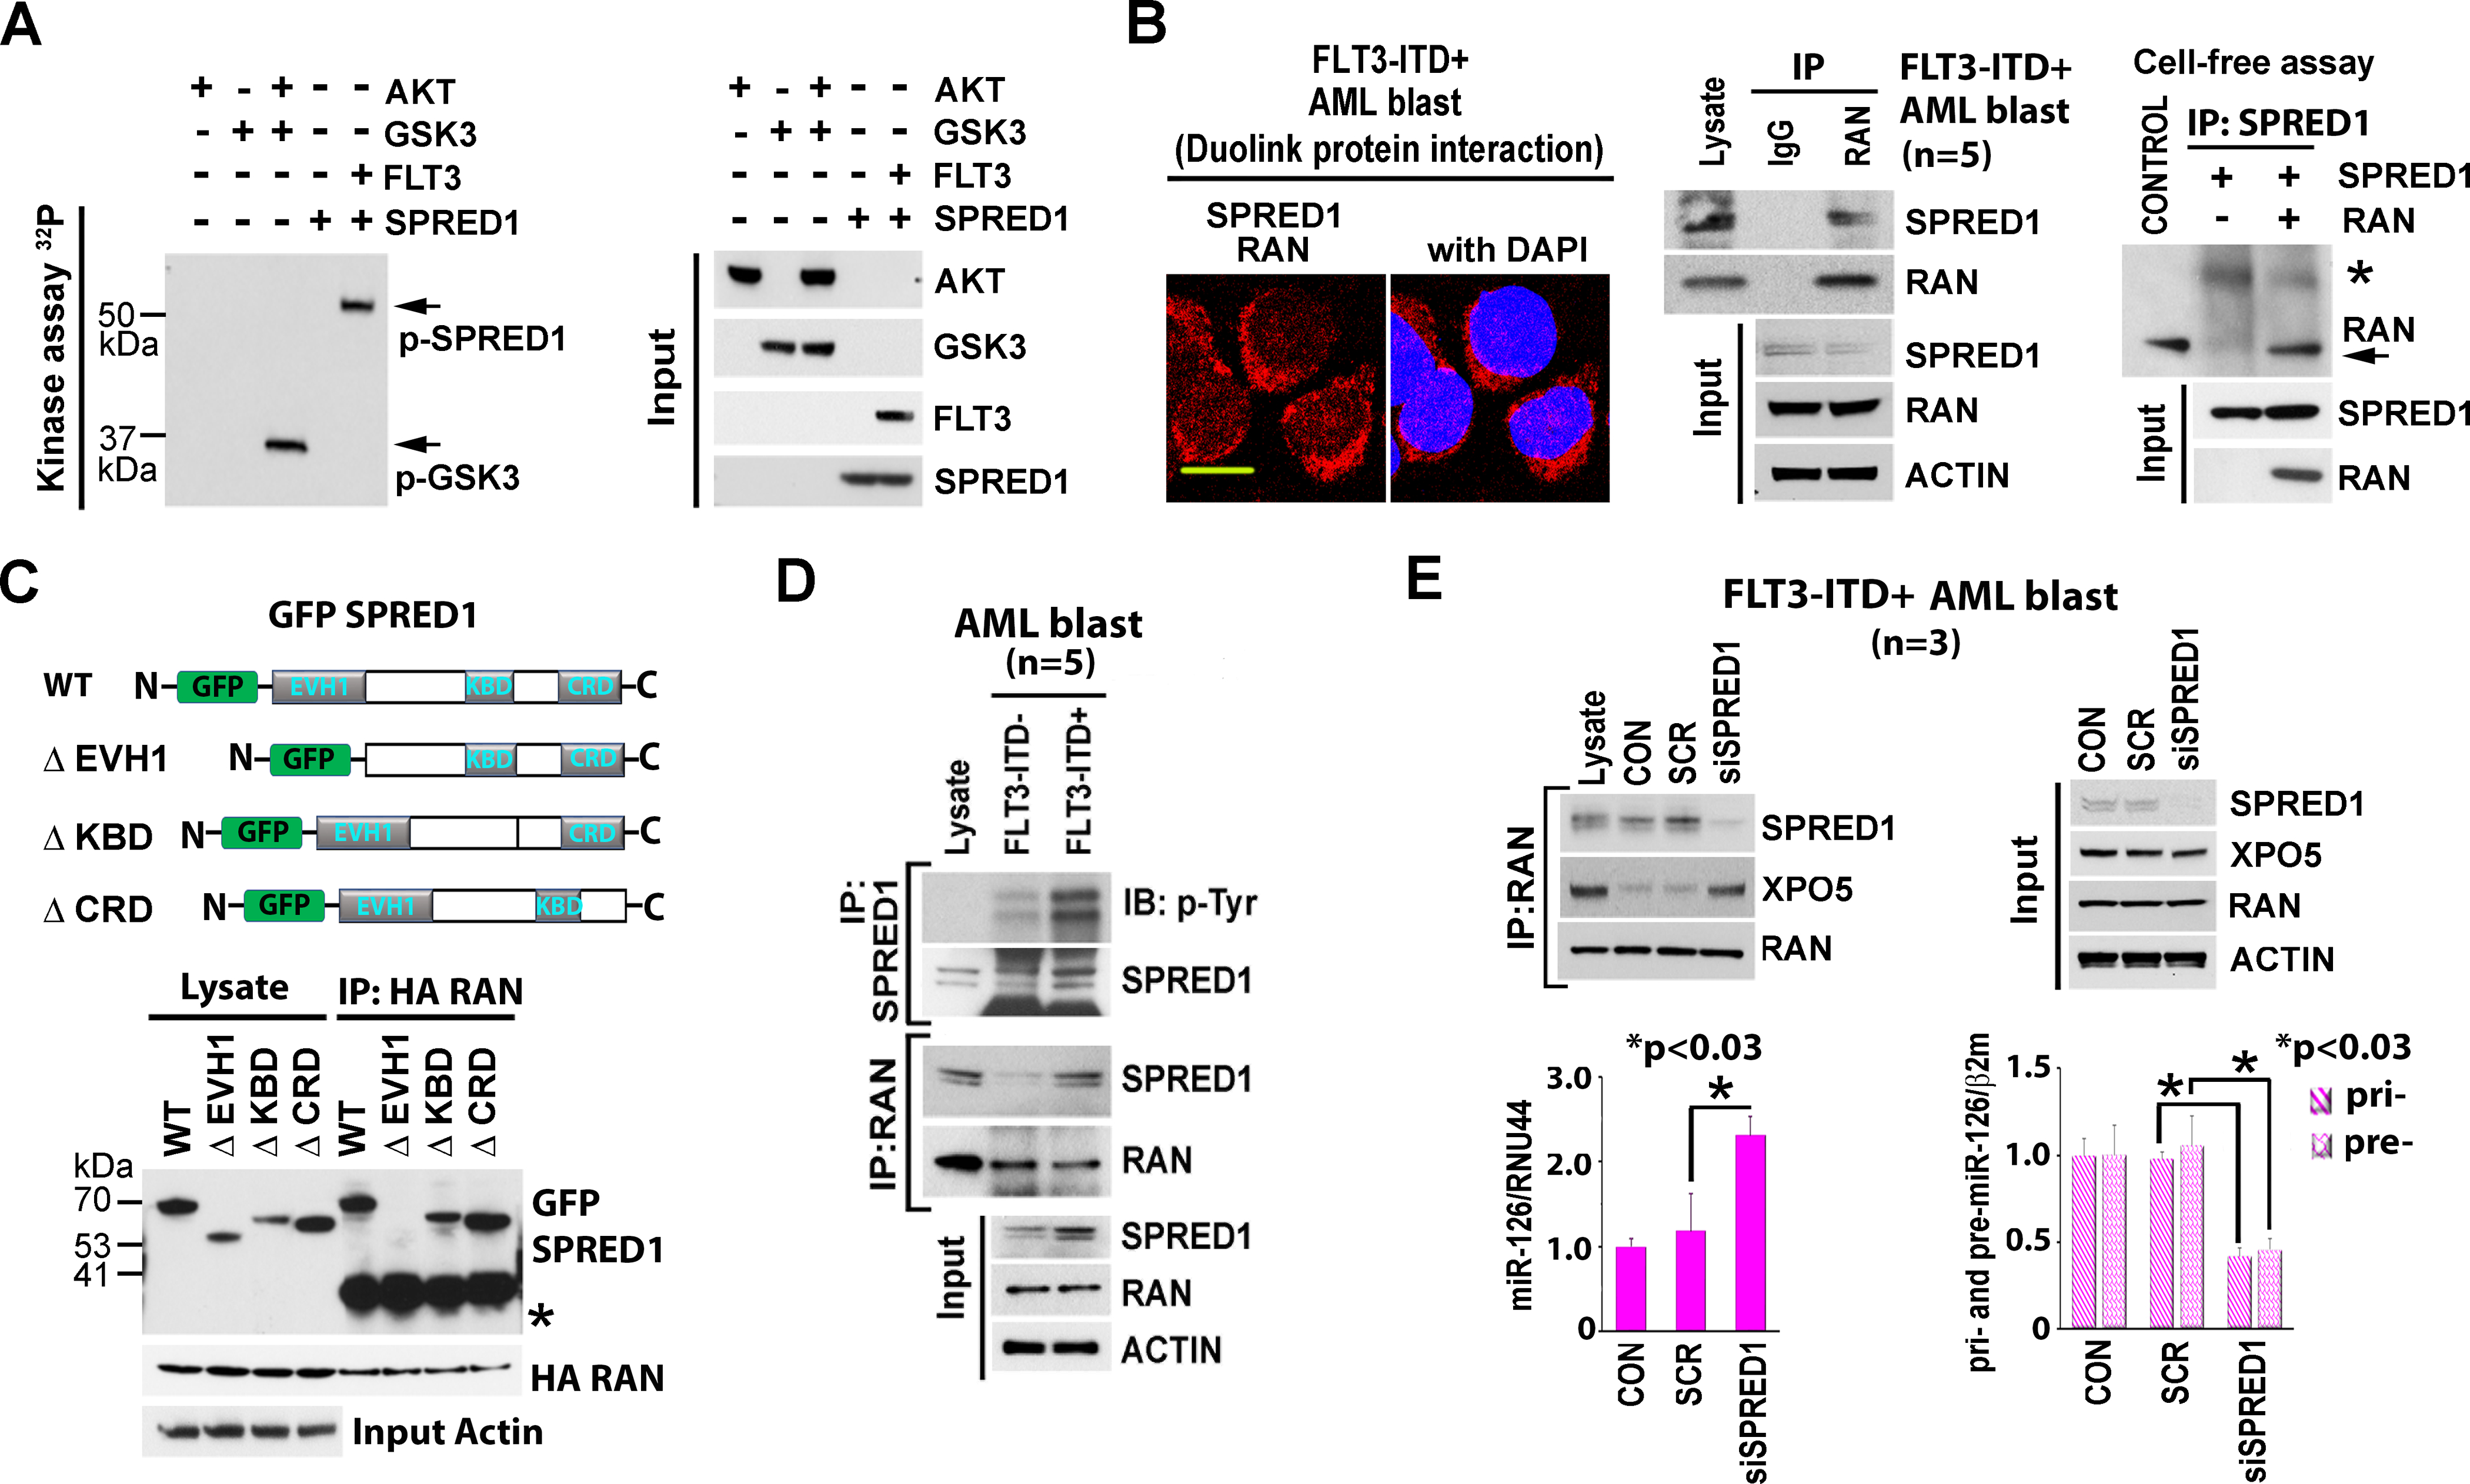
We report here on a novel pro-leukemogenic role of FMS-like tyrosine kinase 3-internal tandem duplication (FLT3-ITD) that interferes with microRNAs (miRNAs) biogenesis in acute myeloid leukemia (AML) blasts. We showed that FLT3-ITD interferes with the canonical biogenesis of intron-hosted miRNAs such as miR-126, by phosphorylating SPRED1 protein and inhibiting the "gatekeeper" Exportin 5 (XPO5)/RAN-GTP complex that regulates the nucleus-to-cytoplasm transport of pre-miRNAs for completion of maturation into mature miRNAs. Of note, despite the blockage of "canonical" miRNA biogenesis, miR-155 remains upregulated in FLT3-ITD+ AML blasts, suggesting activation of alternative mechanisms of miRNA biogenesis that circumvent the XPO5/RAN-GTP blockage. MiR-155, a BIC-155 long noncoding (lnc) RNA-hosted oncogenic miRNA, has previously been implicated in FLT3-ITD+ AML blast hyperproliferation. We showed that FLT3-ITD upregulates miR-155 by inhibiting DDX3X, a protein implicated in the splicing of lncRNAs, via p-AKT. Inhibition of DDX3X increases unspliced BIC-155 that is then shuttled by NXF1 from the nucleus to the cytoplasm, where it is processed into mature miR-155 by cytoplasmic DROSHA, thereby bypassing the XPO5/RAN-GTP blockage via "non-canonical" mechanisms of miRNA biogenesis.


Conflict of interest statement

Disclosure of Potential Conflicts of Interest

The authors declare that there is no conflict of interest regarding the publication of this article.

Figures

Fig. 1:
Fig. 1:. FLT3-ITD down-regulates miR-126 expression.
a miR-126 expression in FLT3-ITD+ vs FLT3-ITD- AML patients from a public database (left) and in BM primary CD34+ blasts (right). For BM primary CD34+ blasts, total RNA was extracted and levels of miR-126 were measured by q-PCR. b Comparison of miR-126 levels in BM MNC immunophenotypic subpopulations from wild type (wt) vs MllPTD/wt/Flt3ITD/ITD AML mice. BM MNCs were isolated from each group of mice and subpopulations were isolated using flow cytometry (as described in Methods). MiR-126 expression was measured by q-PCR; (each group, n=3). c LSK cells from wt mice (n=3) transduced with control (CON) or FLT3-ITD lentivirus vectors. FLT3-ITD (left) and miR-126 (right) expression levels were measured by q-PCR at 48 hours. d, e miR-126 expression in CD34+ blasts from healthy donor or FLT3-ITD- vs FLT3-ITD+ AML patients treated ex-vivo with DMSO (CON) or the tyrosine kinase inhibitor AC220 (20 nM) measured by q-PCR (d) or staining with SmartFlare miR-126 probes (e). The cells were treated with DMSO or AC220 for 24 hours. f Mature miR-126 (left), pri-miR-126 (middle), and pre-miR-126 (right) expression in FLT3-ITD- (n=12) and FLT3-ITD+ (n=12) AML blasts. Levels of pri-, pre- and mature miR-126 were measured by q-PCR. g FLT3-ITD- and FLT3-ITD+ AML blasts (each group, n=3) were treated with DMSO or 20 nM AC220 for 24 hours. Left, pri-miR-126 by q-PCR. Right, Northern blot to detect pre-miR-126 and mature miR-126. Unless otherwise noted, results from triplicate experiments are shown, error bars represent SD. Significance was calculated using unpaired t test, “p” values are shown. Scale bar, 10 μm.
Fig. 2:
Fig. 2:. Inhibition of XPO5/RAN by SPRED1.
a SPRED1 phosphorylation by FLT3. Cell-free in vitro kinase phosphorylation assay performed using AKT, GSK3, FLT3, and SPRED1 recombinant proteins. AKT phosphorylated GSK3 was used as a positive control for the phosphorylation assay. Left, phosphorylation of SPRED1 and GSK3. Right, input controls of recombinant proteins using in kinase assay. b Interaction between SPRED1 and RAN in FLT3-ITD+ AML blasts demonstrated by Duolink protein interaction assay (left) and co-immunoprecipitation assay (middle). For immunoprecipitation assay, the lysate was immunoprecipitated with anti-IgG control or anti-RAN antibodies and immunoblotted with anti-SPRED1 and anti-RAN antibodies. Input controls are shown. Right, direct interaction of SPRED1 and RAN demonstrated by cell-free binding assay with recombinant proteins. SPRED1 and RAN recombinant proteins were incubated in the binding buffer overnight and the complex was immunoprecipitated with anti-SPRED1 antibody and immunoblotted with anti-RAN antibody. *, nonspecific band. c Mapping binding domain of SPRED1 with RAN. Top, schematic presentation of the SPRED1 constructs used to map the binding domain of SPRED1 on RAN as shown on bottom. Bottom, immunoprecipitation of GFP-SPRED1 proteins overexpressed together with HA-RAN in MV-4–11 cells using anti-HA and anti-GFP antibodies. Input controls of protein expression are shown. d SPRED1 phosphorylation and SPRED1 and RAN physical interaction in FLT3-ITD- vs FLT3-ITD+ AML blasts. Five samples of each group were pooled for the assay. The lysate was immunoprecipitated with anti-SPRED1 or anti-RAN antibodies and immunoblotted with indicated antibodies. e Effects of SPRED1 knock down (KD) by siRNAs (40 nM) on miR-126. FLT3-ITD+ AML blasts (n=3) were transfected with siSCR or siSPRED1 for 24 hours. Top, interaction of SPRED1, RAN and XPO5 determined by immunoprecipitation. Three samples of each group were pooled for the assay. Input controls are shown on the right. Bottom, miR-126 and pri- and pre-miR-126 expression as assessed by q-PCR. Unless otherwise noted, results from triplicate experiments are shown, error bars represent SD. Significance was calculated using unpaired t test, “p” values are shown. Scale bar, 10 μm.
Fig. 3:
Fig. 3:. Regulation of DDX3X activities in FLT3-ITD cells.
a BIC-155 unspliced and spliced levels in FLT3-ITD- and FLT3-ITD+ AML blasts. The FLT3-ITD- or FLT3-ITD+ blasts were treated with vehicle (CON), AC220 or siAKT (each, n=3) for 24 hours and analyzed for unspliced and spliced BIC-155 expression by RT-PCR (see Methods for assay and primer sequences). Semiquantitative expression levels are shown on right. b AKT phosphorylates DDX3X. Left, AKT phosphorylation motif on CDS of DDX3X protein. The AKT phosphorylation motif (RXRXX-S/T) is shown at Serine 590. Right, in vitro phosphorylation assay using recombinant proteins of AKT, GSK3 and DDX3X. AKT phosphorylated GSK3 was used as a positive control for phosphorylation assay. Top, phosphorylation of DDX3X and GSK3. Bottom, input controls of recombinant proteins using in kinase assay. c DDX3X ATPase activity in FLT3-ITD- and FLT3-ITD+ AML blasts (each, n=3). Left, whole protein lysate from FLT3-ITD- or FLT3-ITD+ AML blasts were immunoprecipitated (IP) with anti-DDX3X antibody and immunoblotted with anti-phospho-Serine/Threonine antibody. Right, Fold ATPase activity is shown. d ATPase activity of AKT-phosphorylated DDX3X. FLT3-ITD- AML blasts (n=5) were transfected with indicated constructs for 24 hours. Left, efficacy of Flag DDX3X pull down is shown. Right, fold ATPase activity is shown. Unless otherwise noted, results from triplicate experiments are shown, error bars represent SD. Significance was calculated using unpaired t test, “p” values are shown.
Fig. 4:
Fig. 4:. Regulation of BIC-155 splicing by DDX3X and hnRNP U.
a Interaction between DDX3X and hnRNP U. Left, co-localization between DDX3X and hnRNP U in FLT3-ITD- AML blast. The cells were stained with anti-DDX3X (red) and anti-hnRNP U (green) antibodies and images were taken under confocal microscope. Pearson correlation (p) value = 0.69 ± 0.08. Middle, protein lysate from FLT3-ITD- AML blasts (n=5) was used for immunoprecipitation and immunoblotting using anti-DDX3X and anti-hnRNP U antibodies. Right, cell-free binding assay using recombinant DDX3X and hnRNP U protein. DDX3X and hnRNP U recombinant proteins were incubated in the binding buffer for overnight and the complex was immunoprecipitated with anti-DDX3X antibody and immunoblotted with anti-DDX3X and anti-hnRNP U antibodies. b Effects of DDX3X KD on pri-, pre- and miR-155 levels. FLT3-ITD- AML blasts (n=5) were transfected with siSCR or siDDX3X (20 nM) for 24 hours Levels of miR-155 (left), pri- and pre-miR-155 (right) were measured by q-PCR. c Rescued effects of DDX3X WT, DQAD or S590D mutant on siDDX3X-regulated BIC-155 splicing. The FLT3-ITD- AML blasts (n=5) were transfected with siDDX3X (20 nM) and then continuously transfected with DDX3X WT, DQAD or S590D mutant. Left, interaction between unspliced BIC-155 and hnRNP U (by RIP assay, see Methods) and IP and IB controls. Right, expression of spliced and unspliced forms of BIC-155 by RT-PCR. Optical density ratio is shown. d Effects of hnRNP U KD on DDX3X regulated BIC-155 splicing. FLT3-ITD- AML blasts (n=5) were transfected with DDX3X WT in the presence of siSCR or sihnRNP U (20 nM) for 24 hours. The interaction of DDX3X and hnRNP U are on the left and levels of unspliced BIC-155 binding with hnRNP U and total unspliced BIC-155 are on the right. e Different levels of DDX3X binding with hnRNP U and miR-155 expression between FLT3-ITD- and FLT3-ITD+ AML blasts (each, n=3). Left, interaction between DDX3X and hnRNP U determined by IP. Middle, the levels of unspliced BIC-155 bound to hnRNP U determined by RIP assay. Right, miR-155 levels determined by q-PCR. Unless otherwise noted, results from triplicate experiments are shown, error bars represent SD. Significance was calculated using unpaired t test, “p” values are shown. Scale bar, 10 μm.
Fig. 5:
Fig. 5:. Lnc-RNA hosted miR-155 transportation by NXF1.
a, b Fractionated cytoplasm and nuclear distribution of unspliced BIC-155 in FLT3-ITD+ AML blasts. a The cells were fractionated into cytoplasmic and nuclear fraction. Expression of unspliced and spliced BIC-155 in indicated cells were assessed by RT-PCR. Densitometry quantification of RT-PCR results of unspliced BIC-155 and spliced BIC-155 are shown. b In situ hybridization was performed on the indicated cells with specific probes targeting BIC-155. Representative images are shown. c BIC-155/NXF1 binding in FLT3-ITD- and FLT3-ITD+ AML blasts. Left, the FLT3-ITD- or FLT3-ITD+ blasts (each, n=3) were analyzed for levels of BIC-155 binding to NXF1 using RNA-binding protein immunoprecipitation (RIP) assay (see Methods) and miR-155 using q-PCR. Right, the FLT3-ITD+ blasts (n=3) were treated with AC220 or vehicle for 24 hours and interaction of BIC-155/NXF1 and miR-155 levels were analyzed. d-f Effects of NXF1 KD on cellular distribution of BIC-155 and expression of miRNAs. MV-4–11 cells were treated with LPS for 24 hours in the presence of siSCR, siXPO5, or siNXF1. d Interaction between BIC-155 and NXF1 by RIP assay. e Left, cell images with in situ hybridization of BIC-155. Right, quantitative analysis of cellular distribution of BIC-155. f Levels of miR-126 and miR-155 were measured by q-PCR. Significance was calculated using unpaired t test, “p” values are shown. Scale bar, 10 μm.
Fig. 6:
Fig. 6:. Lnc-RNA hosted miR-155 processing by cytoplasmic DROSHA.
a, b Cellular distribution of DROSHA in FLT3-ITD-, FLT3-ITD+ AML blasts and normal peripheral blood mononuclear cells (PBMC). a Representative image of DROSHA staining in three individual FLT3-ITD- and FLT3-ITD+ AML blasts (left) and in MV-4–11 cells, FLT3-ITD+ AML blast, and PBMC cells (right). The images were taken under confocal microscope. b Immunoblot of cellular fractionation with indicated antibodies. The indicated cells were fractionated to cytoplasmic and nuclear fractions and immnublotting was performed with indicated antibodies. c, d Effects of DROSHA isoforms on miR-126 and miR-155 expression. MV-4–11 cells were transfected with siDROSHA to knock down (KD) expression of endogenous DROSHA and then transfected with each DROSHA isoform to assess the role of the individual isoforms. c Expression levels of miR-126 and miR-155 by q-PCR is shown on (left). Right, control immunoblotting with indicated antibodies. d Representative images of cells staining with indicated miRNA SmartFlare probes (see Methods). e, f Effects of DROSHA isoforms on intronic and lnc-RNA hosted miRNAs expression. MV-4–11 cells were transfected as described in (c, d). Expression levels of lnc-RNA-hosted miRNAs by q-PCR is shown on (e) and that of intronic miR-146b on (f). Unless otherwise noted, results from triplicate experiments are shown, error bars represent SD. Significance was calculated using unpaired t test, “p” values are shown. Scale bar, 10 μm.
Fig. 7:
Fig. 7:. Regulation of miR-155 processing by DDX3X/NXF1/cytoplasmic DROSHA in BM Lin-cells from Flt3-ITD mice.
a In vivo experimental design. The lineage-negative (Lin-) stem-progenitor cell population from BM were isolated from Flt3 wild type (wt) or Flt3-ITD (MllPTD/wt/Flt3ITD/ITD) mice to analyze as indicated (each group, n=3). b, c Expression of DDX3X and BIC-155 splicing in Lin- cells from Flt3-wt and Flt3-ITD mouse. b Level of DDX3X was examined by immunoblotting. c Unspliced or spliced BIC-155 was examined by RT-PCR. d Cellular distribution of DROSHA in Lin- cells from Flt3-wt and Flt3-ITD mice. Immunoblot of cellular fractionation with indicated antibodies is shown. e Levels of miR-155 were measured by staining with SmartFlare probes (left) and q-PCR (right). f Schematic model of regulation miR-155 expression in FT3-ITD+ AML cells through regulation of DDX3X/NXF1/cytoplasmic DROSHA. Unless otherwise noted, results from triplicate experiments are shown, error bars represent SD. Significance was calculated using unpaired t test, “p” values are shown. Scale bar, 10 μm.

Similar articles

Cited by

References

    1. Ha M, Kim VN. Regulation of microRNA biogenesis. Nat Rev Mol Cell Biol. 2014;15:509–24. - PubMed
    1. Garzon R, Garofalo M, Martelli MP, Briesewitz R, Wang L, Fernandez-Cymering C, et al. Distinctive microRNA signature of acute myeloid leukemia bearing cytoplasmic mutated nucleophosmin. Proc Natl Acad Sci U S A. 2008;105:3945–50. - PMC - PubMed
    1. Liao Q, Wang B, Li X, Jiang G. miRNAs in acute myeloid leukemia. Oncotarget. 2017;8:3666–82. - PMC - PubMed
    1. Marcucci G, Radmacher MD, Maharry K, Mrozek K, Ruppert AS, Paschka P, et al. MicroRNA expression in cytogenetically normal acute myeloid leukemia. N Engl J Med. 2008;358:1919–28. - PubMed
    1. Wallace JA, O’Connell RM. MicroRNAs and acute myeloid leukemia: therapeutic implications and emerging concepts. Blood. 2017;130:1290–301. - PMC - PubMed

Publication types