Review
. 2021 Mar;5(3):203-218.
doi: 10.1038/s41551-020-00681-x. Epub 2021 Feb 15.

Harnessing non-destructive 3D pathology

Affiliations
Review

Harnessing non-destructive 3D pathology

Jonathan T C Liu et al. Nat Biomed Eng. 2021 Mar.

Abstract

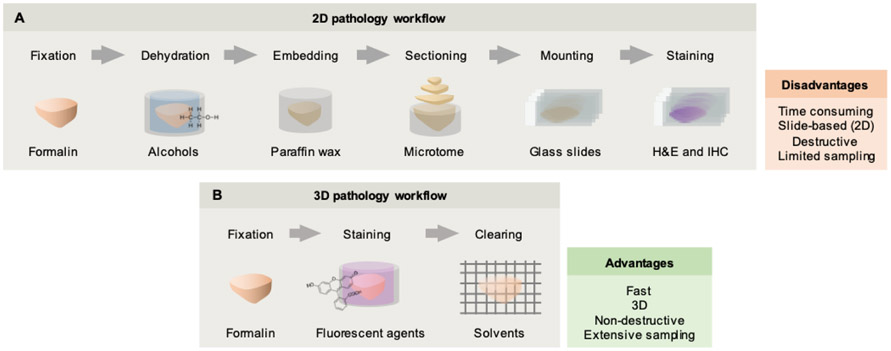
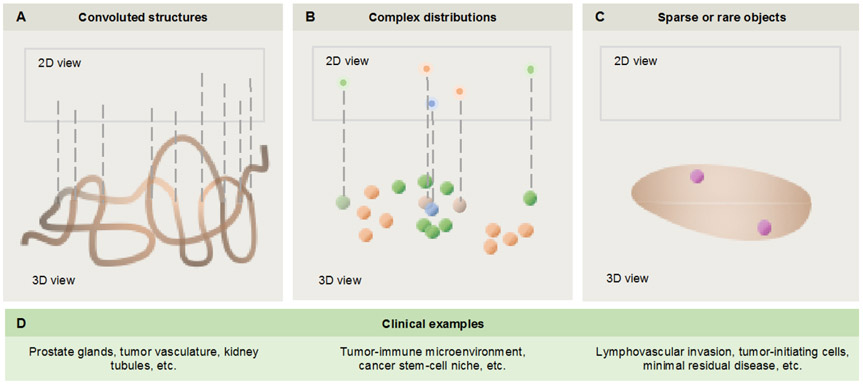
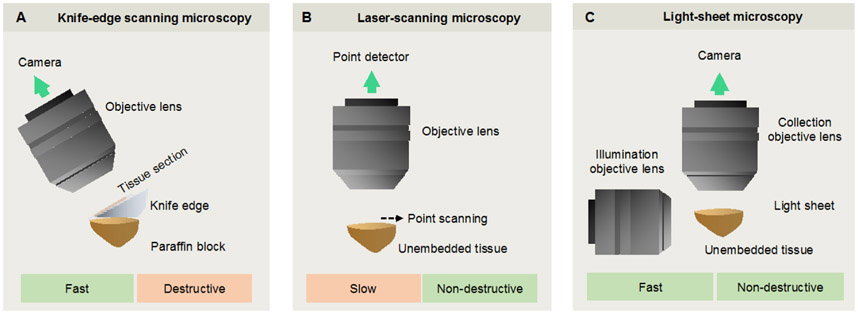
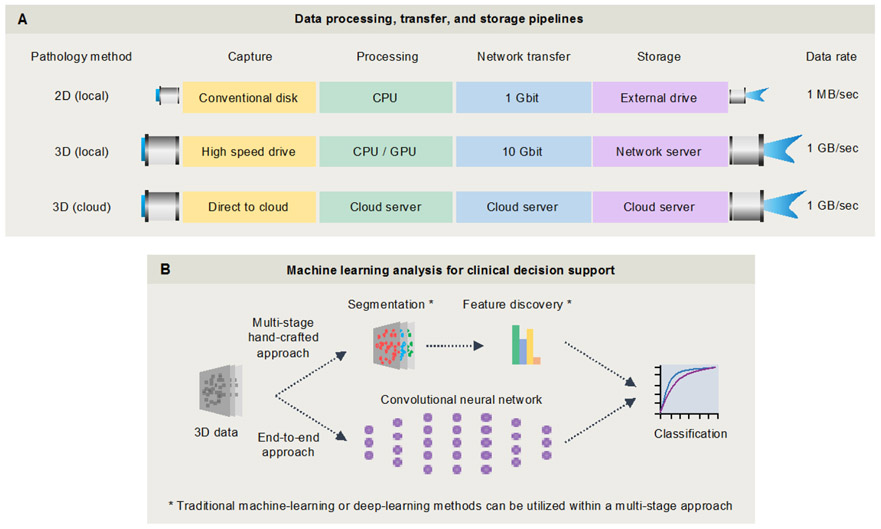
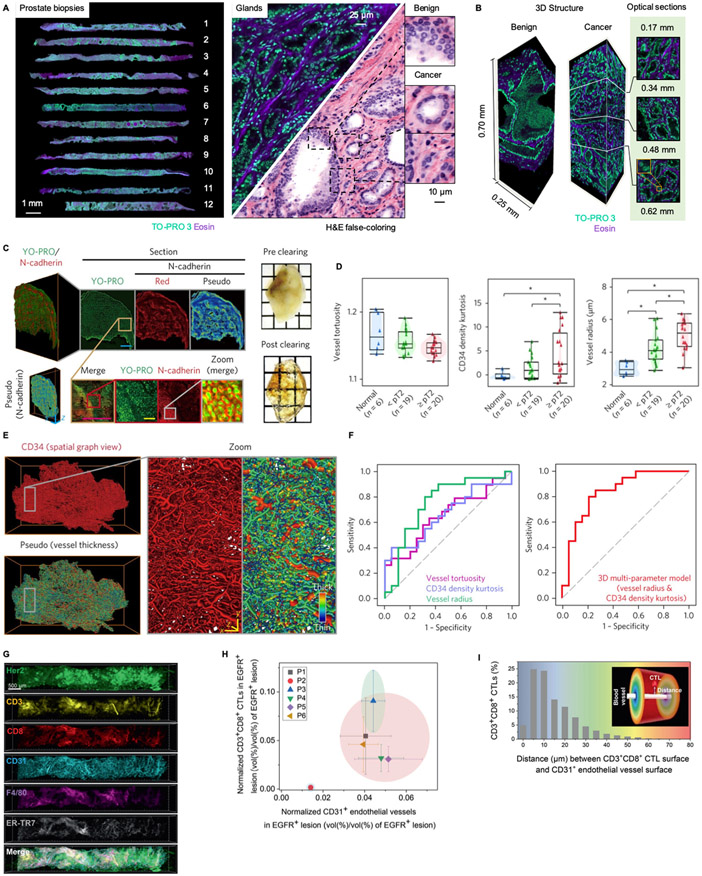
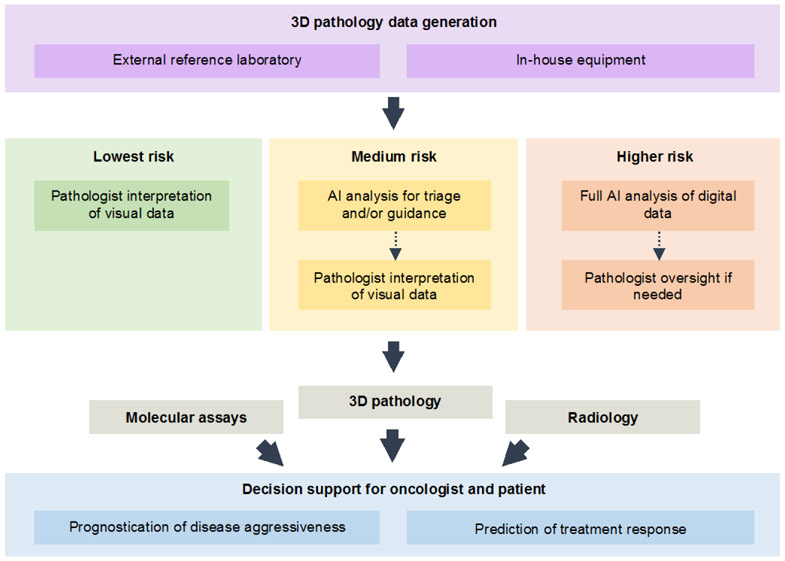
High-throughput methods for slide-free three-dimensional (3D) pathological analyses of whole biopsies and surgical specimens offer the promise of modernizing traditional histology workflows and delivering improvements in diagnostic performance. Advanced optical methods now enable the interrogation of orders of magnitude more tissue than previously possible, where volumetric imaging allows for enhanced quantitative analyses of cell distributions and tissue structures that are prognostic and predictive. Non-destructive imaging processes can simplify laboratory workflows, potentially reducing costs, and can ensure that samples are available for subsequent molecular assays. However, the large size of the feature-rich datasets that they generate poses challenges for data management and computer-aided analysis. In this Perspective, we provide an overview of the imaging technologies that enable 3D pathology, and the computational tools-machine learning, in particular-for image processing and interpretation. We also discuss the integration of various other diagnostic modalities with 3D pathology, along with the challenges and opportunities for clinical adoption and regulatory approval.


Figures

Figure 1.
Figure 1.. Conventional pathology vs. nondestructive 3D pathology.
(A) The conventional histology workflow was developed over a century ago and involves the use of harsh fixatives and dehydration reagents (e.g. xylene) followed by wax embedding, destructive sectioning, and staining of slide-mounted sections with chromogens such as H&E. In addition to being time consuming and destructive, only a small fraction of a clinical specimen is viewed in 2D. (B) Recent advances in optical clearing and fluorescence labeling, along with high-throughput volumetric microscopy, enable entire specimens (e.g. core-needle biopsies) to be imaged in 3D with minimal tissue processing or mounting requirements. This method provides rich 3D structural (and molecular) information of large intact specimens, and preserves valuable clinical specimens for downstream assays (e.g. DNA and RNA sequencing).
Figure 2.
Figure 2.. Examples in which 3D pathology could outperform 2D pathology.
(A) For convoluted 3D structures, 2D cross sectional views can be misleading. (B) For distributions of cells and other structures, 2D cross sectional views might preclude accurate quantification of complex spatial relationships. (C) Finally, for rare cells and microstructures, 2D sections might not provide adequate sampling to identify and quantify such targets. (D) Clinical examples are provided corresponding to the three categories above.
Figure 3.
Figure 3.. A comparison of selected imaging methods for 3D pathology.
(A) Knife-edge scanning microscopy (KESM) and micro-optical sectioning tomography (MOST) are destructive methods in which 2D images are acquired as a specimen is serially sectioned. These stacks of adjacent 2D images are used to reconstruct a 3D image of the specimen. (B) With confocal and multiphoton laser-scanning microscopy, a single point is typically imaged within a thick specimen, and is spatially scanned in three directions to nondestructively generate a 3D image over time. (C) With light-sheet microscopy, a 2D “optical section” within a transparent thick specimen is illuminated. Fluorescence generated within that light sheet is imaged in the orthogonal direction onto a sensitive high-speed camera. Scanning the 2D light sheet through the sample (or vice versa) allows for rapid generation of a 3D image in a plane-by-plane fashion.
Figure 4.
Figure 4.. Example data-processing and image-analysis workflows.
(A) In contrast to conventional microscopes, light-sheet microscopes acquire data at up to 1 GB/sec and require specialized hardware, such as a local 10 Gbit networked server, or a cloud-based storage and analysis solution. (B) Machine-learning tools will be necessary to assist with the analysis of large 3D pathology datasets for clinical decision support. Strategies include a multi-stage “hand-crafted-feature”-based approach, in which intuitive and well-understood microstructures are segmented and quantified as inputs for prognostic and predictive classifiers. Alternatively, an “end-to-end” approach can be used for direct classification based on raw 3D pathology images through a deep-learning model. Note that deep-learning techniques can also be utilized for certain steps within the multi-stage hand-crafted approach, for example to assist with segmentation tasks as described in section 3.2. These topics will be further examined in sections 3 and 4.
Figure 5.
Figure 5.. Examples of nondestructive 3D pathology of clinical specimens.
(A) 12 core-needle biopsies from the prostate of a single patient are imaged comprehensively in 3D with an open-top light-sheet (OTLS) microscopy system . A fluorescent analog of H&E staining is used to label the specimen, and is false-colored to mimic the appearance of standard H&E histology. (B) Benign and malignant glands are easily identified, with signification variations in appearance as a function of depth, which suggests that 3D pathology may improve diagnosis and grading of prostate carcinoma ,. (C) A bladder cancer specimen (FFPE) is deparaffinized, cleared, fluorescently labeled for nuclei and N-cadherin, and then imaged with light-sheet microscopy . Scale bars: 80 μm (yellow) and 1,600 μm (cyan). (D) A number of vascular features (tortuosity, kurtosis, and density) are plotted for 45 bladder specimens (human), showing significant differences between normal patients, those with non-muscle-invasive tumor (<pT2) and those with muscle-invasive tumor (>pT2). These quantitative vascular features were obtained after segmenting out the vessel network (E). Scale bars: 80 μm. (F) An ROC analysis was performed for the ability to detect muscle-invasive vs. noninvasive tumor, showing that 3D vascular features outperform 2D features, and that combining all 3D features yields the best performance. (G) Multiplexed 3D immunofluorescence imaging, with confocal microscopy, of intact core-needle biopsies of cancer . Scale bar at the top left: 500 μm. (H) Normalized densities of CD3+CD8+ cytotoxic lymphocytes (CTLs), and CD31+ microvasculature in EGFR+ parenchyma, are used to cluster human tumors into inflamed and noninflamed phenotypes. (I) 3D spatial distance mapping of an inflamed patient sample reveals that over 54% of CD3+CD8+ CTLs are located within 10 μm from microvessels.
Figure 6.
Figure 6.. Staged approach for translation of 3D pathology into clinical practice.
3D pathology datasets, generated by reference labs or in-house pathology labs, may initially provide additional visual information for pathologists as they seek to improve their diagnostic determinations. Early incorporation of AI analysis will likely be for triaging unequivocal cases, in order to reduce pathologist workloads, and to guide their efforts towards regions of ambiguity and/or diagnostic importance. As AI algorithms are increasingly validated and trusted by clinicians, they may eventually be utilized for fully automated analysis of 3D pathology datasets, with pathologist oversight if necessary. The vision for 3D pathology is to provide clinical decision support (prognostication and prediction) to guide treatment decisions, likely in conjunction with other molecular and imaging assays.

References

    1. Carroll PR, et al. NCCN Guidelines Insights: Prostate Cancer Early Detection, Version 2.2016. J Natl Compr Canc Netw 14, 509–519 (2016). - PMC - PubMed
    1. Gradishar WJ, et al. NCCN Guidelines Insights Breast Cancer, Version 1.2016. J Natl Compr Canc Netw 13, 1475–1485 (2015). - PubMed
    1. McKenney JK, et al. The potential impact of reproducibility of Gleason grading in men with early stage prostate cancer managed by active surveillance: a multi-institutional study. in J Urol, Vol. 186 465–469 (2011). - PubMed
    1. Shah RB, et al. Diagnosis of Gleason pattern 5 prostate adenocarcinoma on core needle biopsy: an interobserver reproducibility study among urologic pathologists. in Am J Surg Pathol, Vol. 39 1242–1249 (2015). - PubMed
    1. Zhou M, et al. Diagnosis of "Poorly Formed Glands" Gleason Pattern 4 Prostatic Adenocarcinoma on Needle Biopsy: An Interobserver Reproducibility Study Among Urologic Pathologists With Recommendations. in Am J Surg Pathol, Vol. 39 1331–1339 (2015). - PubMed

Publication types