. 2021 Mar;591(7851):645-651.
doi: 10.1038/s41586-020-03045-2. Epub 2021 Feb 15.

Metabolic support of tumour-infiltrating regulatory T cells by lactic acid

Affiliations

Metabolic support of tumour-infiltrating regulatory T cells by lactic acid

McLane J Watson et al. Nature. 2021 Mar.

Abstract

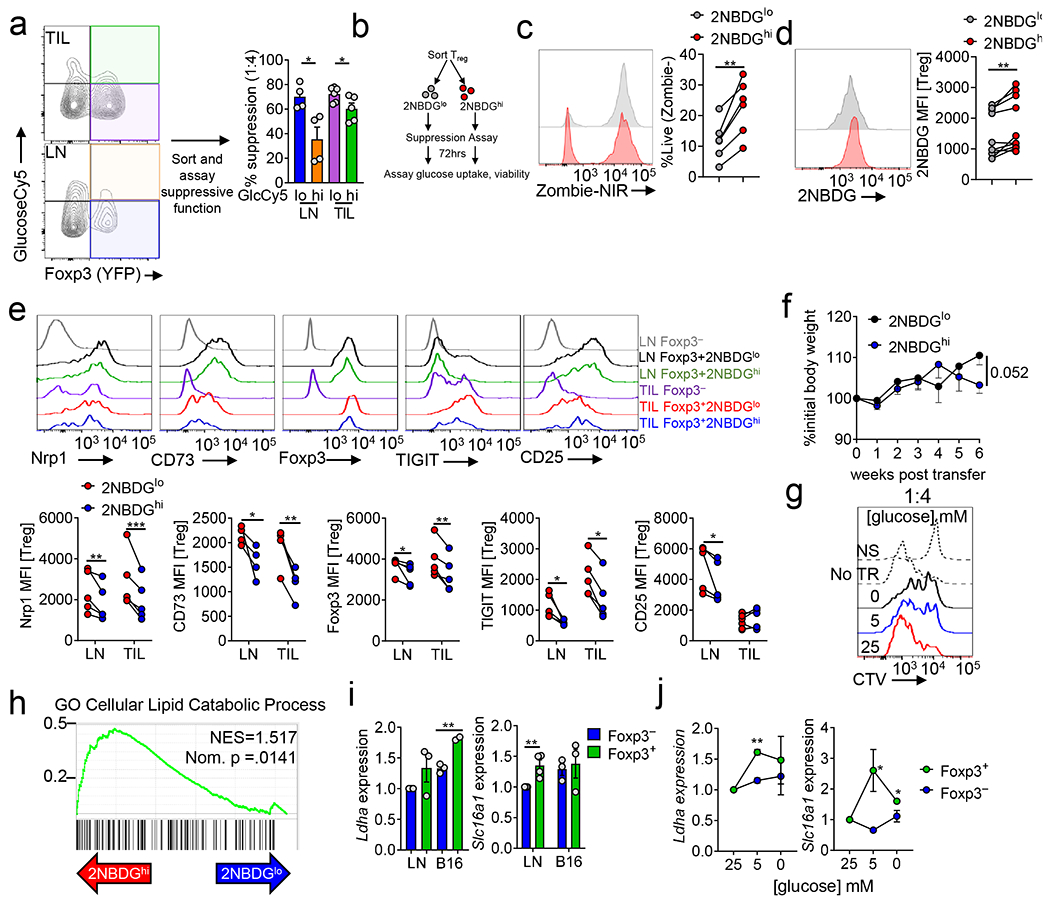
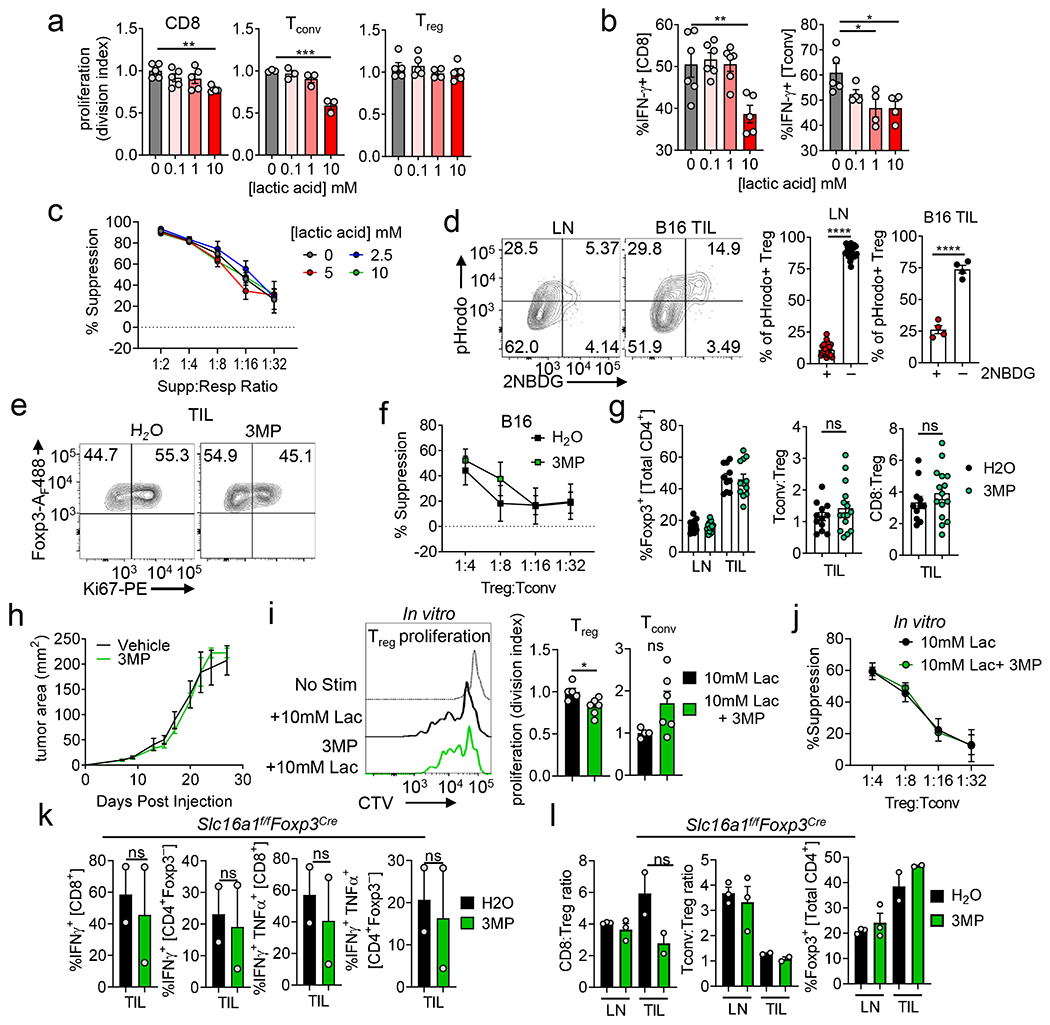
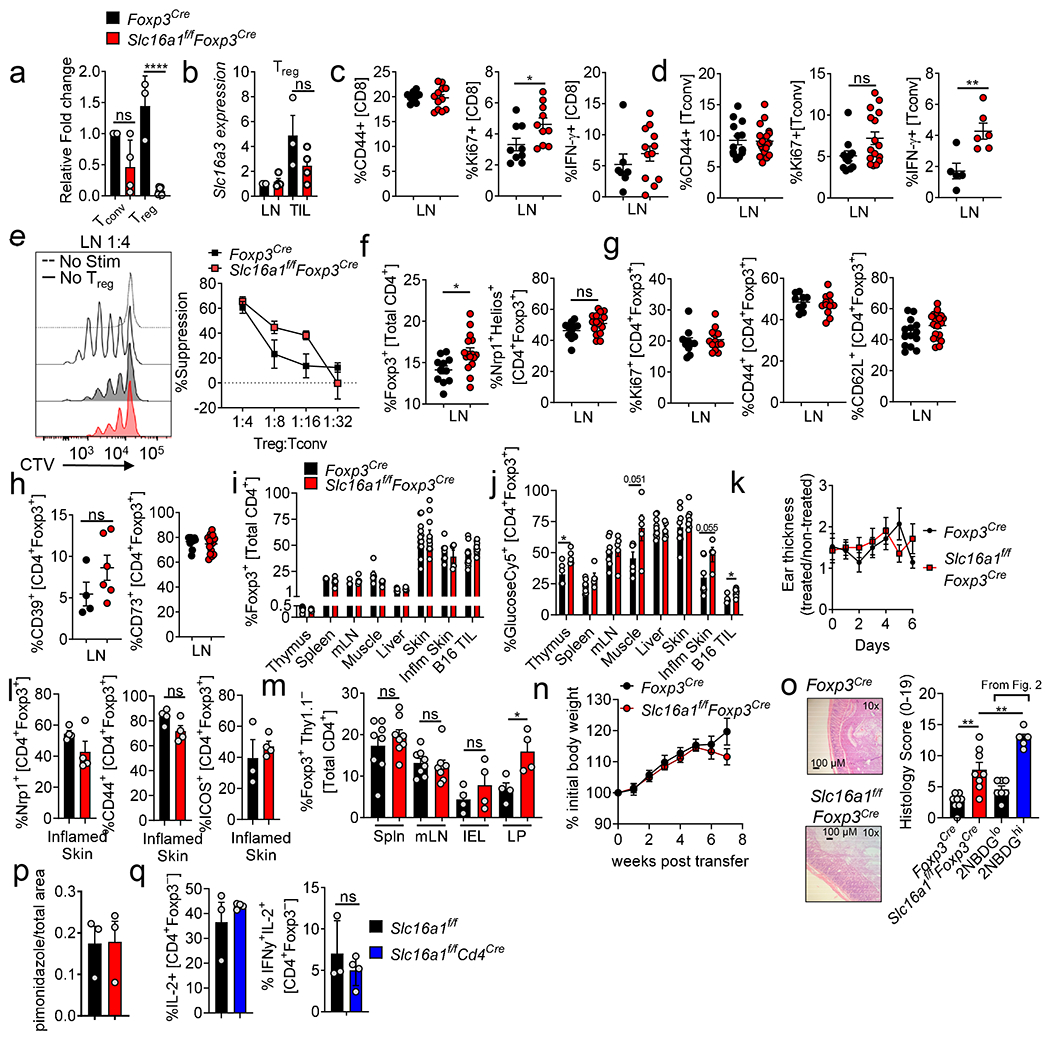
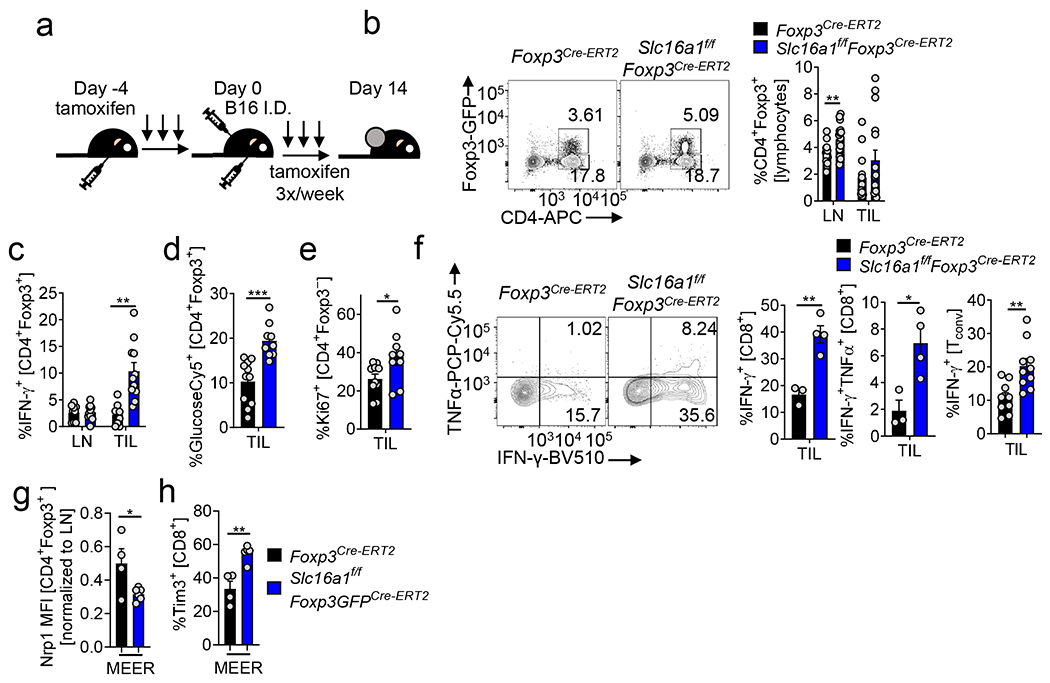
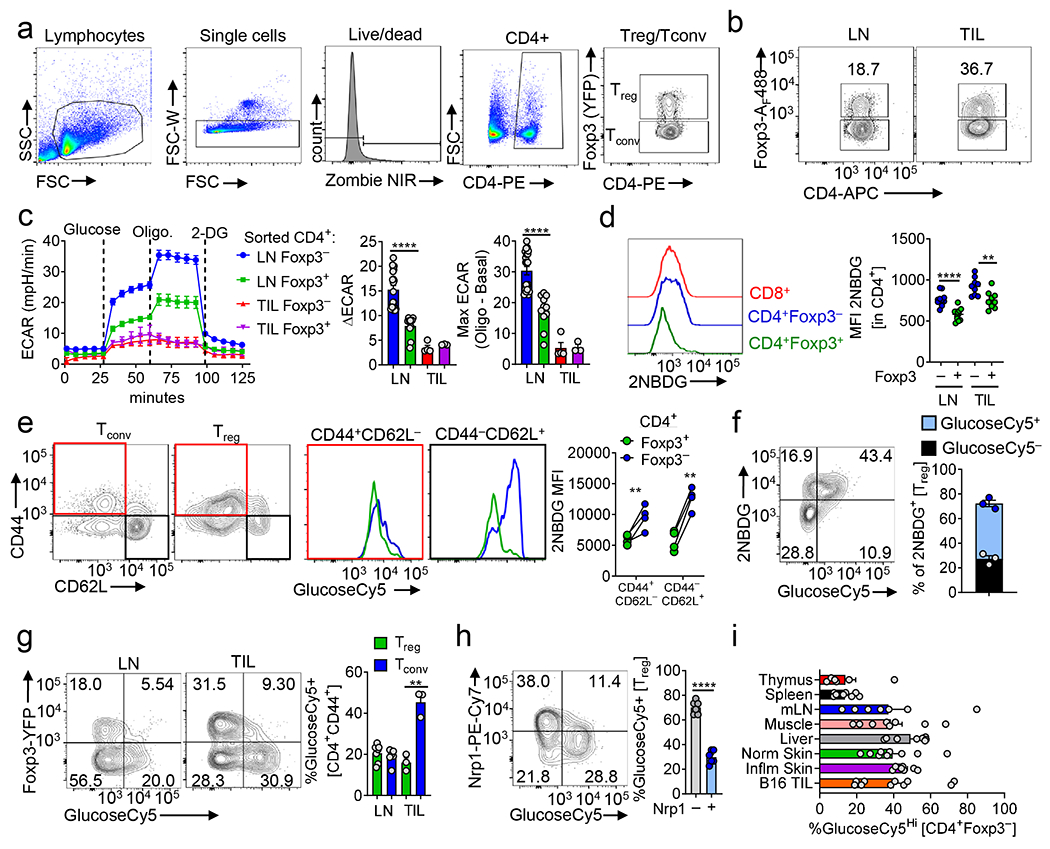
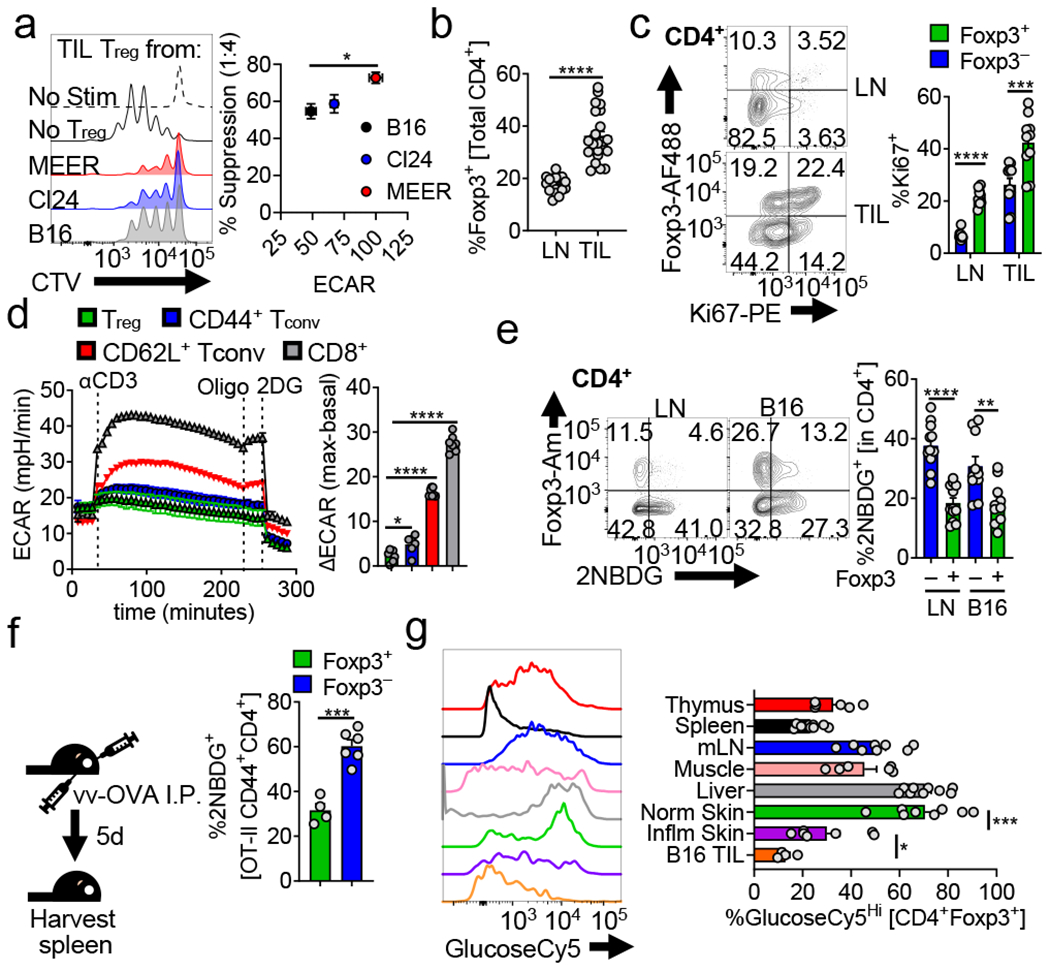
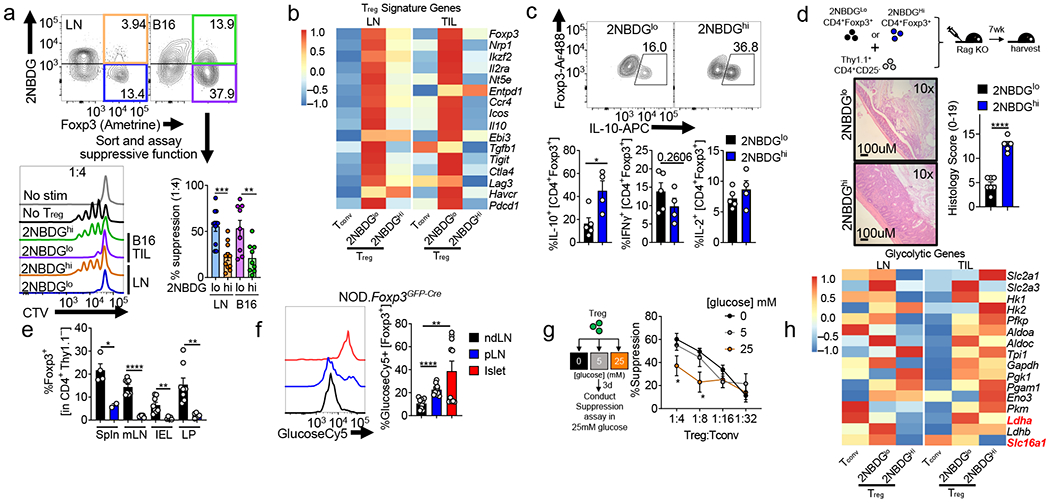
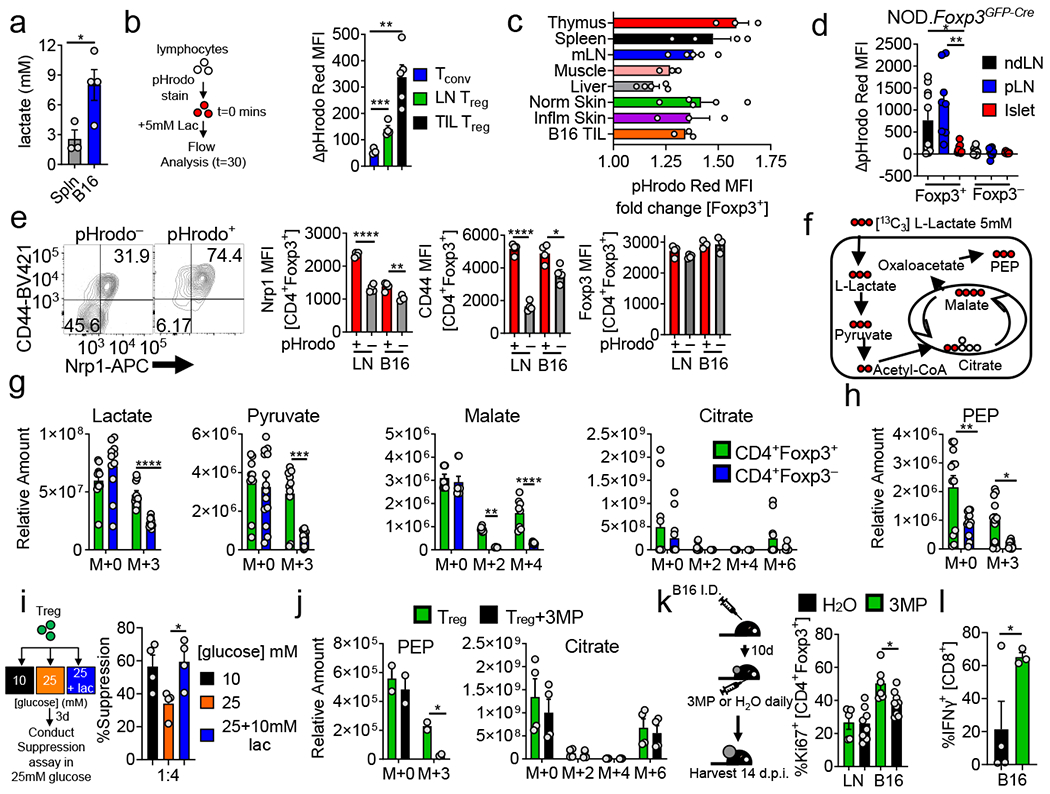
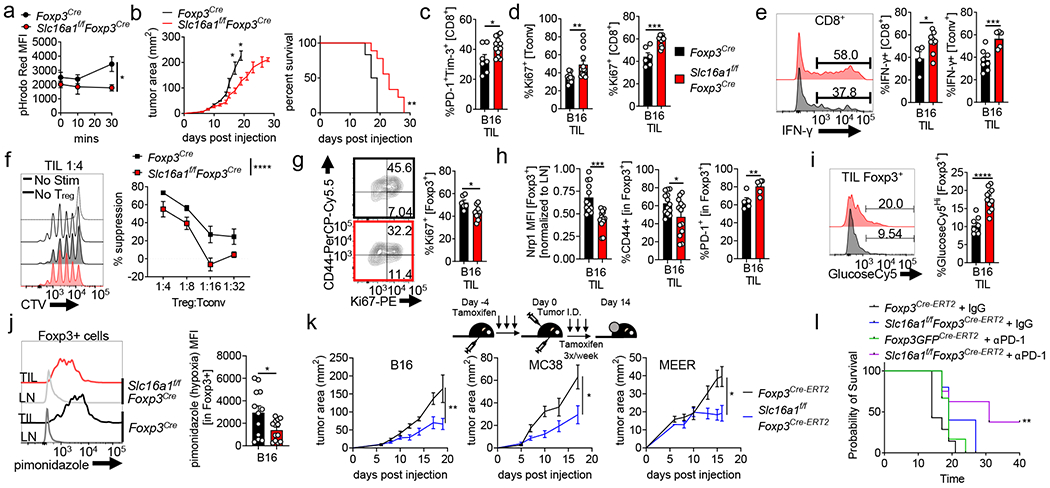
Regulatory T (Treg) cells, although vital for immune homeostasis, also represent a major barrier to anti-cancer immunity, as the tumour microenvironment (TME) promotes the recruitment, differentiation and activity of these cells1,2. Tumour cells show deregulated metabolism, leading to a metabolite-depleted, hypoxic and acidic TME3, which places infiltrating effector T cells in competition with the tumour for metabolites and impairs their function4-6. At the same time, Treg cells maintain a strong suppression of effector T cells within the TME7,8. As previous studies suggested that Treg cells possess a distinct metabolic profile from effector T cells9-11, we hypothesized that the altered metabolic landscape of the TME and increased activity of intratumoral Treg cells are linked. Here we show that Treg cells display broad heterogeneity in their metabolism of glucose within normal and transformed tissues, and can engage an alternative metabolic pathway to maintain suppressive function and proliferation. Glucose uptake correlates with poorer suppressive function and long-term instability, and high-glucose conditions impair the function and stability of Treg cells in vitro. Treg cells instead upregulate pathways involved in the metabolism of the glycolytic by-product lactic acid. Treg cells withstand high-lactate conditions, and treatment with lactate prevents the destabilizing effects of high-glucose conditions, generating intermediates necessary for proliferation. Deletion of MCT1-a lactate transporter-in Treg cells reveals that lactate uptake is dispensable for the function of peripheral Treg cells but required intratumorally, resulting in slowed tumour growth and an increased response to immunotherapy. Thus, Treg cells are metabolically flexible: they can use 'alternative' metabolites in the TME to maintain their suppressive identity. Further, our results suggest that tumours avoid destruction by not only depriving effector T cells of nutrients, but also metabolically supporting regulatory populations.


Conflict of interest statement

The authors declare no competing interests.

Figures

Extended Data Figure 1.
Extended Data Figure 1.. 1-amino-Cy5-glucose (GlucoseCy5) can act as a surrogate for 2NBDG in GFP/YFP Treg reporter mice.
(a) Gating strategy for Treg and Tconv cells (b) Representative plot of percent Treg (CD4+Foxp3+) in the lymph node (LN) and tumor (TIL) of B16 bearing C57BL/6 mice day 14 post tumor inoculation. Representative plots gated on total CD4+ cells. (c) Glycolytic extracellular acidification rates (ECAR) of Treg and Tconv cells sorted from LN and B16 TIL preparations as in (b) 48hrs after activation with αCD3/CD28 and IL-2. Oligo = oligomycin, 2-DG = 2-deoxy-D-glucose, ΔECAR = max reading after glucose minus basal ECAR. Max ECAR = max reading at after oligo minus basal ECAR. (d) Ex vivo 2NBDG uptake mean fluorescence intensity (MFI) by Treg, Tconv, and CD8+ T cells from the LN and B16 TIL (**p=0.0045). (e) Ex vivo 2NBDG uptake by CD44+CD62L and CD44CD62L+ Treg and Tconv cells isolated from the LN of Foxp3-Ametrine reporter mice. (f) Lymphocytes from Foxp3-Ametrine reporter mice were simultaneously pulsed with 2NBDG and GlucoseCy5. Representative plot is gated CD4+ Foxp3+ with tabulation of percent GlucoseCy5+ of 2NBDG+ Treg. (g) Ex vivo GlucoseCy5 uptake by CD44+ Treg and Tconv cells from the LN and B16 TIL. Representative plots gated on CD44+ CD4+ cells (**p=0.0025). (h) GlucoseCy5 positivity in Nrp1 negative and positive Treg cells. (i) Ex vivo GlucoseCy5 uptake by Tconv cells isolated from various tissues. Results are representative of three (a-d,f-i) or two (e) independent experiments. Significance (*p< 0.05, **p <0.01, ***p < 0.001, ****p<0.0001) was determined by paired two-tailed t test (e), unpaired two-tailed t test (d,f,g,h) or two-way ANOVA with Sidak's multiple comparisons test (c). Data are mean values of biological replicates ±SEM.
Extended Data Figure 2.
Extended Data Figure 2.. Glucose avid Treg cells harbor a weaker Treg cell signature but retain viability and some suppressor activity.
(a) Treg cells were sorted based on GlucoseCy5 uptake and assayed for their ability to suppress the proliferation of CellTrace Violet (CTV) labeled Tconv cells at 1:4 (Treg:Tconv) (LN*p=0.02, TIL *p=0.041). (b) Experimental diagram for (c, d). (c) Representative histogram and quantification of viability of sorted 2NBDGhi and 2NBDGlo Treg cells after 72hrs in a suppression assay. (d) 2NBDG uptake by 2NBDGhi or 2NBDGlo Treg as in (b). (e) Representative histograms and tabulation of Treg signature gene expression between 2NBDG low and high Treg cell subsets (Nrp1 **p=0.0016, CD73 *p=0.029 **p=0.0076, TIGIT LN*p=0.04 TIL*p=0.016, CD25 *p=0.037). (f) Weights of Rag1−/− mice that received an adoptive transfer of either 2NBDGlo or 2NBDGhi Treg cells plus Thy1.1+ Tconv cells I.V. (g) Representative histogram of Tconv responder cell proliferation after 72hrs of co-culture with Treg cells (1:4) conditioned in 0, 5, or 25mM glucose for 3 days. The suppression assay occurred in 25 mM glucose conditions. (h) Geneset enrichment plot of cellular lipid catabolic process from TIL 2NBDGhi vs 2NBDGlo Treg cells. (i) mRNA expression of Slc16a1 and Ldha in LN- and B16-infiltrating Treg and Tconv cells by qPCR (Ldha **p=0.004, Slc16a1 **p=0.009). (j) Slc16a1 and Ldha mRNA expression in Treg or Tconv cells activated overnight and conditioned in the glucose concentration indicated for 3 days (normalized to 25mM glucose, significance between Treg and Tconv) (Ldha **p=0.002 Slc16a1 5 *p=0.030, 0 *p=0.046). Results are representative of three (a,e,h,i,j), or two (c,d,f) independent experiments. Significance (*p< 0.05, **p <0.01, ***p < 0.001) determined by unpaired two-tailed t test (a,f,i,j) or paired two-tailed t test (c,d) or two-way ANOVA with Sidak’s multiple comparisons test (e). Data are mean values of biological replicates ±SEM.
Extended Data Figure 3.
Extended Data Figure 3.. Treg cells are resistant to lactic acid and use PEPCK-mediated metabolic pathways to support their proliferation.
(a) Proliferation of CD8+, Tconv, and Treg cells labeled with CellTrace Violet (CTV) activated in media with lactic acid for 3 days (**p=0.0058). (b) IFN-γ production of CD8 and Tconv cells conditioned as in (a) then restimulated overnight with PMA/ionomycin (CD8 **p=0.0042, Tconv *p=0.02). (c) Suppression assay using Treg cells conditioned as in (a) performed in absence of additional lactic acid. (d) Representative histogram and quantification of pHrodo+ Treg cells taking up 2NBDG. (e) Representative flow plot of Ki67 expression by B16-infiltrating Treg cells from mice treated ±3MP for 3 days. (f) Suppressive capacity of Treg cells, isolated from mice as in Fig.3k. (g) Percent Foxp3+ cells, Tconv:Treg ratio, and CD8:Treg ratio within the TIL of mice treated as in (f). (h) Tumor growth curve of B16 in C57BL/6 mice treated with H2O or 3MP. (i) Proliferation of Treg and Tconv cells activated and cultured in 10mM lactic acid media ±3MP for 3 days (*p=0.016). (j) Capacity of activated Treg cells conditioned in 10mM lactic acid media ± 250μM 3MP for 3 days to suppress the proliferation of CTV labelled Tconv cells. (k) IFN-γ expression by CD8 and Tconv cells in Foxp3Cre or Slc16a1f/fFoxp3Cre mice treated as in (f). (l) Percent Foxp3+ cells, Tconv to Treg ratio, and CD8 to Treg ratio within LN and tumor of Slc16a1f/fFoxp3Cre mice treated as in (f). Results are representative of four (d), three (a,b,c,f,g,i), or two (h,j,k,l) independent experiments. Significance (*p< 0.05, **p <0.01, ***p < 0.001, ****p<0.0001) determined by unpaired two-tailed t test (d,e,g,i,k,l) or one-way ANOVA with Dunnett’s multiple comparisons test (a,b) or two-way ANOVA with Sidak's multiple comparisons test (c,f,h,j). Data are mean values of biological replicates ±SEM.
Extended Data Figure 4.
Extended Data Figure 4.. MCT1 is efficiently deleted in Treg cells of Slc16a1f/fFoxp3YFP-Cre mice and is not required for peripheral Treg cell function.
(a) Slc16a1 expression in Tconv and Treg cells from the lymph nodes (LN) of Foxp3Cre or Slc16a1f/fFoxp3Cre mice. (b) Treg cell mRNA expression of Slc16a3 (MCT4) from mice as in (a). CD44, Ki67, and IFN-γ production by LN CD8+ T cells (c, *p=0.039) or Tconv cells (d, **p=0.007) from mice as in (a). (e) Capacity of LN-derived Treg cells as in (a) to suppress proliferation of CellTrace Violet (CTV) labelled Tconv cells. (f) Percent Foxp3+ and Nrp1+Helios+ LN Treg cells from mice as in (a) (*p=0.013). (g) CD44, Ki67, and CD62L expression by LN Treg cells as in (a). (h) CD39 and CD73 expression by LN Treg cells as in (a). Percent of Foxp3+ cells (i) or GlucoseCy5+ Treg cells (j) from various tissues of mice as in (a) (thymus *p=0.014, B16 *p=0.019). (k) Normalized ear thickness of imiquimod treated mice as in (a). (l) Percent marker positive Treg cells from mice treated as in (k). (m) Foxp3 expression in transferred wild type or Slc16a1-deficient Treg infused with Thy1.1+ Tconv cells into Rag1−/− mice iv. (*p=0.02) (n) Weight of Rag1−/− mice over time from (m). (o) Representative sections of the colon and quantified histology scores 7 weeks post transfer from mice as in (m) and Fig.2d (**p=0.001, **p=0.009). (p) Anti-pimonidazole area over tumor area (B16) calculated from immunofluorescence from Foxp3Cre and Slc16a1f/fFoxp3Cre mice. (q) IL-2 and IFN-γ expression by Slc16a1-deficient Tconv cells stimulated overnight with PMA/ionomycin. Results are representative of four (c,d,f,g), three (a,b,e,h,j,p,q), or two (k,l,m,i,o) independent experiments. Significance (*p< 0.05, **p <0.01, ****p < 0.0001) determined by unpaired two-tailed t test (a-d,f-q) or two-way ANOVA (e). Data presented as mean values of biological replicates ±SEM.
Extended Data Figure 5.
Extended Data Figure 5.. Acute deletion of MCT1 results in similar immunologic phenotypes in B16 melanoma and predilection towards a fragile Treg cell phenotype.
(a) Foxp3Cre-ERT2 and Slc16a1f/fFoxp3Cre-ERT2 mice were treated 5 consecutive days with tamoxifen I.P. prior to inoculation with 1.5 x 10⁵ B16 tumor cells. Following inoculation, tamoxifen was administered I.P. 3 times a week until sacrifice at day 14. (b) Percent Foxp3+ CD4+ cells in the lymph node (LN) and tumor (TIL) as in (a) (**p=0.005). (c) Tabulation of IFN-γ production by Treg cells from the LN and TIL of mice as in (a) (**p=0.002). (d) Glucose consumption by Treg cells from the TIL of mice as in (a). (e) Percent proliferating Tconv cells from the TIL of mice as in (a) (*p=0.037). (f) Representative flow plot and tabulation of IFN-γ and TNFα production by CD8 T cells from the TIL of mice as in (a) (**p=0.003, *p=0.02). Tabulation of IFN-γ production by Tconv cells from the TIL of mice as in (a) (**p=0.003). (g) Nrp1 mean fluorescence intensity on MEER intratumoral Treg cells derived from Foxp3Cre-ERT2 and Slc16a1f/fFoxp3Cre-ERT2 mice treated as in (a) (*p=0.034). (h) Tim-3 expression by MEER derived CD8 T cells from mice as in (g) (**p=0.003). Results are representative of four (b,c,d,e), or three (f), or two (g,h) independent experiments. Significance (*p< 0.05, **p <0.01) determined by unpaired two-tailed t test (b-h). Data presented as mean values of biological replicates ±SEM.
Figure 1.
Figure 1.. Regulatory T cells possess a distinct metabolic profile from conventional T cells in normal and transformed tissues.
(a) (left) Representative histogram of Tconv responder cell proliferation dye dilution after 72hrs of co-culture with Treg cells isolated from B16, Cl24 (melanoma), or MEER (HPV+ HNSCC) tumors. (right) Capacity of Treg cells to suppress the proliferation of CellTrace Violet (CTV) labelled Tconv cells as a function of the glycolytic extracellular acidification rate (ECAR) of the tumors from which they were isolated (*p=0.047). (b) Percent Treg cells (CD4+ Foxp3+) of total CD4+ T cells from lymph node (LN) and tumor infiltrating lymphocyte (TIL) preparations from C57BL/6 mice bearing B16 melanoma tumors (14 d post intradermal injection) (c) Percent proliferating (Ki67+) Treg and Tconv cells (CD4+ Foxp3-) from mice as in (b). (d) ECAR of in-Seahorse activated Treg, CD8+, CD44+CD62L− and CD44-CD62L+ Tconv cells sorted from LN and spleen of Foxp3 reporter mice. Oligo = oligomycin, 2-DG = 2-deoxy-D-glucose, ΔECAR = max reading after αCD3 minus basal ECAR. (*p=0.022) (e) Flow cytogram depicting ex vivo 2NBDG uptake by Treg and Tconv cells from the LN and B16 TIL of Foxp3 reporter mice. Representative plots gated on CD4+ cells. (**p=0.006) (f) Diagram of experimental procedure and quantification of ex vivo 2NBDG uptake by CD44+ OT-II Treg and Tconv cells isolated 5 days after transfer into congenically mismatched hosts infection with Vaccinia-OVA. (g) Representative histogram and quantification of ex vivo GlucoseCy5 uptake by Treg cells isolated from various tissues (*p=0.047). Results are representative of five (b), three (a,c,e, and g) or two (d,f) independent experiments. (*p< 0.05, **p <0.01, ***p < 0.001 ****p<0.0001) by unpaired two-tailed t test (a,b,d,f,g) or two-way ANOVA with Sidak’s multiple comparisons test (c,e). Data are mean values of biological replicates ±SEM.
Figure 2.
Figure 2.. Glucose avidity is associated with reduced Treg cell functional identity.
(a) Flow cytogram of CD4+ T cells from B16-bearing Foxp3Ametrine mice depicting sorting strategies for Treg cells based on their glucose uptake. Treg cells sorted based on 2NBDG uptake were assayed for their ability to suppress the proliferation of CellTrace Violet (CTV) labeled Tconv cells. Representative histogram shows 1:4 ratio of Treg:Tconv. (**p=0.0056). (b) Treg cell signature gene expression in RNAseq analysis of 2NBDGhi or 2NBDGlo Treg cells sorted from lymph node (LN) or tumor (TIL) of B16 melanoma-bearing Foxp3 reporter mice as in (a). (c) Production of IL-10, IFN-γ, and IL-2 by sorted 2NBDGlo and 2NBDGhi Treg cells stimulated overnight with PMA/ionomycin and stained intracellularly (*p=0.02). (d) Diagram and colon histology Rag1−/− mice that received either 2NBDGlo or 2NBDGhi Thy1.2+ Treg cells plus Thy1.1+ Tconv cells I.V and followed for 7 wks. (e) Percent of transferred 2NBDGlo or 2NBDGhi Treg cells as in (d) expressing Foxp3 within the spleen (Spln), mesenteric lymph node (mLN), intraepithelial layer (IEL), and lamina propria (LP) (*p=0.02, **p=0.004). (f) Representative histogram and tabulation of GlucoseCy5 uptake by Treg cells isolated from the non-draining lymph node (ndLN), pancreatic lymph node (pLN), and the islet of 10-12-week-old NOD.Foxp3GFP-Cre mice (**p=0.005). (g) (left) Diagram of experimental procedure and (right) capacity of Treg cells conditioned in 0,5, or 25mM glucose media to suppress the proliferation of CellTrace Violet (CTV) labelled Tconv cells. (1:4 *p=0.031, 1:8 *p=0.012 between 0 and 25 mM). (h) Glycolytic pathway gene expression as in (b). Results are representative of three (a,b,c,g,h), or two (d,e,f) independent experiments. Significance (*p< 0.05, **p <0.01, ***p < 0.001, ****p<0.0001) was determined by unpaired two-tailed t test (a,c,d,e,f), or two-way ANOVA with Tukey’s multiple comparison test (g). Data are mean values of biological replicates ±SEM.
Figure 3.
Figure 3.. Treg cells metabolize lactic acid to support their proliferation and suppressor function.
(a) Lactate concentration in spleen or B16 melanoma interstitial fluid (*p=0.041). (b) Lymphocytes from Foxp3Cre mice were loaded with pHrodo Red (intracellular pH dye) and pulsed with 5mM lactic acid. Results are change of MFI from t=0 (**p=0.0012). (c) Lactic acid uptake determined as in (b) by Treg cells infiltrating various tissues. (d) Lactic acid uptake from Treg and Tconv cells isolated from islets, non-draining (ndLN), and pancreatic lymph node (pLN) of 10-12-week-old NOD.Foxp3GFP-Cre mice (*p=0.017, **p=0.001). (e) Flow cytogram and tabulation depicting Nrp1 and CD44 expression in Treg cells based on lactate-elicited pH change (*p=0.018, **p=0.0097). (f) Diagram showing incorporation of 13C derived from lactate into downstream metabolites. (g) Relative abundance determined by mass spectrometry of intracellular lactate, pyruvate, malate, and citrate in Treg and Tconv cells activated overnight then pulsed with uniformly labeled 13C-lactate (m+n equal to the number of incorporated heavy carbons) (**p=0.0025). (h) Relative abundance of PEP derived from 13C-lactate as in (g) (*p=0.036, **p=0.0011). (i) Capacity of Treg cells conditioned for 3 days in 25mM glucose media ±10mM lactic acid to suppress the proliferation of CellTrace Violet (CTV) labelled Tconv cells (*p=0.021). (j) As in (h) with the addition of PEPCK inhibitor 3MP (*p=0.018). (k) Ki67 expression in intratumoral Treg cells of B16 tumor-bearing mice treated with 3MP or water for 3 days (*p=0.015). (l) IFN-γ expression by B16-infiltrating CD8+ T cells from mice treated as in (k) for 5 days. Results are representative of three (a,c,e,g,h,k), or two (b,d,i,j,l) independent experiments. Significance (*p< 0.05, **p <0.01, ***p < 0.001, ****p<0.0001) determined by unpaired two-tailed t test (a,b,d,e,i,j,k,l) or unpaired one-tail t test (l) or two-way ANOVA with Sidak's multiple comparisons test (g,h). Data are mean values of biological replicates ±SEM.
Figure 4.
Figure 4.. Tumor-infiltrating Treg cells require lactate uptake to maintain their high suppressive function.
(a) Lactate-elicited pHrodo fluorescence in Foxp3Cre or Slc16a1f/fFoxp3Cre Treg cells (*p=0.041). (b) B16 tumor growth and survival of Foxp3Cre and Slc16a1f/fFoxp3Cre mice (*p=0.0235) (c) Percent of B16-infiltrating PD-1+Tim-3+ CD8+ T cells day 14 post tumor injection in mice as in (a) (*p=0.017). (d) Proliferation of tumor infiltrating Tconv and CD8+ T cells as in (c) (**p=0.009). (e) Tumor-infiltrating CD8+ and Tconv cells restimulated with PMA/ionomycin and stained for IFN-γ (*p=0.039). (f) Capacity of WT or Slc16a1-deficient tumor-infiltrating Treg cells to suppress proliferation of CTV labeled Tconv cells. (g) Percent proliferating tumor infiltrating Treg cells from mice as in (c). (*p=0.011). (h) Percent or MFI of WT and Slc16a1-deficient Treg cells expressing Nrp1, PD-1, CD44 from B16 tumors (TIL) as in (c) (*p=0.029, **p=0.009). (i) GlucoseCy5 uptake by B16 tumor-infiltrating Treg cells as in (c) (j) Pimonidazole staining of WT and Slc16a1-deficient Treg cells from B16 tumors as in (c) (*p=0.029). (k) Tumor growth of B16 (melanoma, **p=0.0011) MC38 (adenocarcinoma, *p=0.023), and MEER (HNSCC, *p=0.0146) in tamoxifen treated Foxp3Cre-ERT2 and Slc16a1f/fFoxp3Cre-ERT2 mice. Mice were given tamoxifen 5 consecutive days prior to tumor injection then 3x per week. (l) Survival of tamoxifen treated Foxp3Cre-ERT2 and Slc16a1f/fFoxp3Cre-ERT2 mice injected with B16 and treated with IgG or anti-PD-1 antibodies 3x weekly (**p=0.002). Results are representative of four (b,c,d,f,g,h(Nrp1, CD44),i,j), three (a, k(B16)), or two (h(PD-1), k(MC38, MEER),l) independent experiments. Significance (*p< 0.05, **p <0.01, ***p < 0.001, ****p<0.0001) determined by the log-rank test for survival curves (b,l) or unpaired two-tailed t test (a,c,d,e,g,h,i,j) or two-way ANOVA (b,f,k). Data are mean values of biological replicates ±SEM.

Comment in

References

    1. Wang H, Franco F & Ho P-C Metabolic regulation of tregs in cancer: opportunities for immunotherapy. Trends Cancer 3, 583–592 (2017). - PubMed
    1. Sakaguchi S, Yamaguchi T, Nomura T & Ono M Regulatory T cells and immune tolerance. Cell 133, 775–787 (2008). - PubMed
    1. Hanahan D & Weinberg RA Hallmarks of cancer: the next generation. Cell 144, 646–674 (2011). - PubMed
    1. Scharping NE et al. The tumor microenvironment represses T cell mitochondrial biogenesis to drive intratumoral T cell metabolic insufficiency and dysfunction. Immunity 45, 374–388 (2016). - PMC - PubMed
    1. Najjar YG et al. Tumor cell oxidative metabolism as a barrier to PD-1 blockade immunotherapy in melanoma. JCI Insight 4, (2019). - PMC - PubMed

Publication types