. 2021 Mar;27(3):454-462.
doi: 10.1038/s41591-021-01263-3. Epub 2021 Feb 12.

Humoral signatures of protective and pathological SARS-CoV-2 infection in children

Affiliations

Humoral signatures of protective and pathological SARS-CoV-2 infection in children

Yannic C Bartsch et al. Nat Med. 2021 Mar.

Abstract

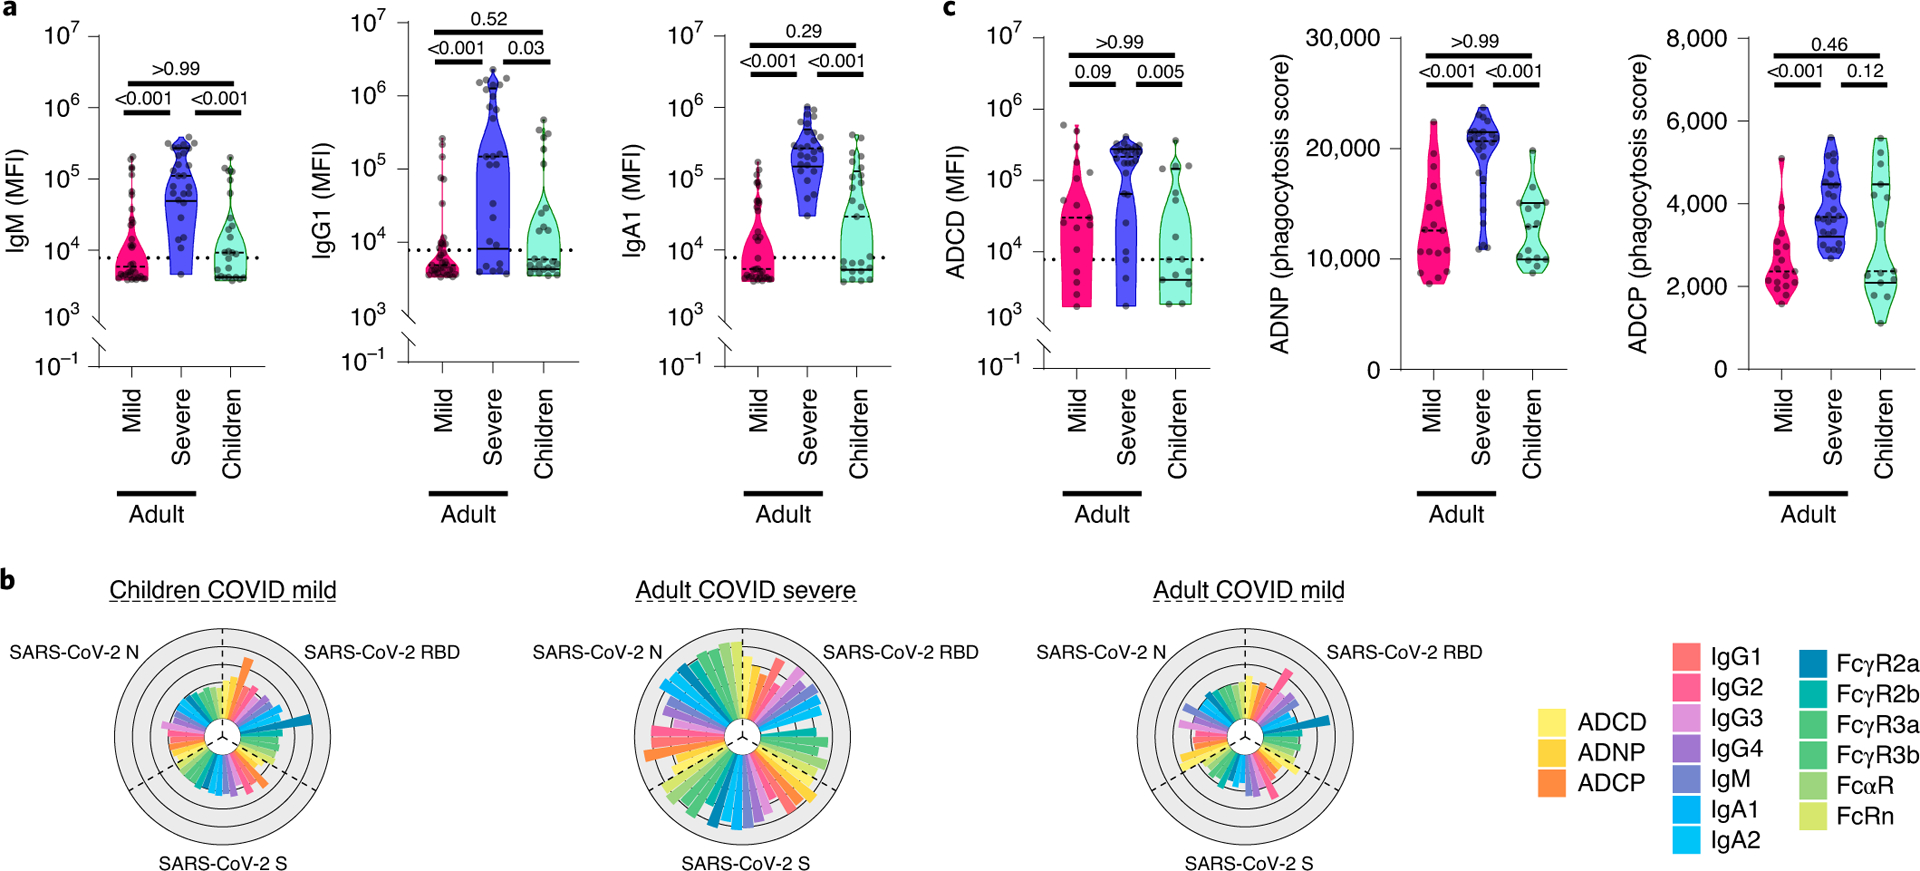
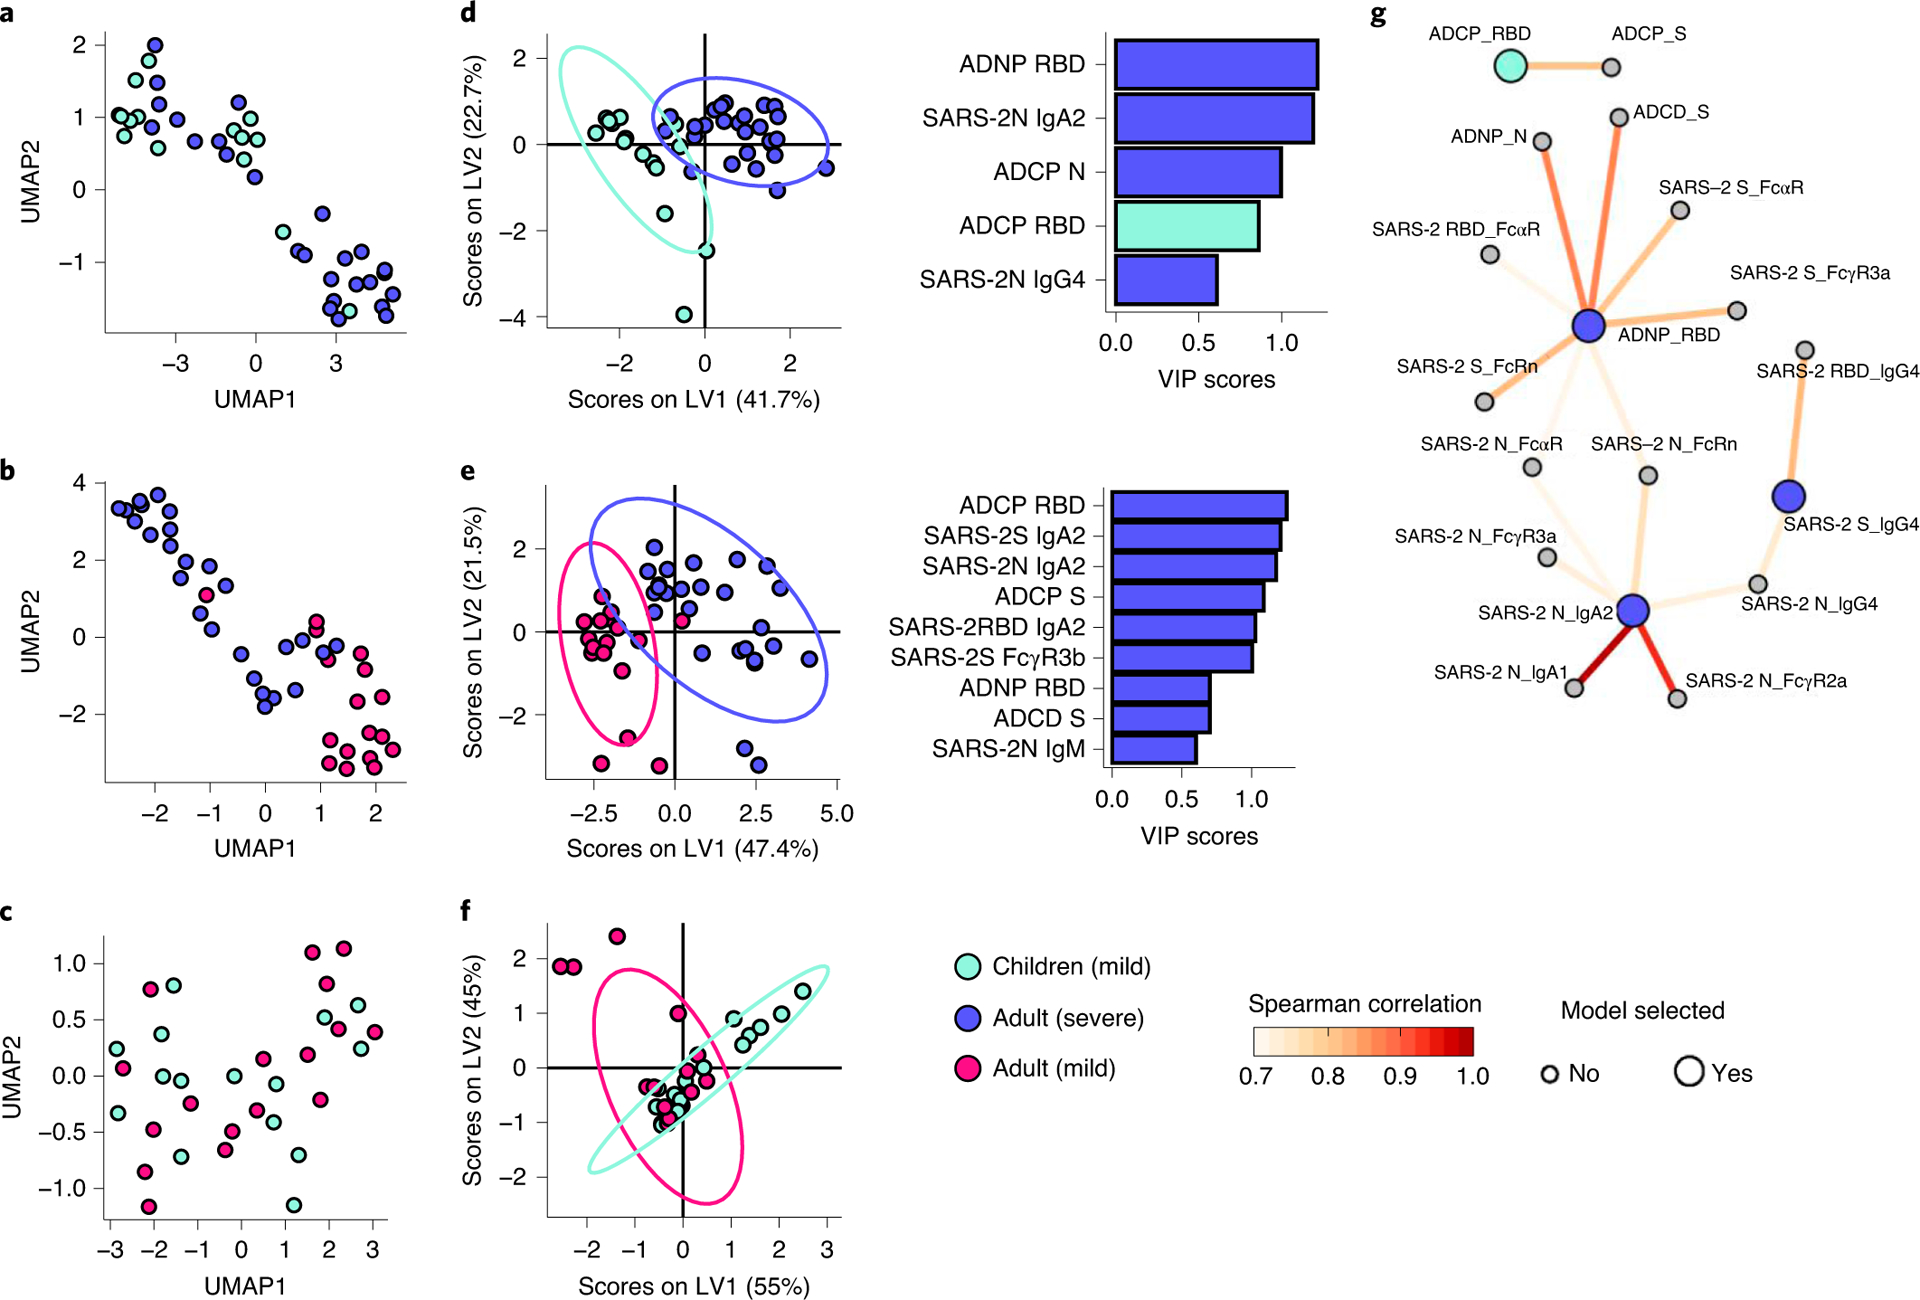
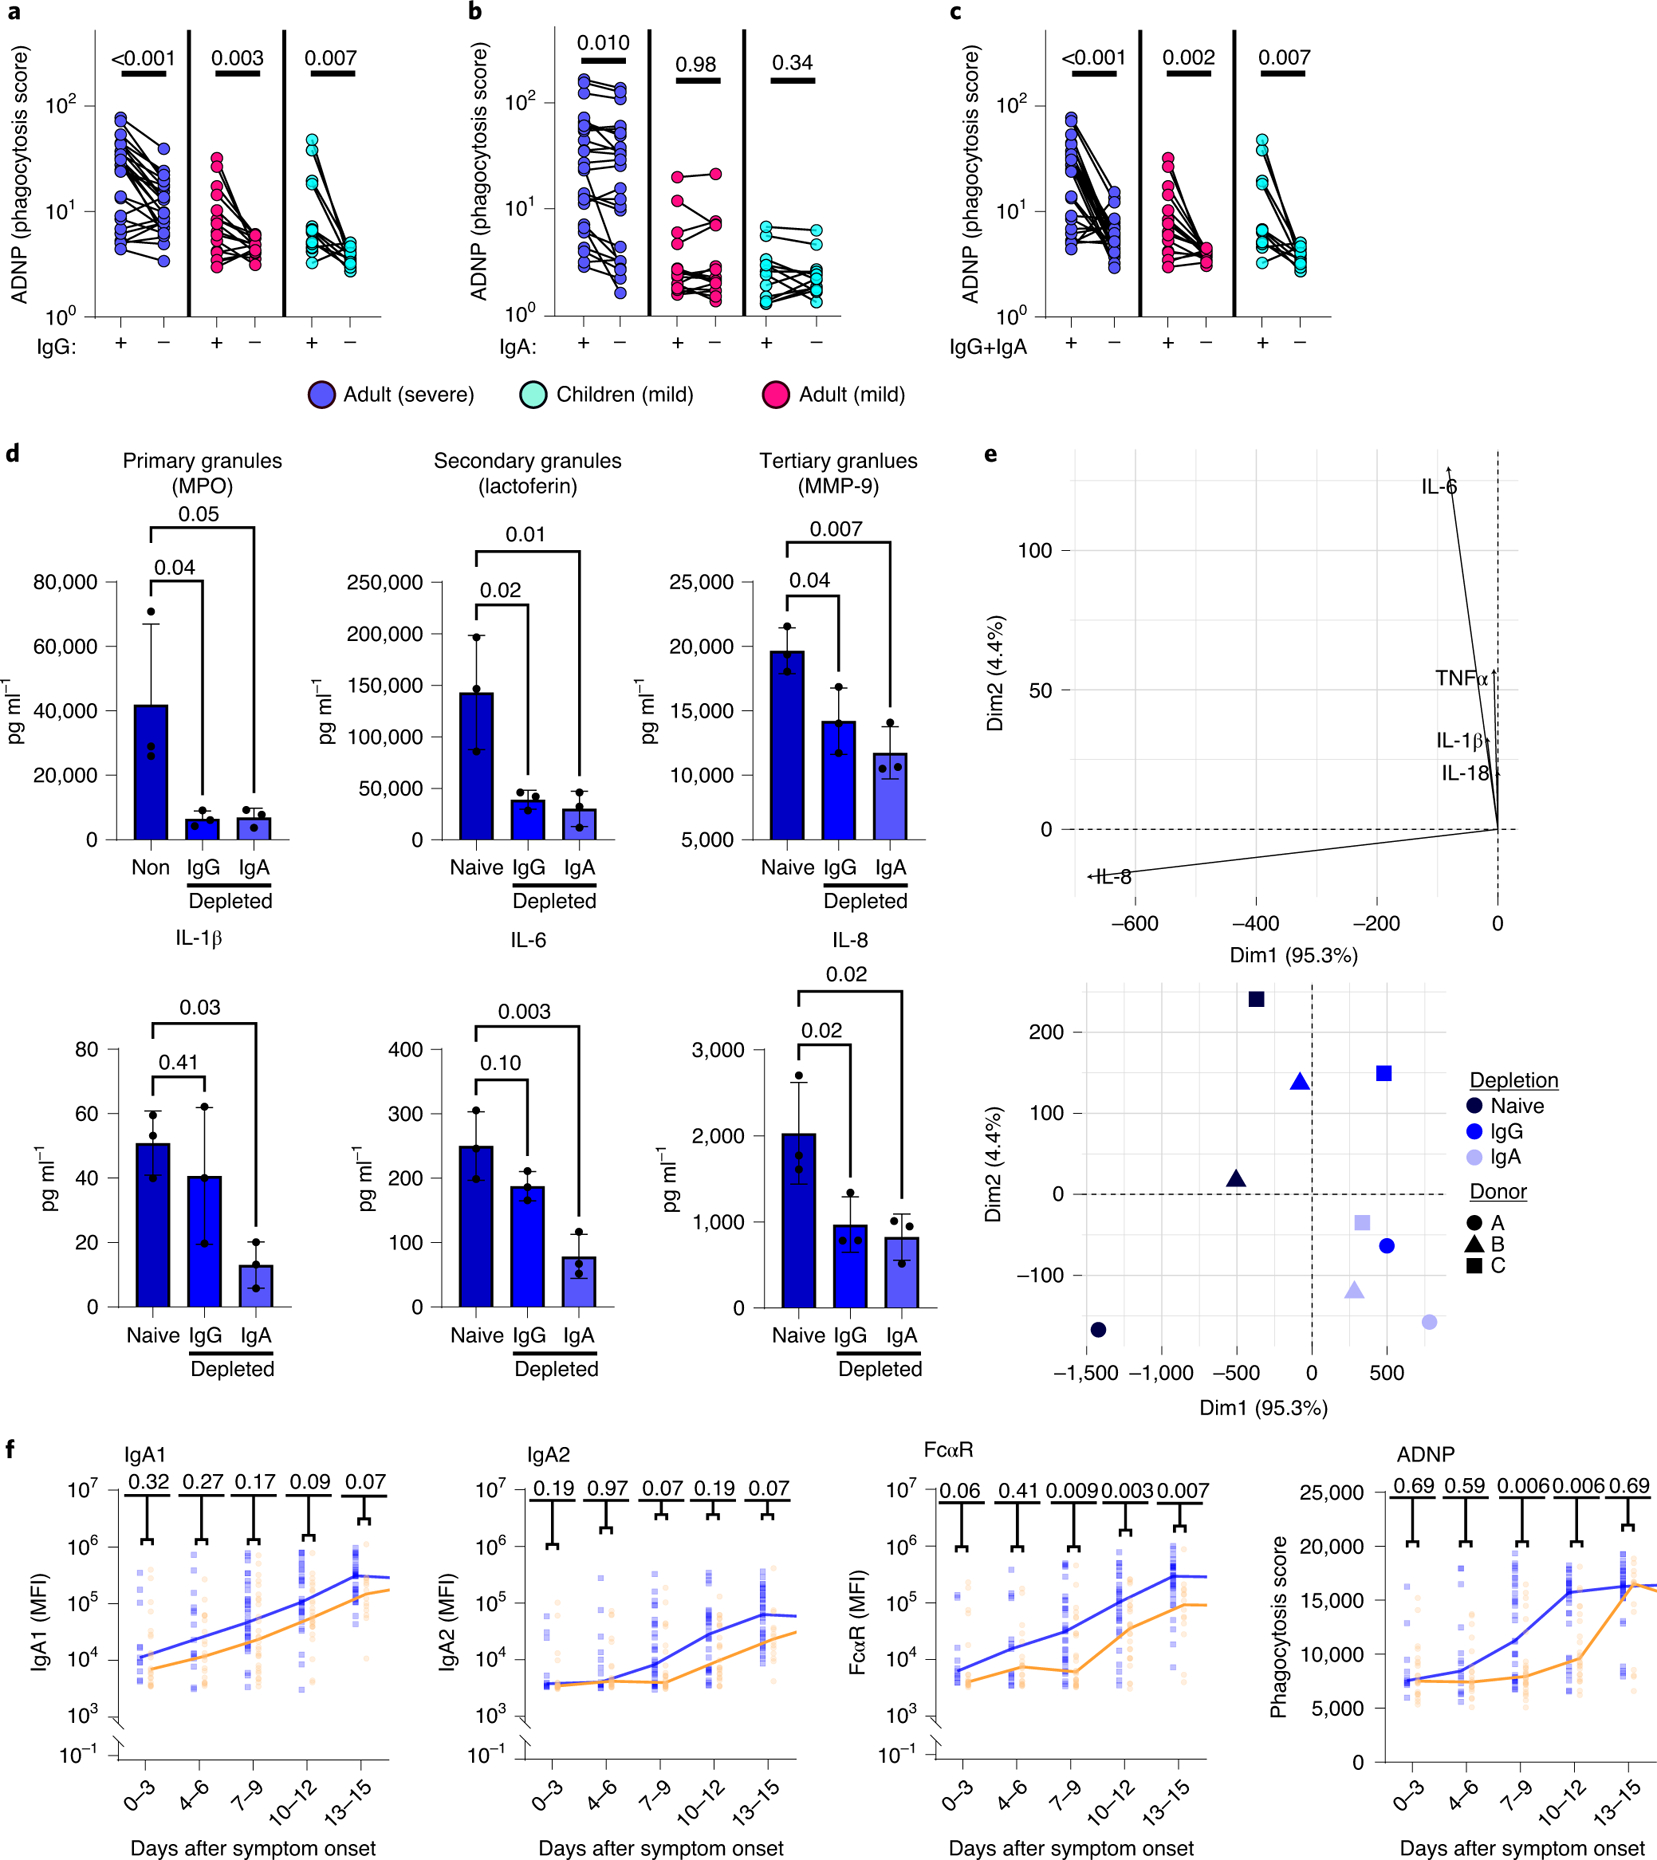
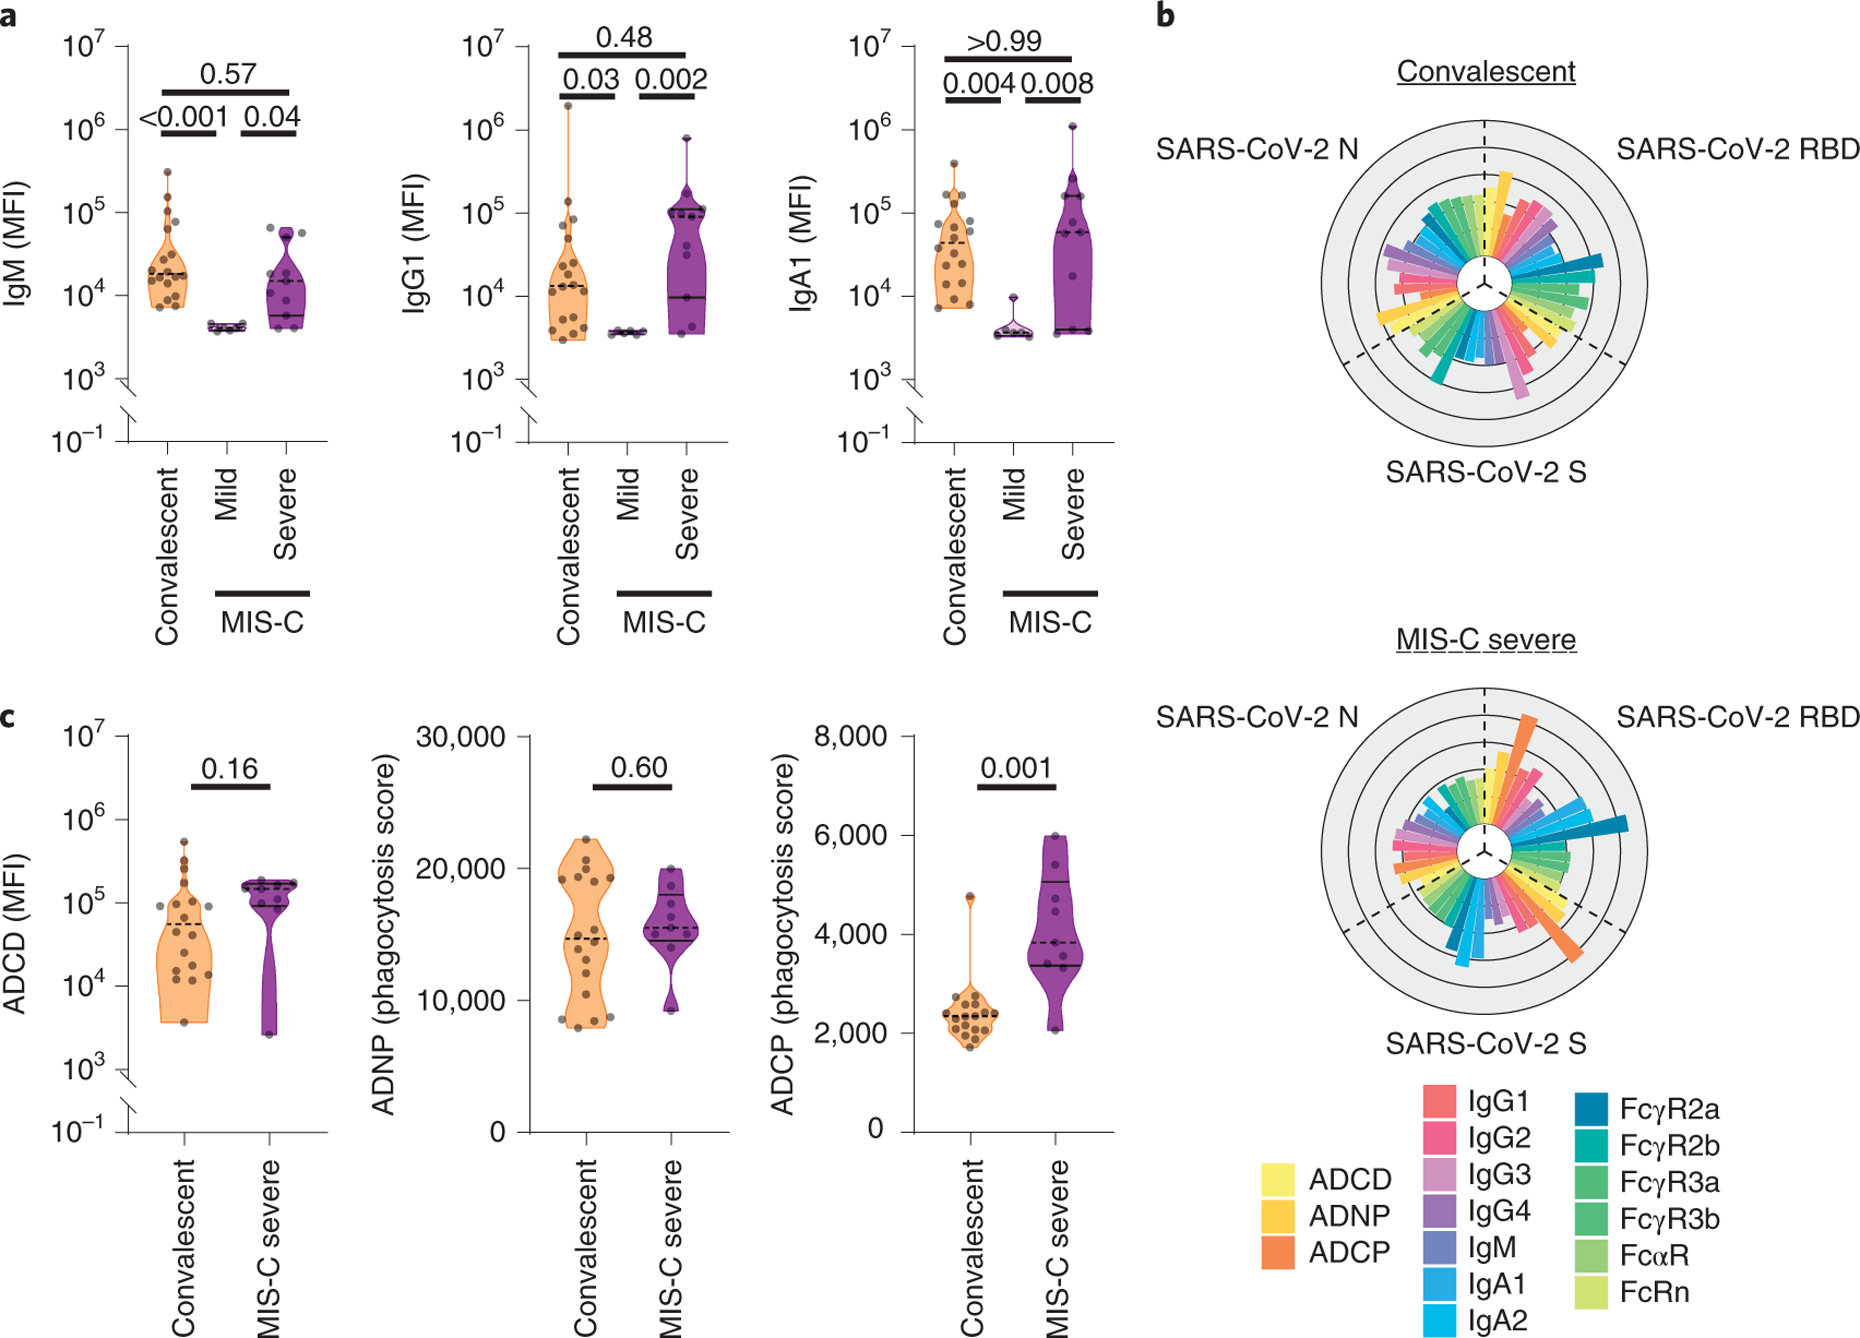
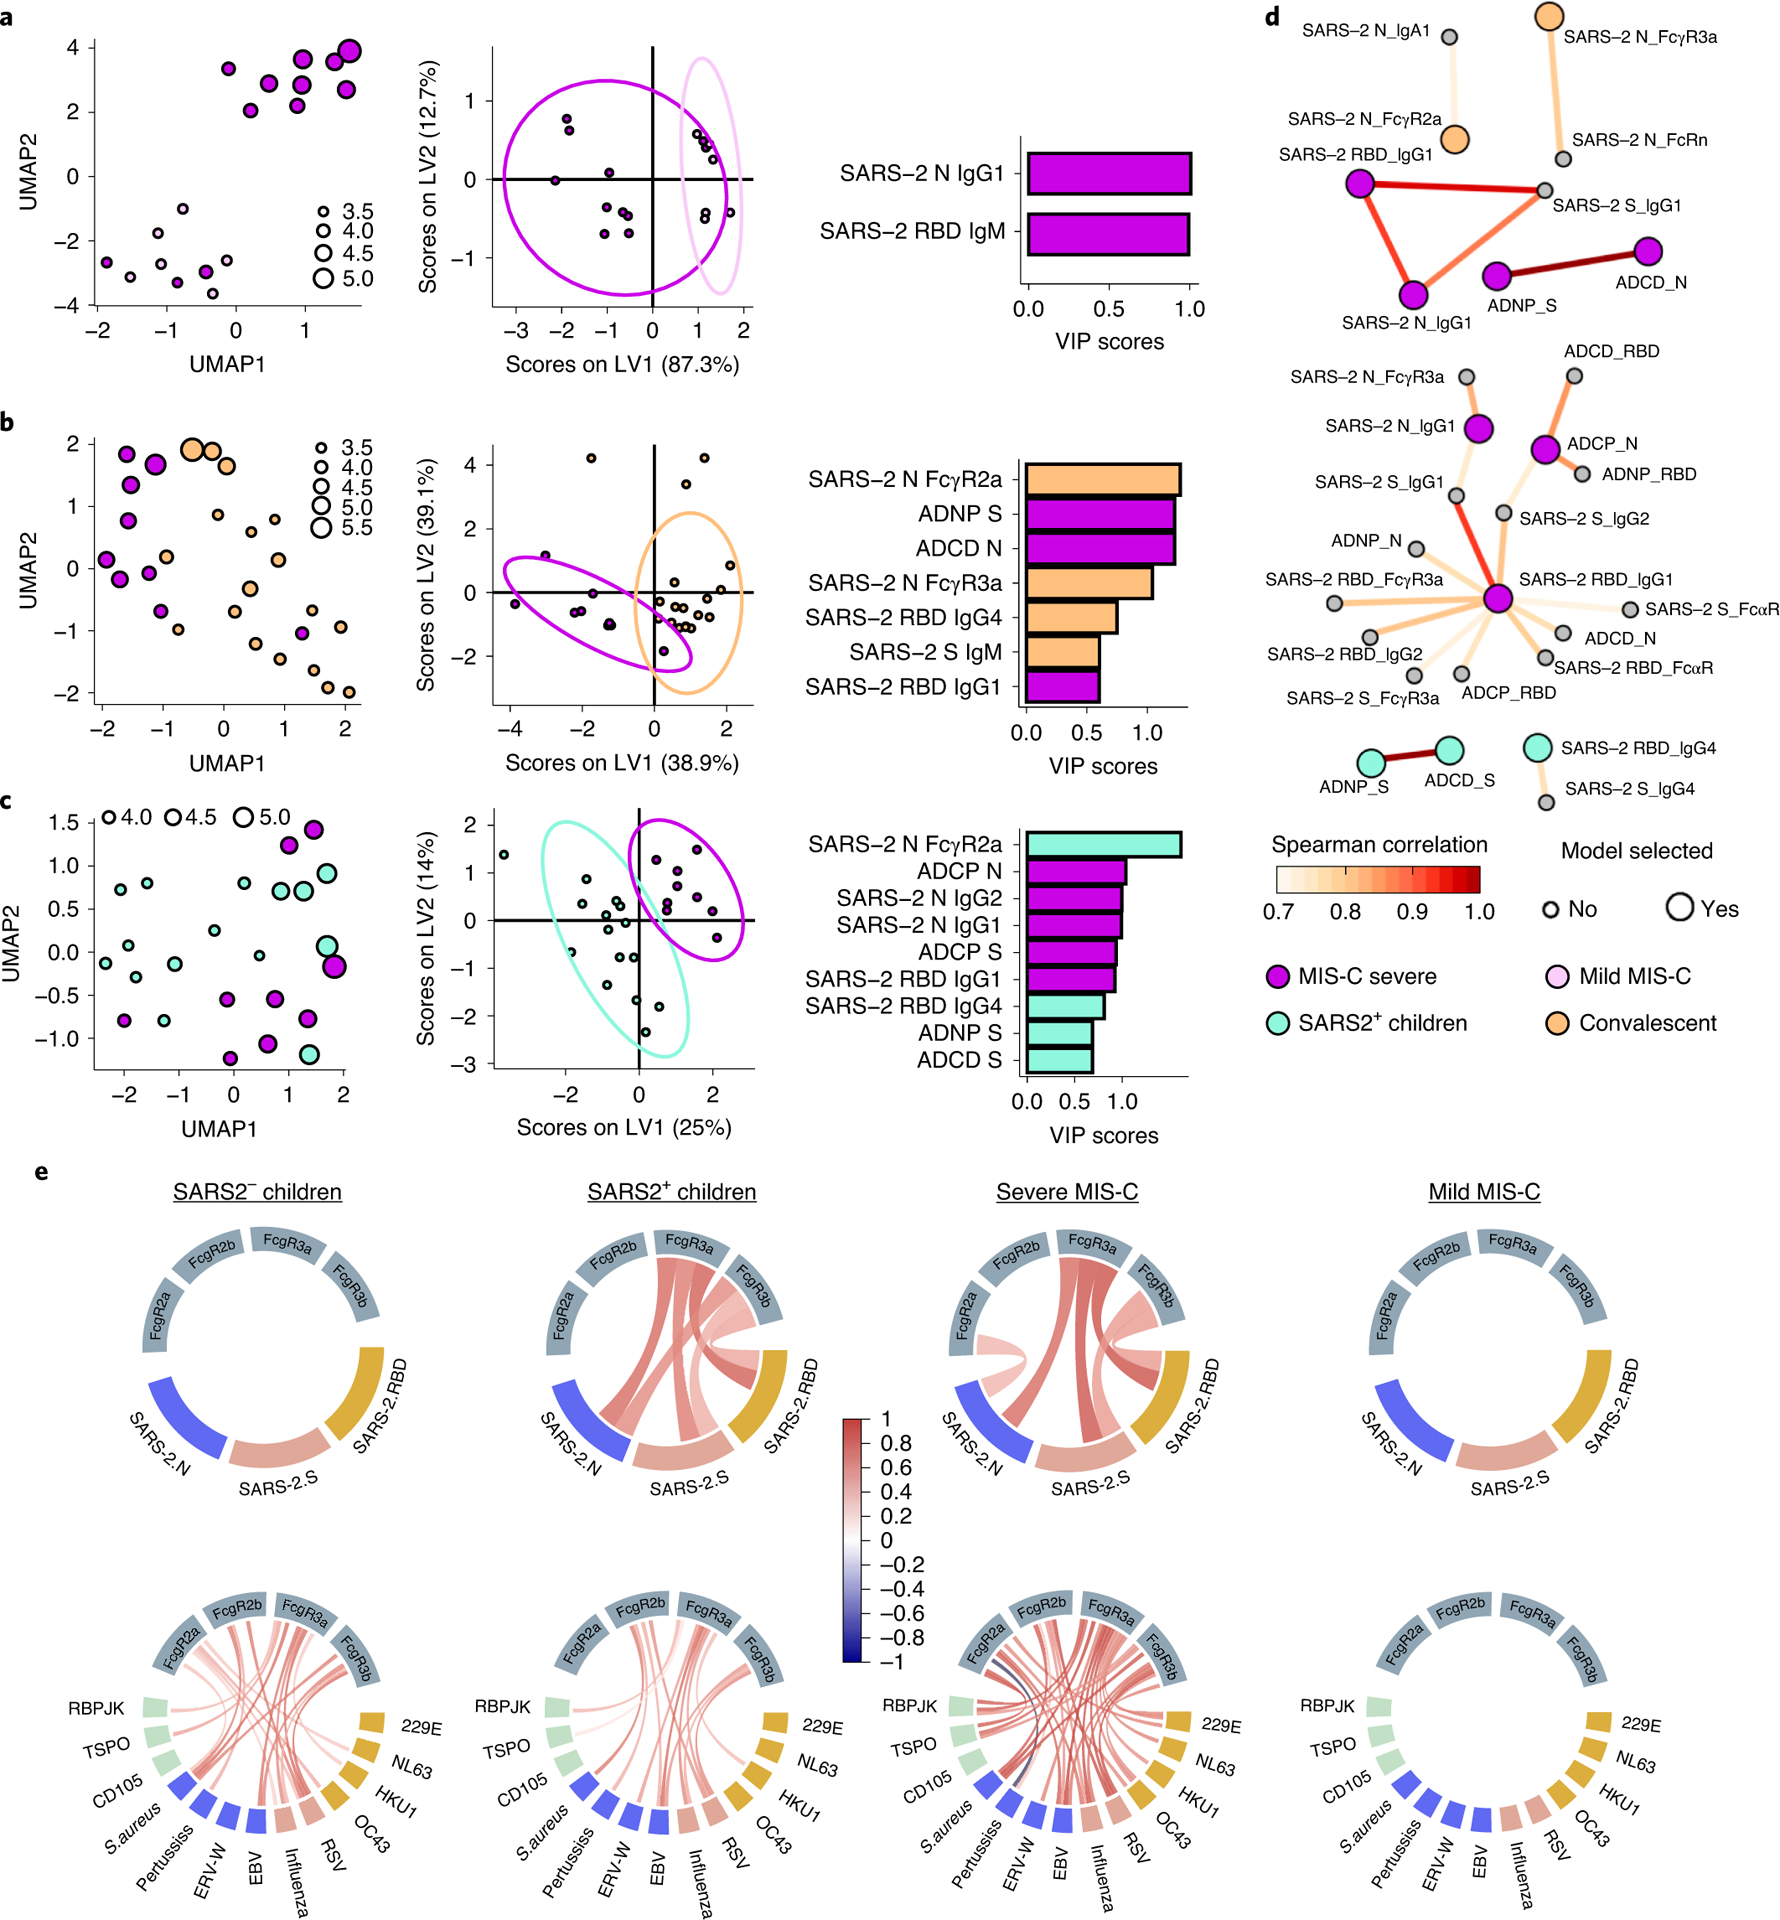
The severe acute respiratory syndrome coronavirus 2 (SARS-CoV-2) pandemic continues to spread relentlessly, associated with a high frequency of respiratory failure and mortality. Children experience largely asymptomatic disease, with rare reports of multisystem inflammatory syndrome in children (MIS-C). Identifying immune mechanisms that result in these disparate clinical phenotypes in children could provide critical insights into coronavirus disease 2019 (COVID-19) pathogenesis. Using systems serology, in this study we observed in 25 children with acute mild COVID-19 a functional phagocyte and complement-activating IgG response to SARS-CoV-2, similar to the acute responses generated in adults with mild disease. Conversely, IgA and neutrophil responses were significantly expanded in adults with severe disease. Moreover, weeks after the resolution of SARS-CoV-2 infection, children who develop MIS-C maintained highly inflammatory monocyte-activating SARS-CoV-2 IgG antibodies, distinguishable from acute disease in children but with antibody levels similar to those in convalescent adults. Collectively, these data provide unique insights into the potential mechanisms of IgG and IgA that might underlie differential disease severity as well as unexpected complications in children infected with SARS-CoV-2.


Conflict of interest statement

Conflict of interest

Galit Alter is a founder of Seromyx Systems Inc, a company developing platform technology that describes the antibody immune response. Dr. Alter’s interests were reviewed and are managed by Massachusetts General Hospital and Partners HealthCare in accordance with their conflict of interest policies. All other authors have declared that no conflict of interest exists.

Figures

Figure 1:
Figure 1:. Disease severity tracks with enhanced humoral immunity to COVID-19.
SARS-CoV-2 specific plasma antibody responses in mild (non-hospitalized) or severe (hospitalized) adult COVID-19 patients and children with mild COVID-19 patients were analyzed. A) SARS-CoV-2 Spike (S) protein specific IgM, IgG1 and IgA1 titers were analyzed by Luminex (nmild=34, nsevere=26, nchildren=25). The dotted line represents the average plus 5 times the standard deviation of the negative plasma samples used to determine seropositivity (see Methods). B) IgG subclasses 1–4, isotypes IgM, IgA1 and IgA2, and antibody-mediated functions (complement deposition (ADCD), neutrophil phagocytosis (ADNP) and THP-1 monocyte phagocytosis (ADCP)) for SARS-CoV-2 RBD, S and N were analyzed in all seropositive individuals (nmild=17, nsevere=26, nchildren=15). Each flower plot summarizes the data from the respective group and the length of each petal represents the average of the Z-scored value for the indicated feature (Supplemental Figures 1–4). C) Univariate comparison of ADCD, ADNP and ADCP against SARS-CoV-2 S in seropositive individuals are shown. The dashed line in the violin plots indicate the median per group and solid lines indicate quartiles. A non-parametric Kruskal-Wallis test was used to test for statistically significant differences between multiple groups.
Figure 2:
Figure 2:. SARS-CoV-2 specific IgA titers and augmented antibody functionality discriminate severe from mild disease.
Pair-wise comparisons were performed between seropositive mild diseased children and severely ill adults (A and D), mild and severe diseased adults (B and E) or mild diseased children and adults (C and F) (nmild=17 nsevere=26, nchildren=15). A, B, C) Multivariate UMAP analyses show the variation in the multivariate humoral profiles across the groups. Proximity of points indicate homology in the overall dataset. D, E, F). In a second approach, a supervised multivariate comparison was performed across groups, where features were initially reduced using LASSO, to avoid overfitting, and then visualized by PLS-DA (left panel). Cross-validation accuracy for D, E, F) was: 0.91, 0.97, 0.65, respectively. The LASSO selected features were also plotted and ranked in a VIP score plot (right panel, color of bars indicate in which group the feature was enriched). G) Network correlations depict the additional non-LASSO-selected Fc-profile features (small circles) that were correlated with the LASSO selected features (big circles) based on pair-wise comparisons between children and severely ill adults. The connections between points (features) indicate significant (p>0.05) Spearman correlations. Fill color of the circles indicate in which group the selected feature were enriched (grey = feature was not selected), the color of connecting lines indicate the strengths of the correlation coefficient.
Figure 3.
Figure 3.. Unique functional and evolutionary profiles of SARS-CoV-2 IgA antibodies.
The matched-line graphs show the impact of IgG (A) and IgA (B) and IgG+IgA (C) depletion on ADNP activity across severely ill adults (dark blue, n=25), mildly ill adults (red, n=16), or children with mild disease (light blue, n=12). (D) The bar graphs show the level of degranulation of MPO, lactoferrin and MMP-9, and cytokine secretion of IL-1β, IL-6, and IL-8 in pooled naïve/undepleted plasma from severe adult COVID patients compared to IgG or IgA depleted plasma. Data are presented as mean values +/− SD of three individual blood neutrophil donors. (E) The principal component analysis highlights the multivariate functional profiles observed in undepleted, IgG or IgA depleted plasma, highlighting the distinct inflammatory cascades associated with IgA depletion (light blue) that intermingled with IgG depleted plasma (medium blue), both of which were distinct from naïve undepleted plasma (black). (F) The line graphs show the longitudinal evolution of IgA1, IgA2, FcαR binding, and ADNP at different timepoints in severely (n=59) or moderately (n=77) ill individuals followed within the first 2 weeks following symptom onset (not all timepoints for all individuals were available). Statistical significance in A–C was calculated by non-parametric two-sided Wilcoxon matched-pairs signed rank test and a parametric One-way ANOVA in D. A Mann-Whitney test was used to assess statistical difference between the groups at each interval in F) and p-values were corrected for multiple hypothesis testing using the Benjamini-Hochberg procedure.
Figure 4:
Figure 4:. Distinct SARS-CoV-2 specific antibody responses in children with severe MIS-C.
SARS-CoV-2 specific plasma antibody responses were analyzed in children with mild or severe MIS-C or convalescent adults. A) SARS-CoV-2 Spike (S) protein specific IgM, IgG1 and IgA1 titers were analyzed by Luminex (nconv=18, nmild=6, nsevere=11). The dotted line represents the average plus 5 times the standard deviation of the negative plasma samples used to determine seropositivity (see Methods). B) IgG subclasses 1–4, isotypes IgM, IgA1 and IgA2, and antibody-mediated functions (ADCD, ADNP, and ADCP) for SARS-CoV-2 RBD, S and N in all seropositive individuals were analyzed (nconv=18, nsevere=9). Each flower plot summarizes the data of the respective group and each petal represents the average of the Z-scored value for the indicated feature (Supplemental Figures 1–4). C) Univariate analysis of ADCD, ADNP, and ADCP against SARS-CoV-2 S are shown. Dashed lines in the violin plots indicate the median per group and solid lines indicate quartiles. A non-parametric two-sided Mann-Whitney test was used to test for statistically significant differences between the two groups.
Figure 5:
Figure 5:. Dysregulated and pro-inflammatory antibody-profiles in children with severe MIS-C.
Pairwise comparisons by UMAP and LASSO/PLS-DA analyses are shown across mild and severe MIS-C (A), severe MIS-C and convalescent (B) or severe MIS-C and acutely infected children (C) (nmild_MIS-C=6, nsevere MIS-C=9, nSARS+ children=15, nconvalescent=18). The size of each dot represents the log10 scaled value of IgG1 titer to SARS2 RBD. The cross-validation accuracy in B) and C) were: 0.89, 0.88, respectively. D) The correlation network of LASSO selected (big circles) or unselected (small circles) features are shown across children and severely ill adults. Connection between points (features) indicate significant relationships (p>0.05) defined by a Spearman correlation after Benjamini-Hochberg correction. Fill color of the circles indicate in which group the selected feature was enriched (grey = feature was not selected), the color of the connecting lines indicates the correlation coefficient. E) The chord diagrams show the relationships of Luminex defined IgG1 titers across SARS-CoV-2 antigens (upper panel, yellow =RBD, red =S, and blue =N) and other pathogens and auto-antigens (lower panel, yellow = common CoVs RBD, red = other respiratory viruses, blue = KD associated pathogens, green = MIS-C associated auto-antigens) assessed by Spearman correlation. The connecting lines between colored boxes (antigen-specific IgG1 titer) and grey boxes (FcγRs) indicate a significant (p<0.05) correlation between antigen-specific IgG1 titers and binding to the indicated FcγR for the respective antigen. A color-gradient was used to indicate the correlation coefficient (from r=−1 (dark blue) over r=0 (white) to r=1 (dark red)) for the individual correlations.

References

    1. CDC-Covid-Response-Team. Coronavirus Disease 2019 in Children - United States, February 12-April 2, 2020. MMWR Morb Mortal Wkly Rep 69, 422–426, doi:10.15585/mmwr.mm6914e4 (2020). - DOI - PMC - PubMed
    1. Bi Q et al. Epidemiology and transmission of COVID-19 in 391 cases and 1286 of their close contacts in Shenzhen, China: a retrospective cohort study. Lancet Infect Dis, doi:10.1016/S1473-3099(20)30287-5 (2020). - DOI - PMC - PubMed
    1. Yonker LM et al. Pediatric SARS-CoV-2: Clinical Presentation, Infectivity, and Immune Responses. J Pediatr, doi:10.1016/j.jpeds.2020.08.037 (2020). - DOI - PMC - PubMed
    1. Braun J et al. SARS-CoV-2-reactive T cells in healthy donors and patients with COVID-19. Nature, doi:10.1038/s41586-020-2598-9 (2020). - DOI - PubMed
    1. Ladner JT et al. Epitope-resolved profiling of the SARS-CoV-2 antibody response identifies cross-reactivity with an endemic human CoV. bioRxiv, doi:10.1101/2020.07.27.222943 (2020). - DOI - PMC - PubMed

Publication types

MeSH terms

Supplementary concepts