. 2021 Apr;24(4):572-583.
doi: 10.1038/s41593-020-00795-0. Epub 2021 Feb 15.

Single-cell transcriptomic analysis of the adult mouse spinal cord reveals molecular diversity of autonomic and skeletal motor neurons

Affiliations

Single-cell transcriptomic analysis of the adult mouse spinal cord reveals molecular diversity of autonomic and skeletal motor neurons

Jacob A Blum et al. Nat Neurosci. 2021 Apr.

Abstract

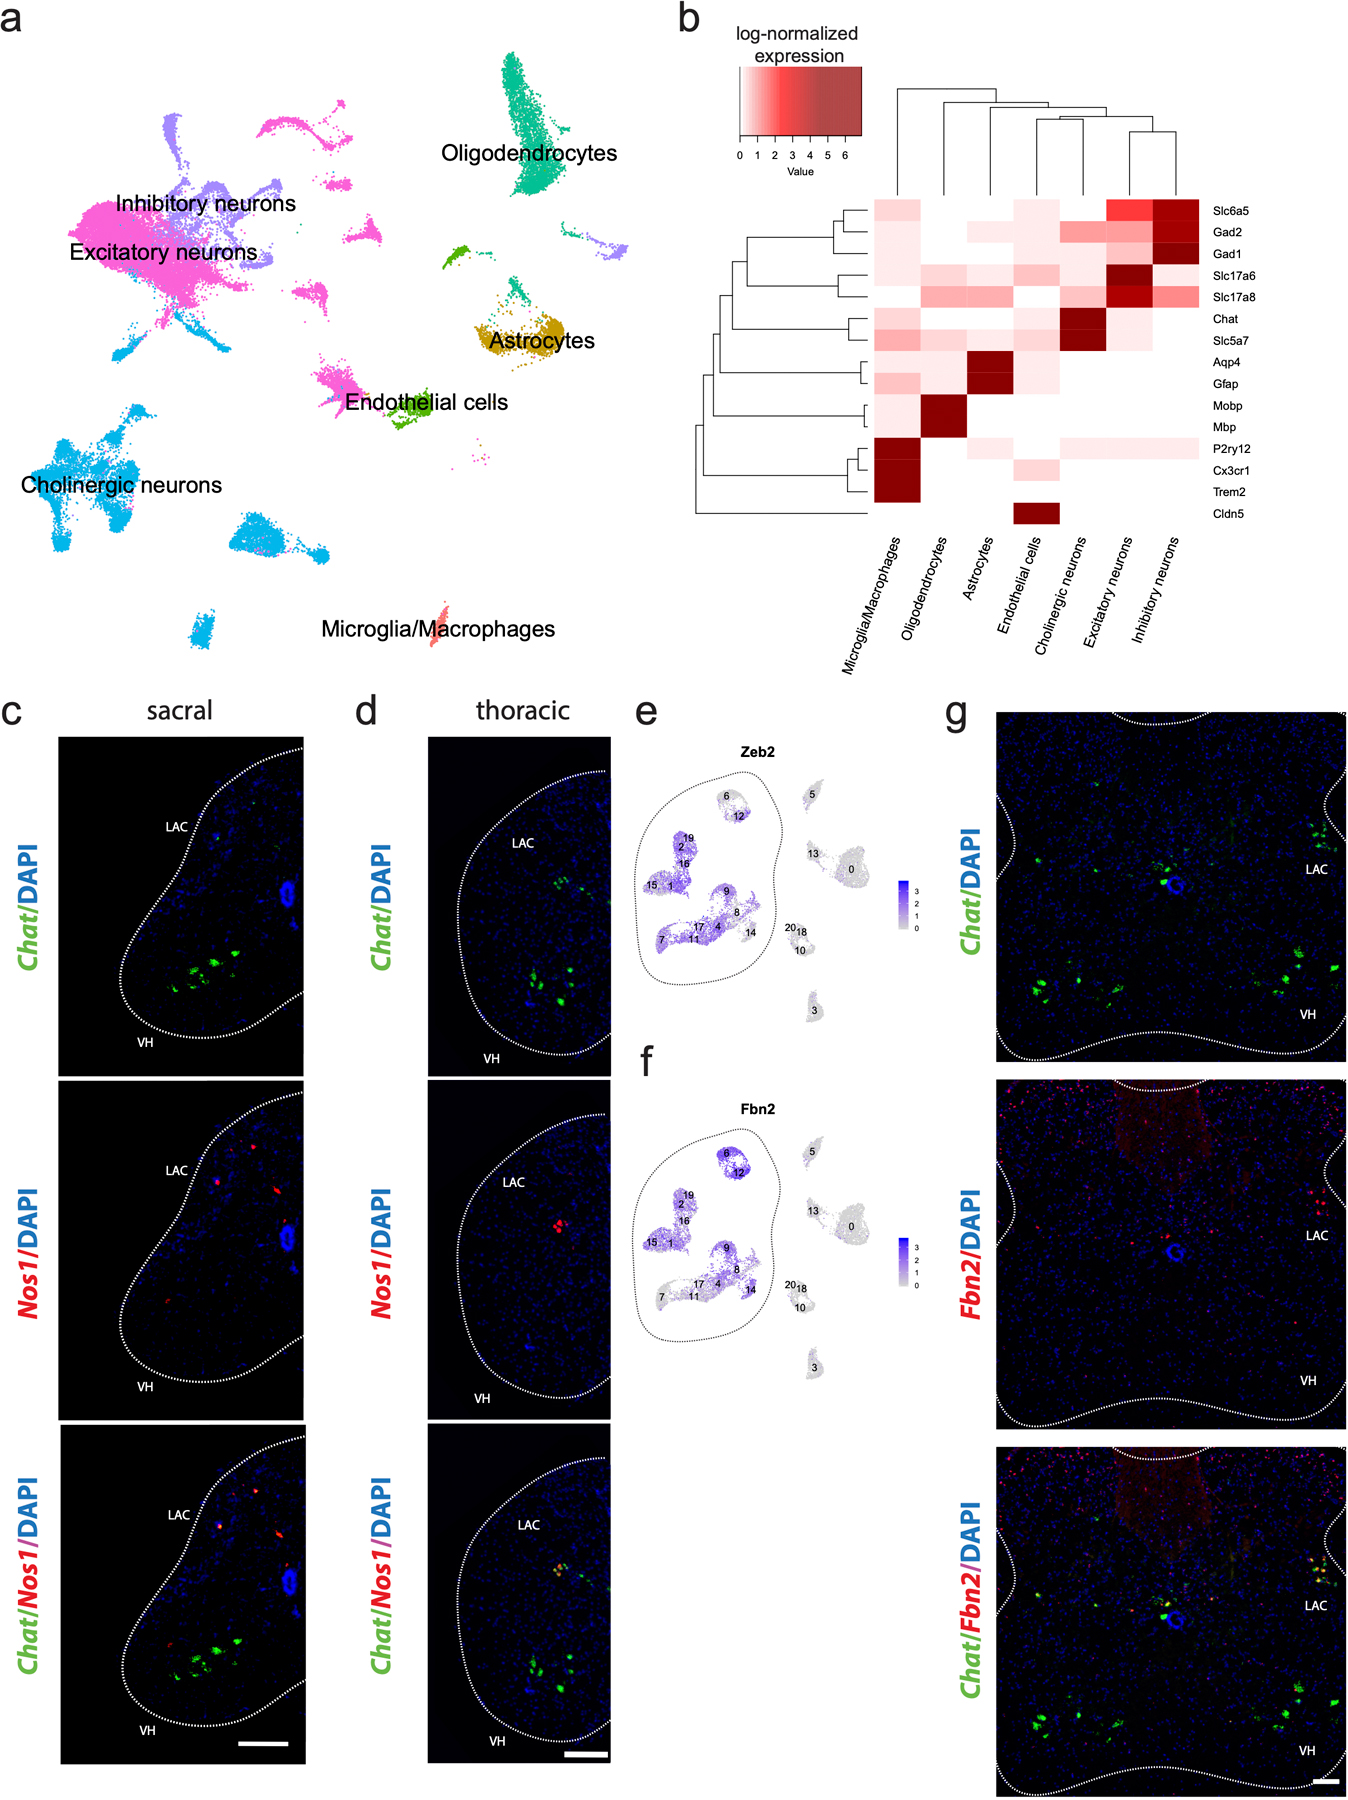
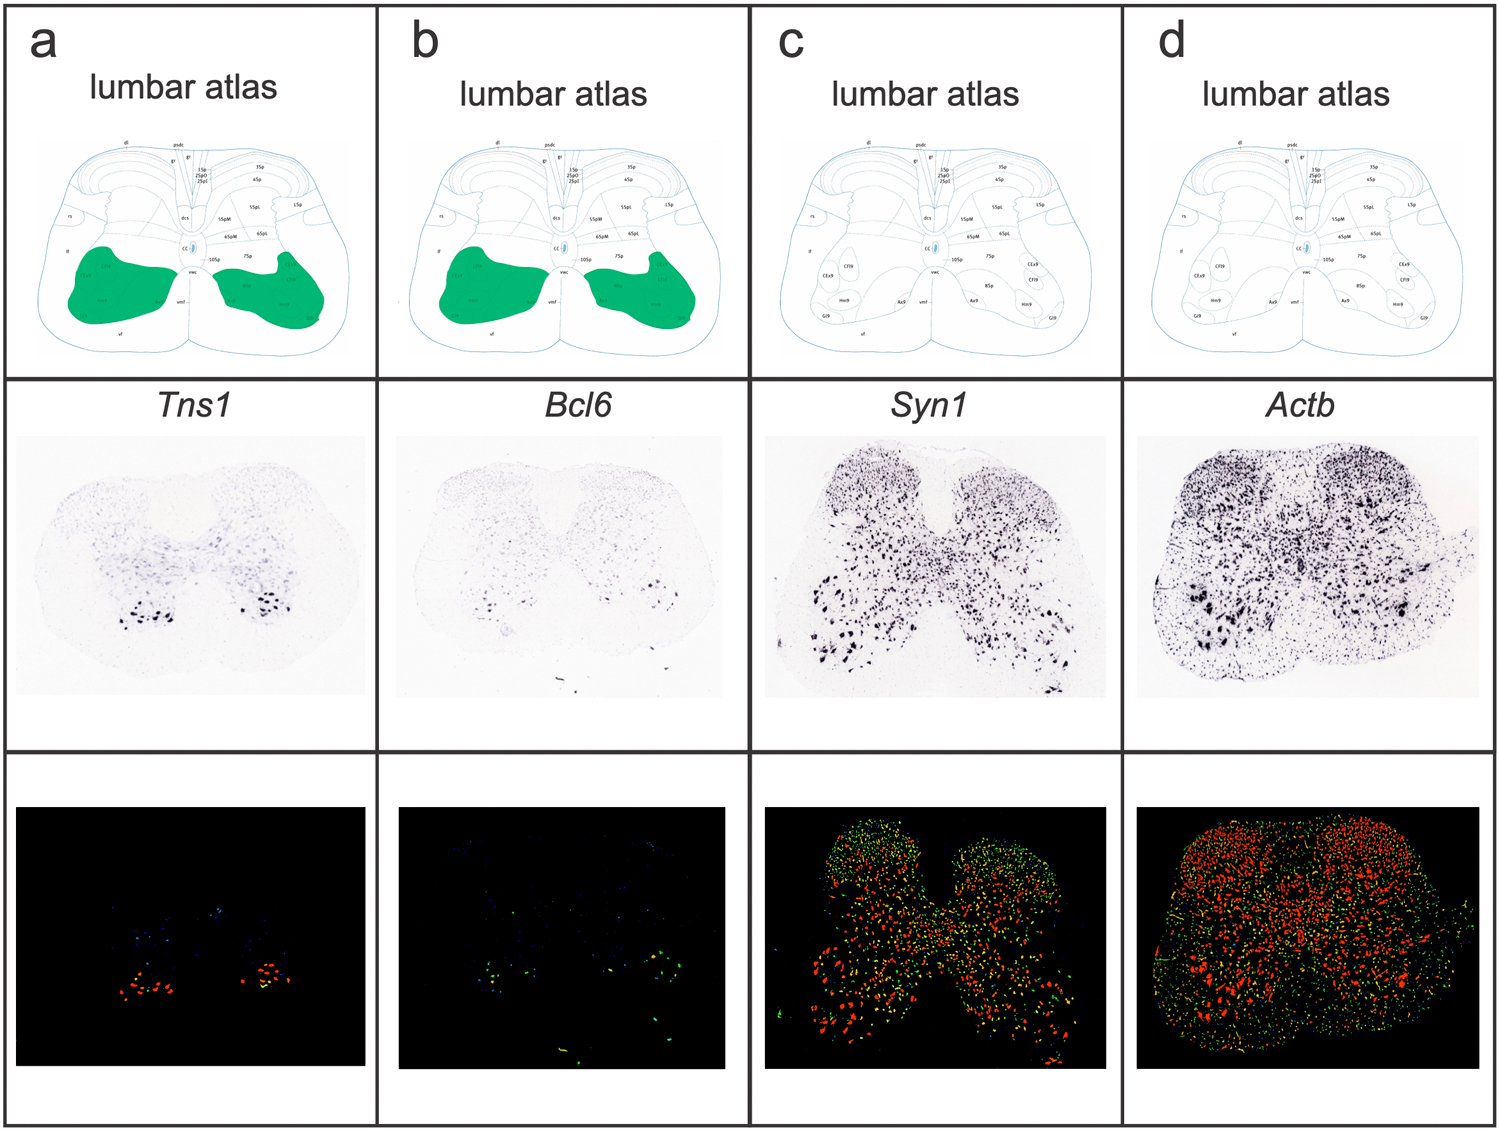
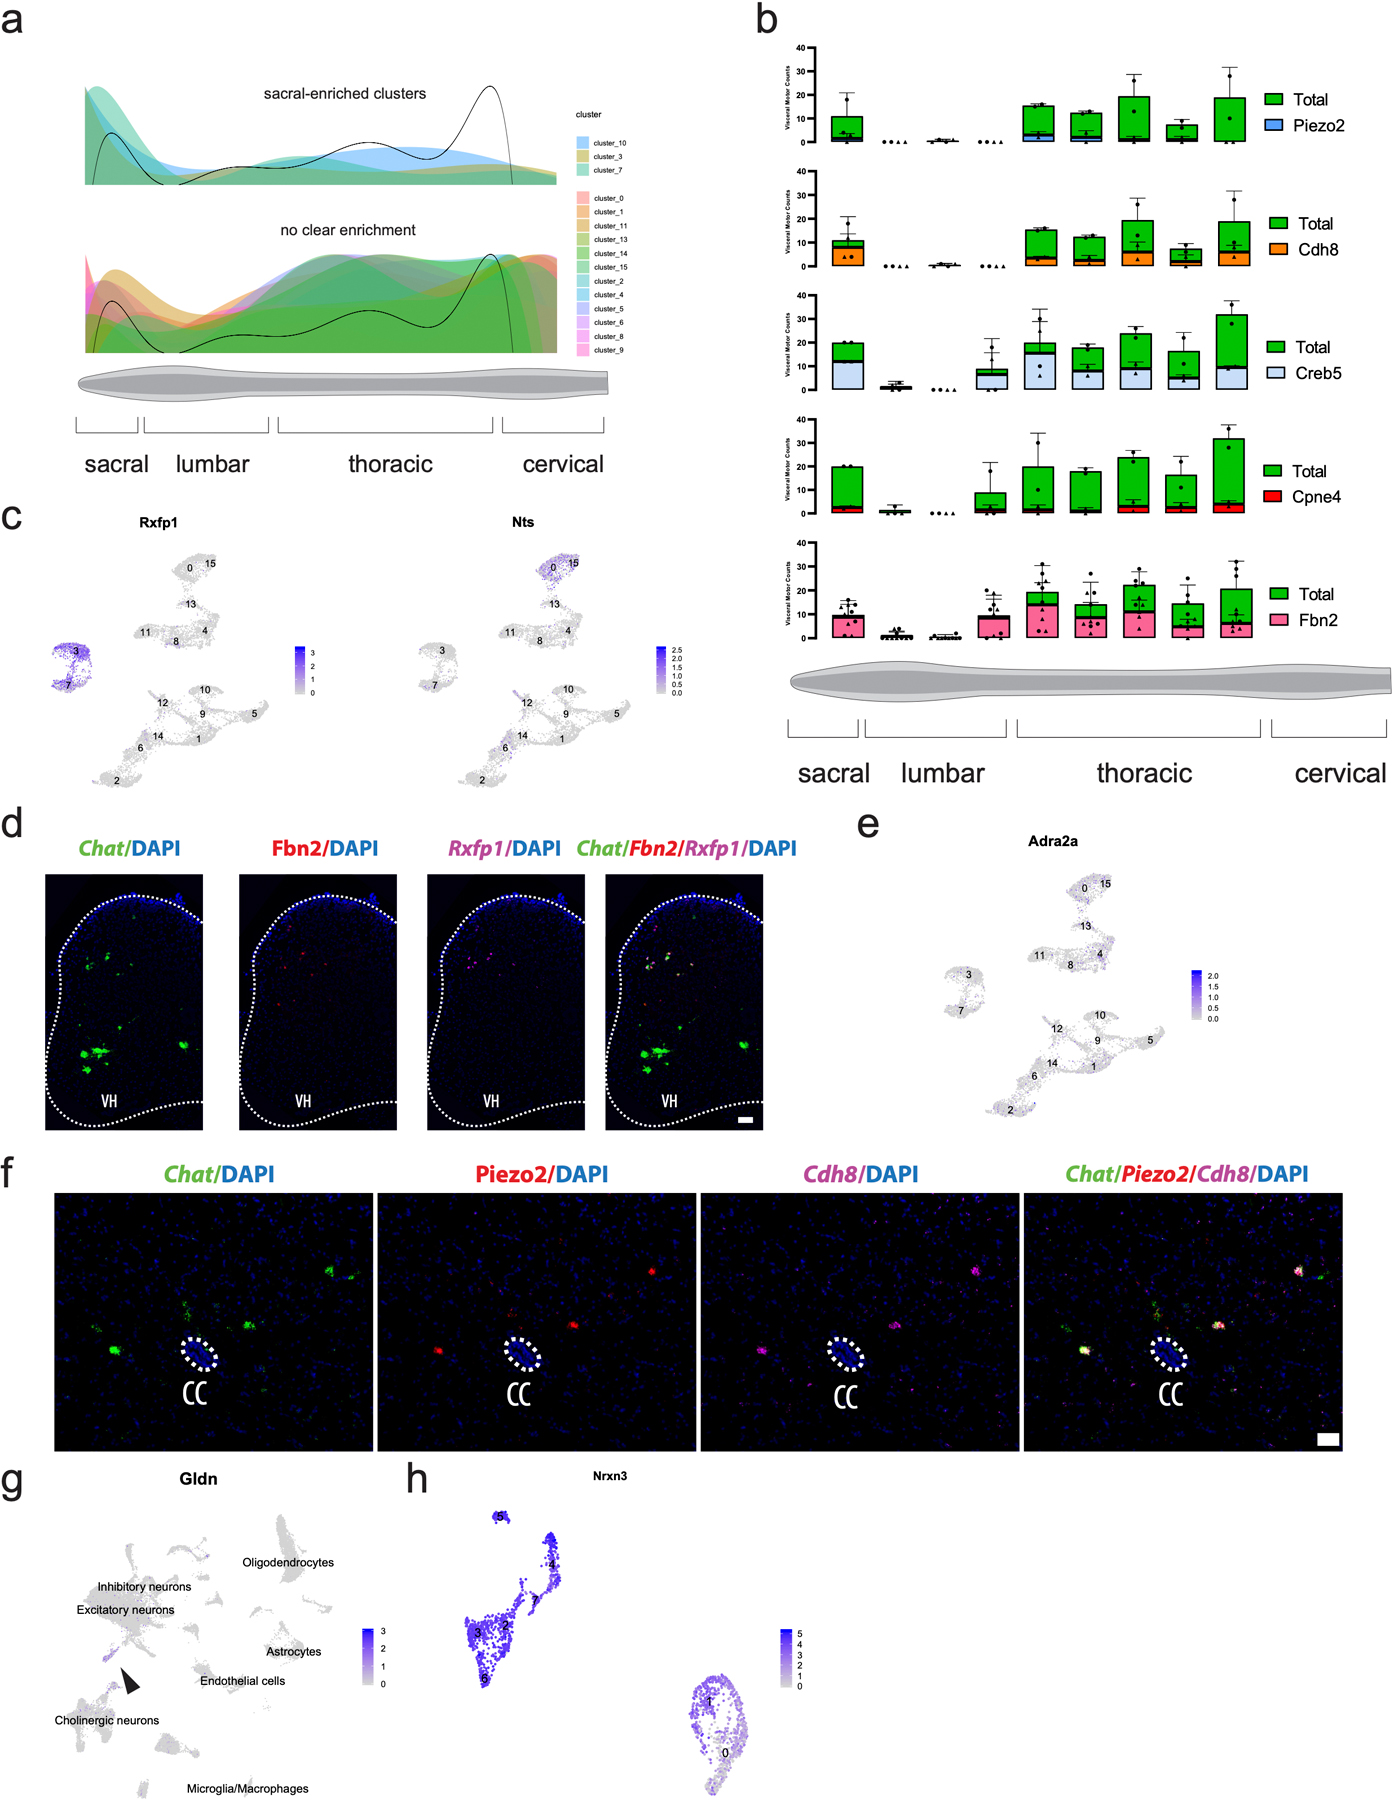
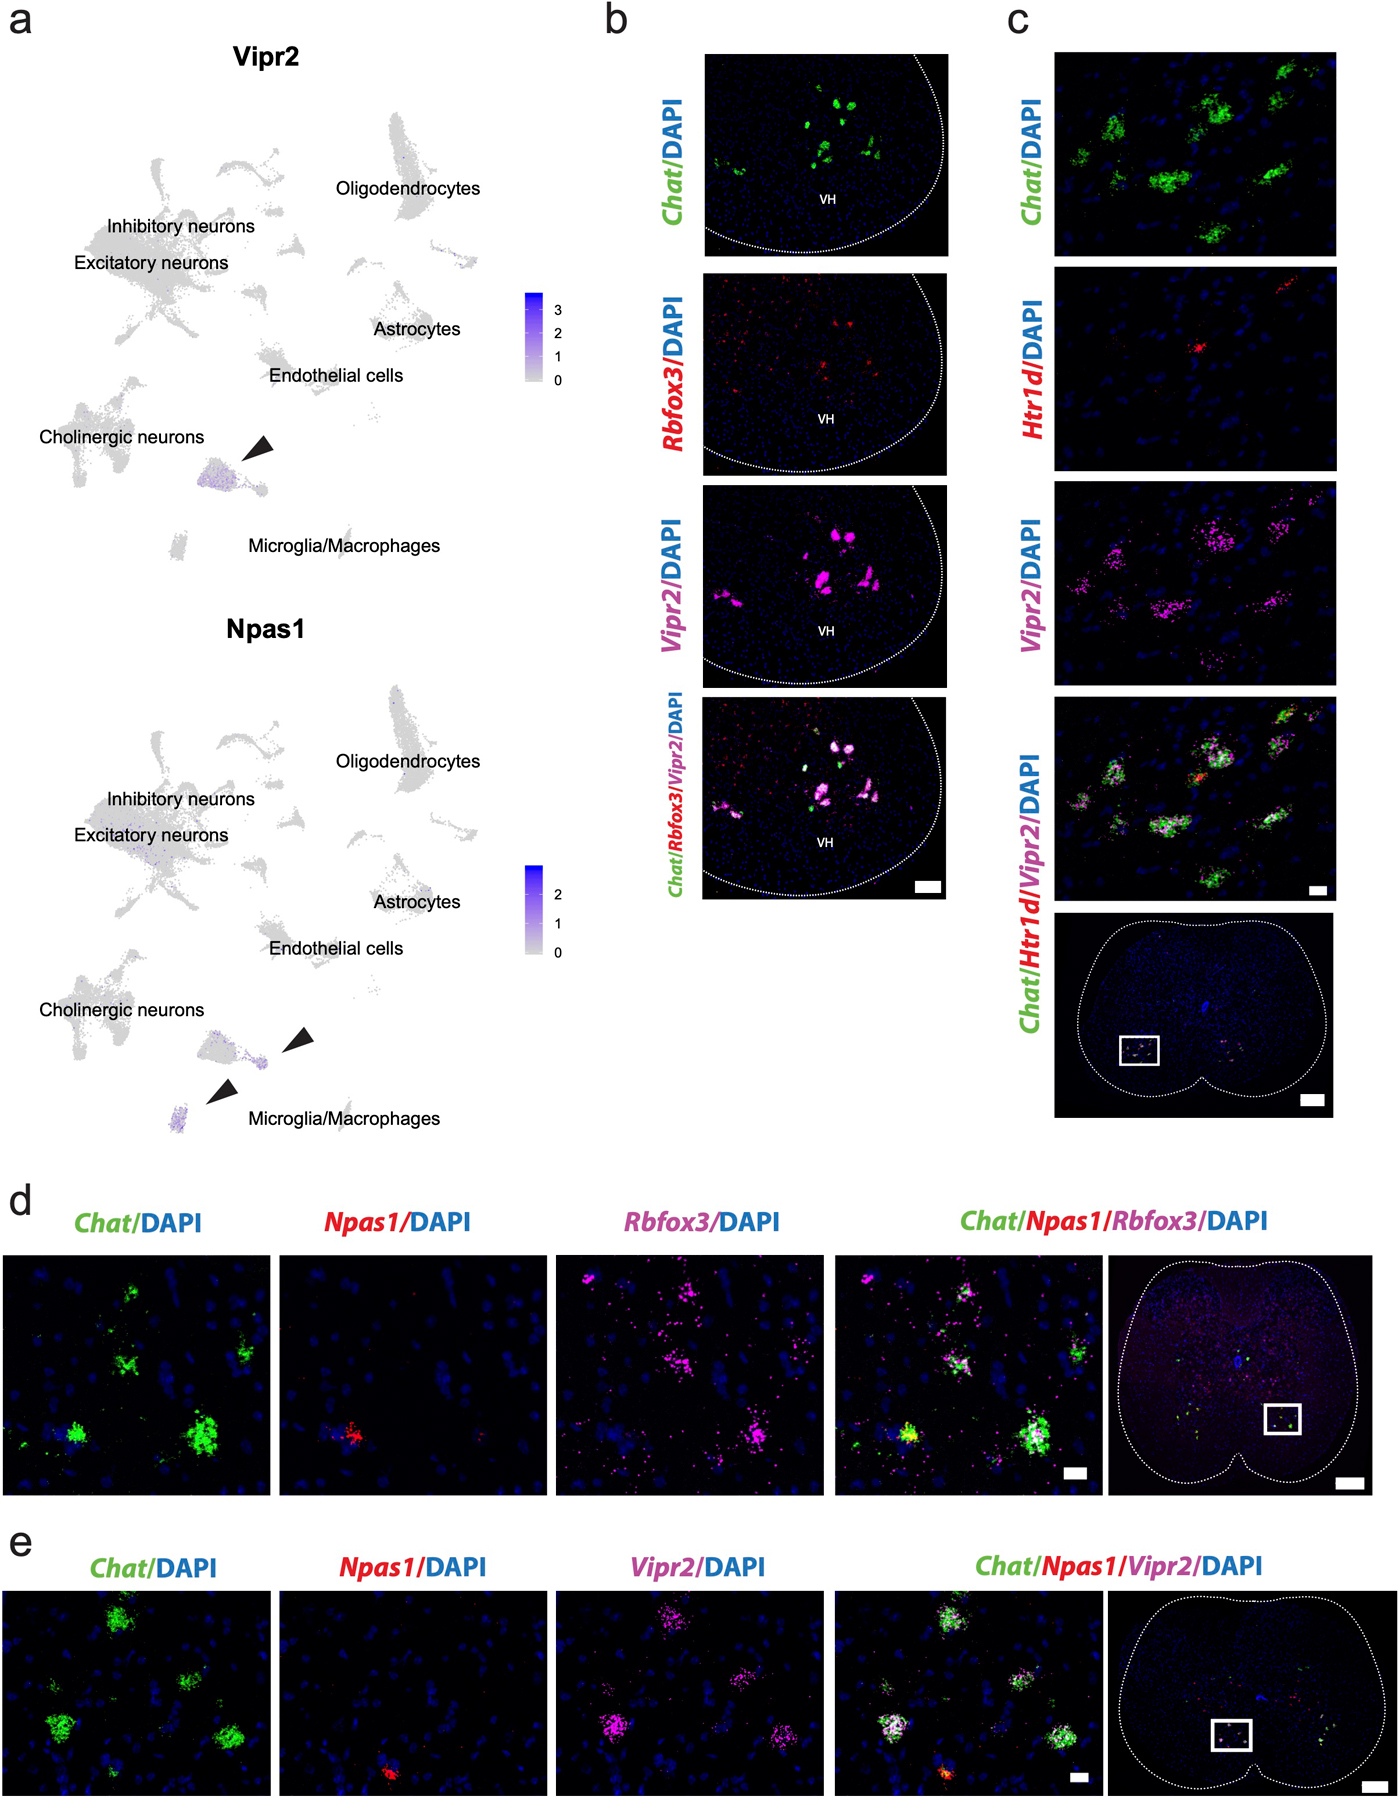
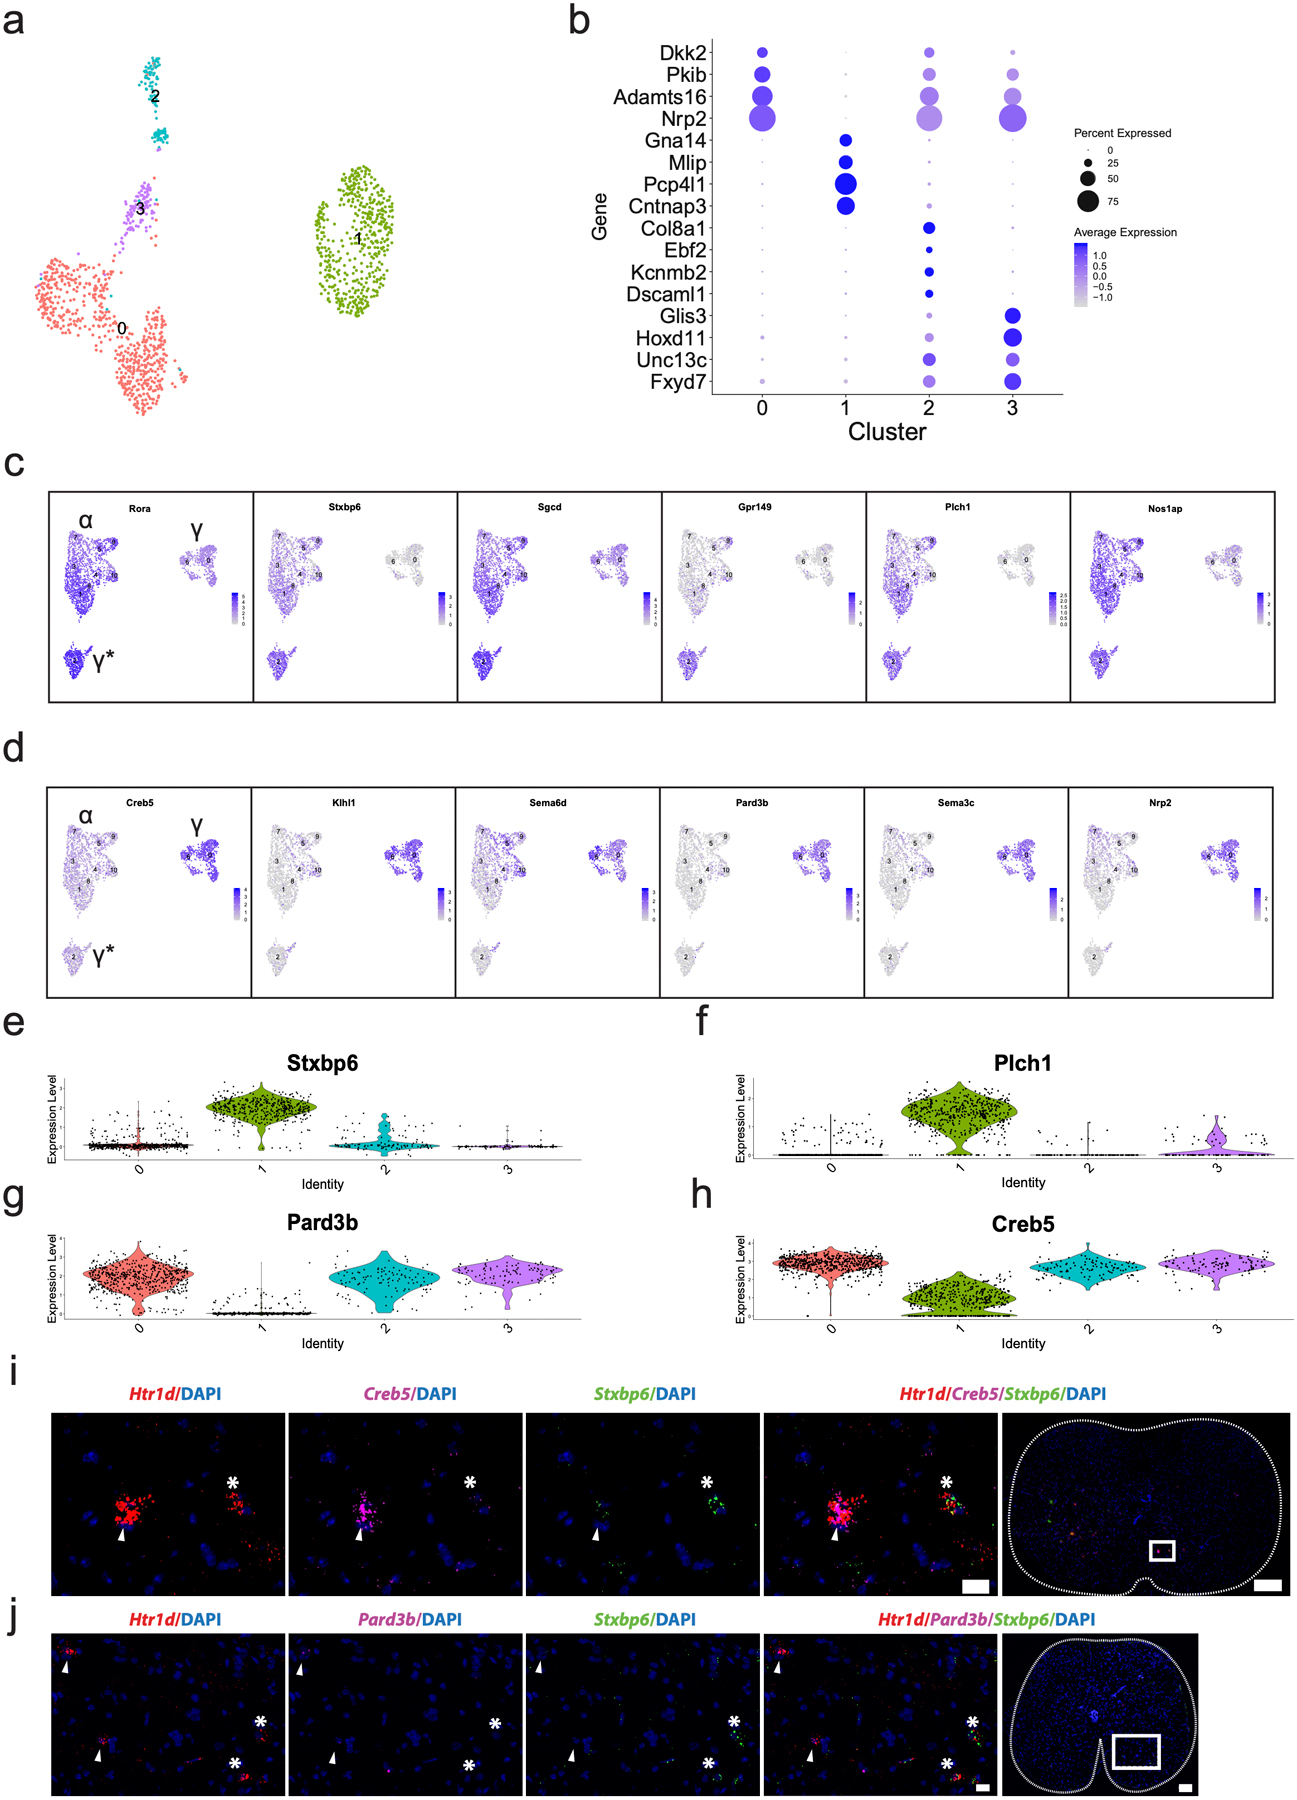
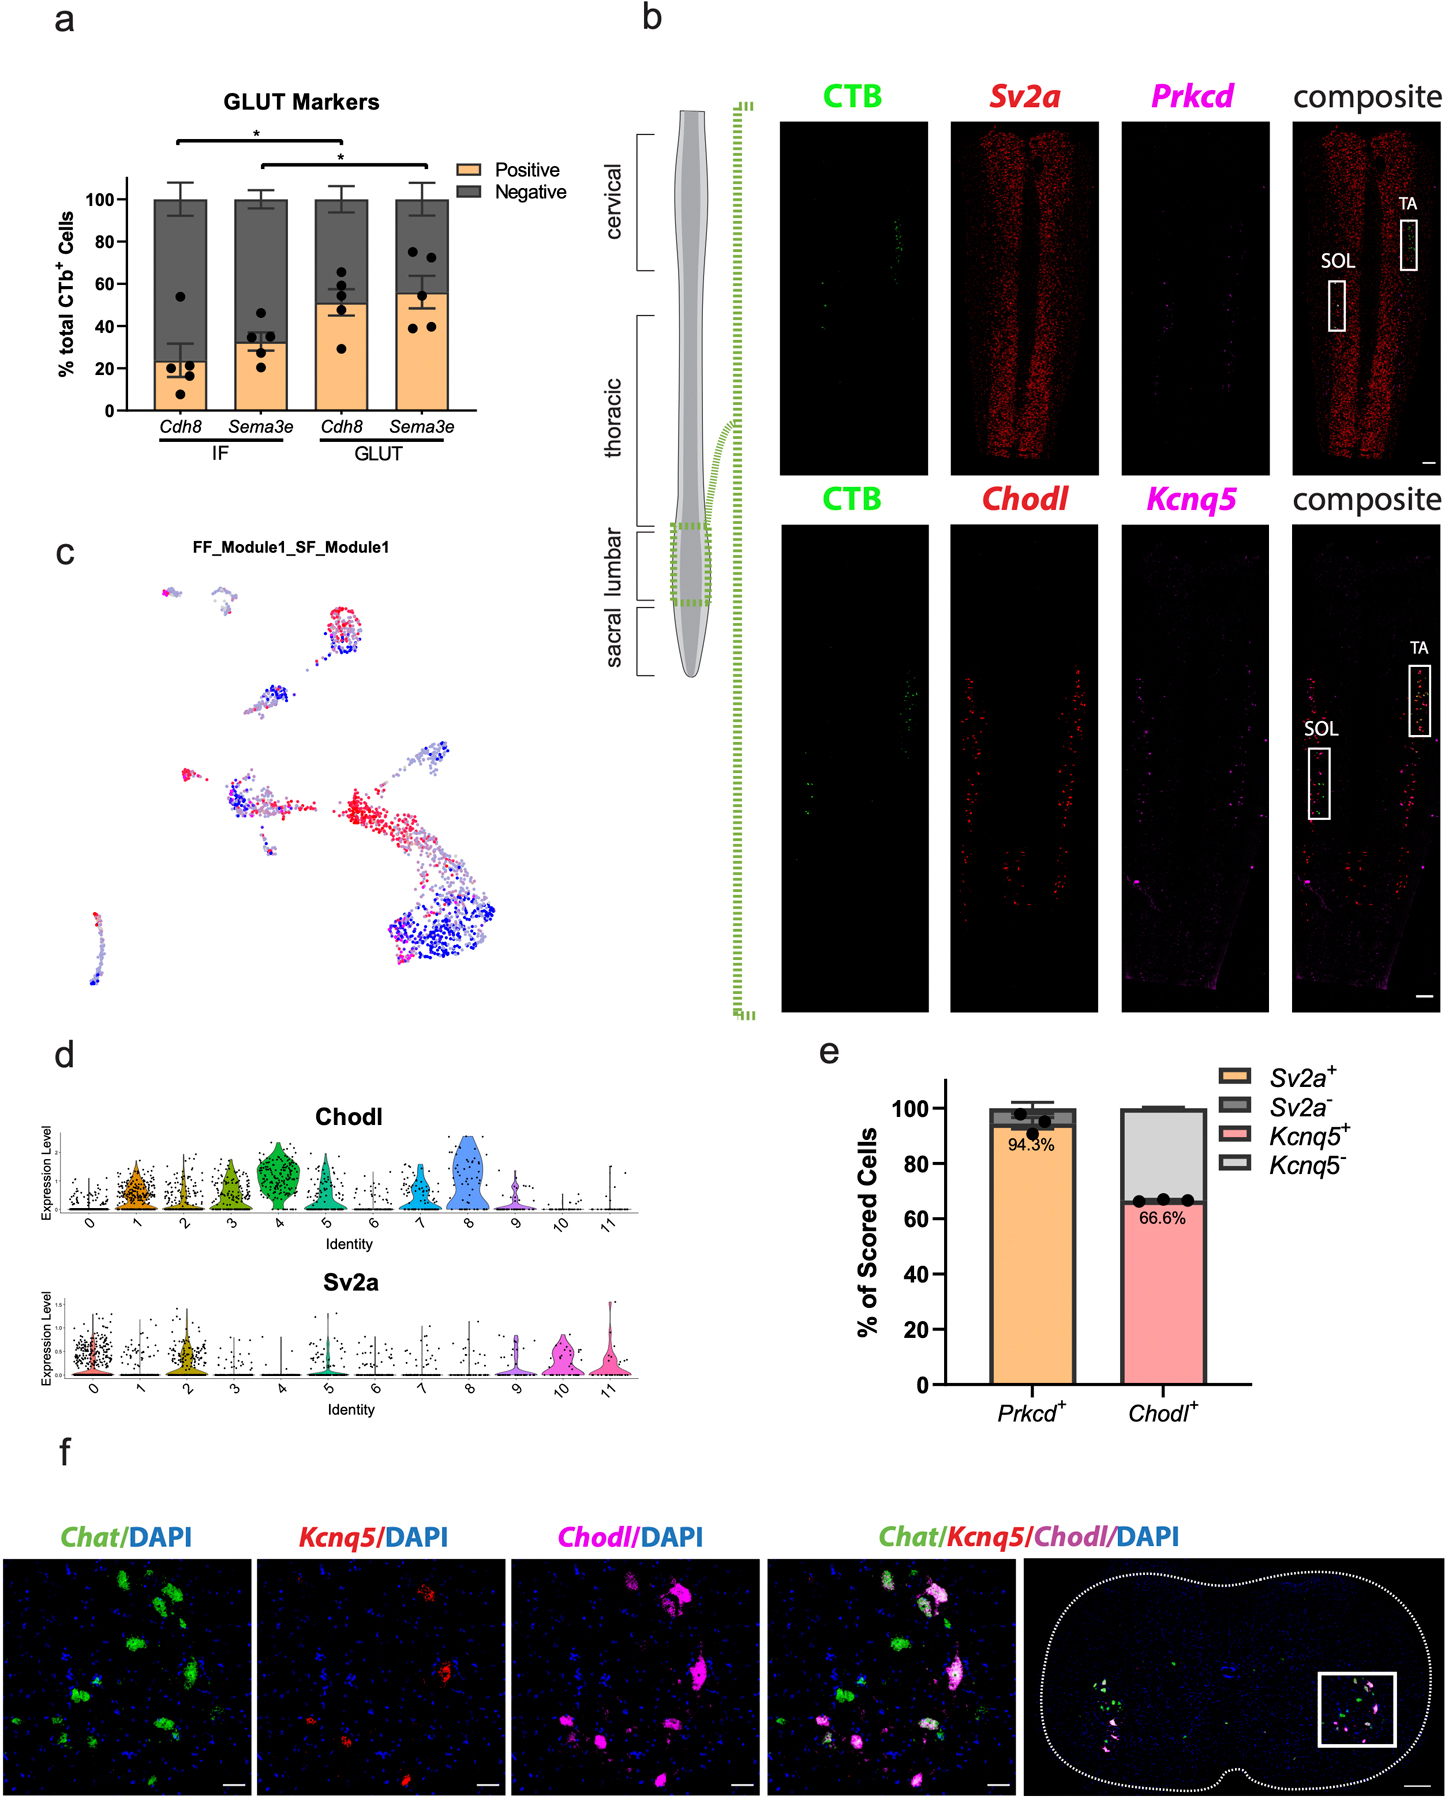
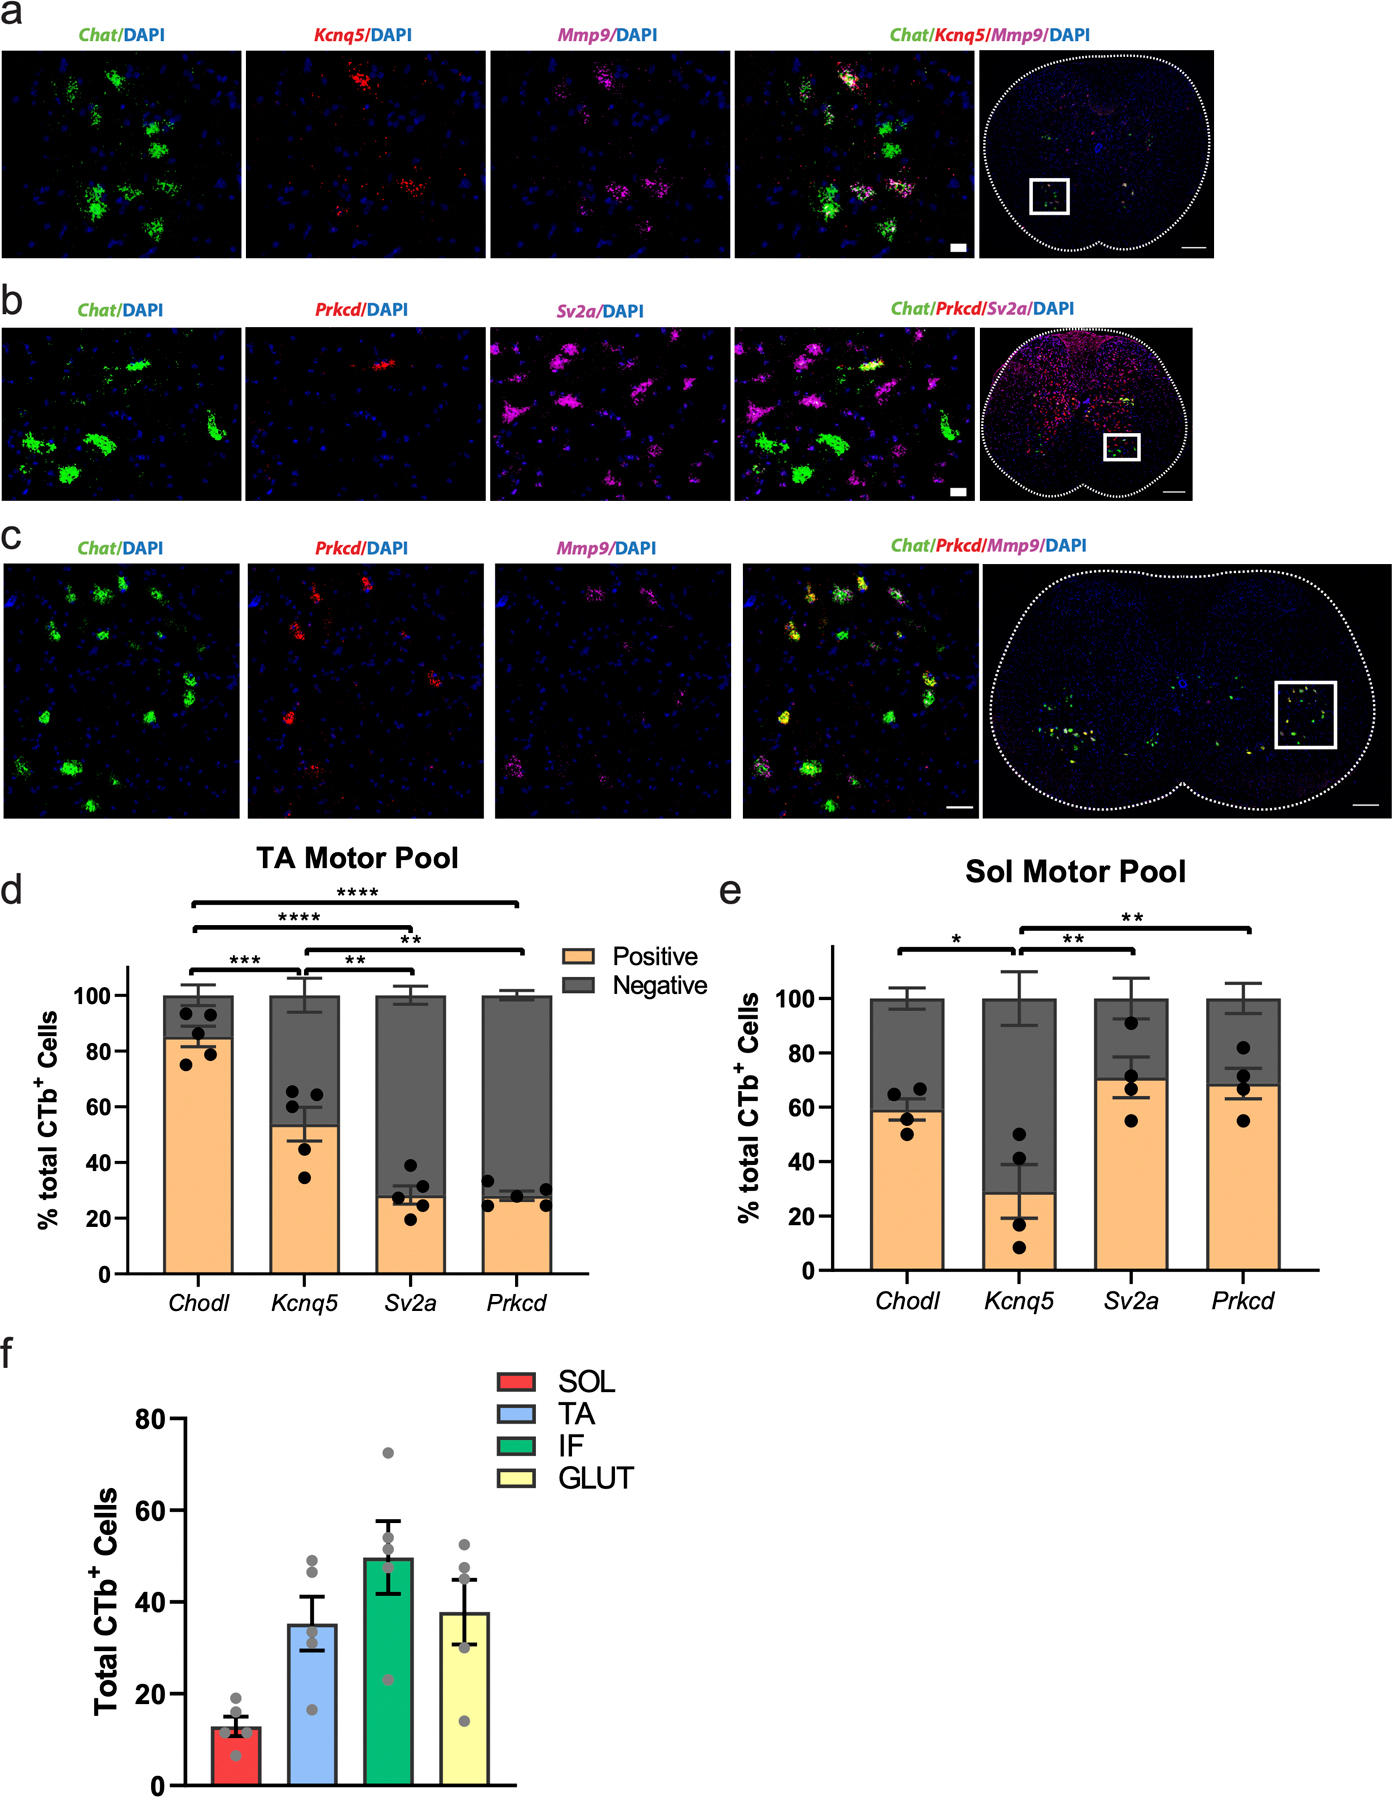
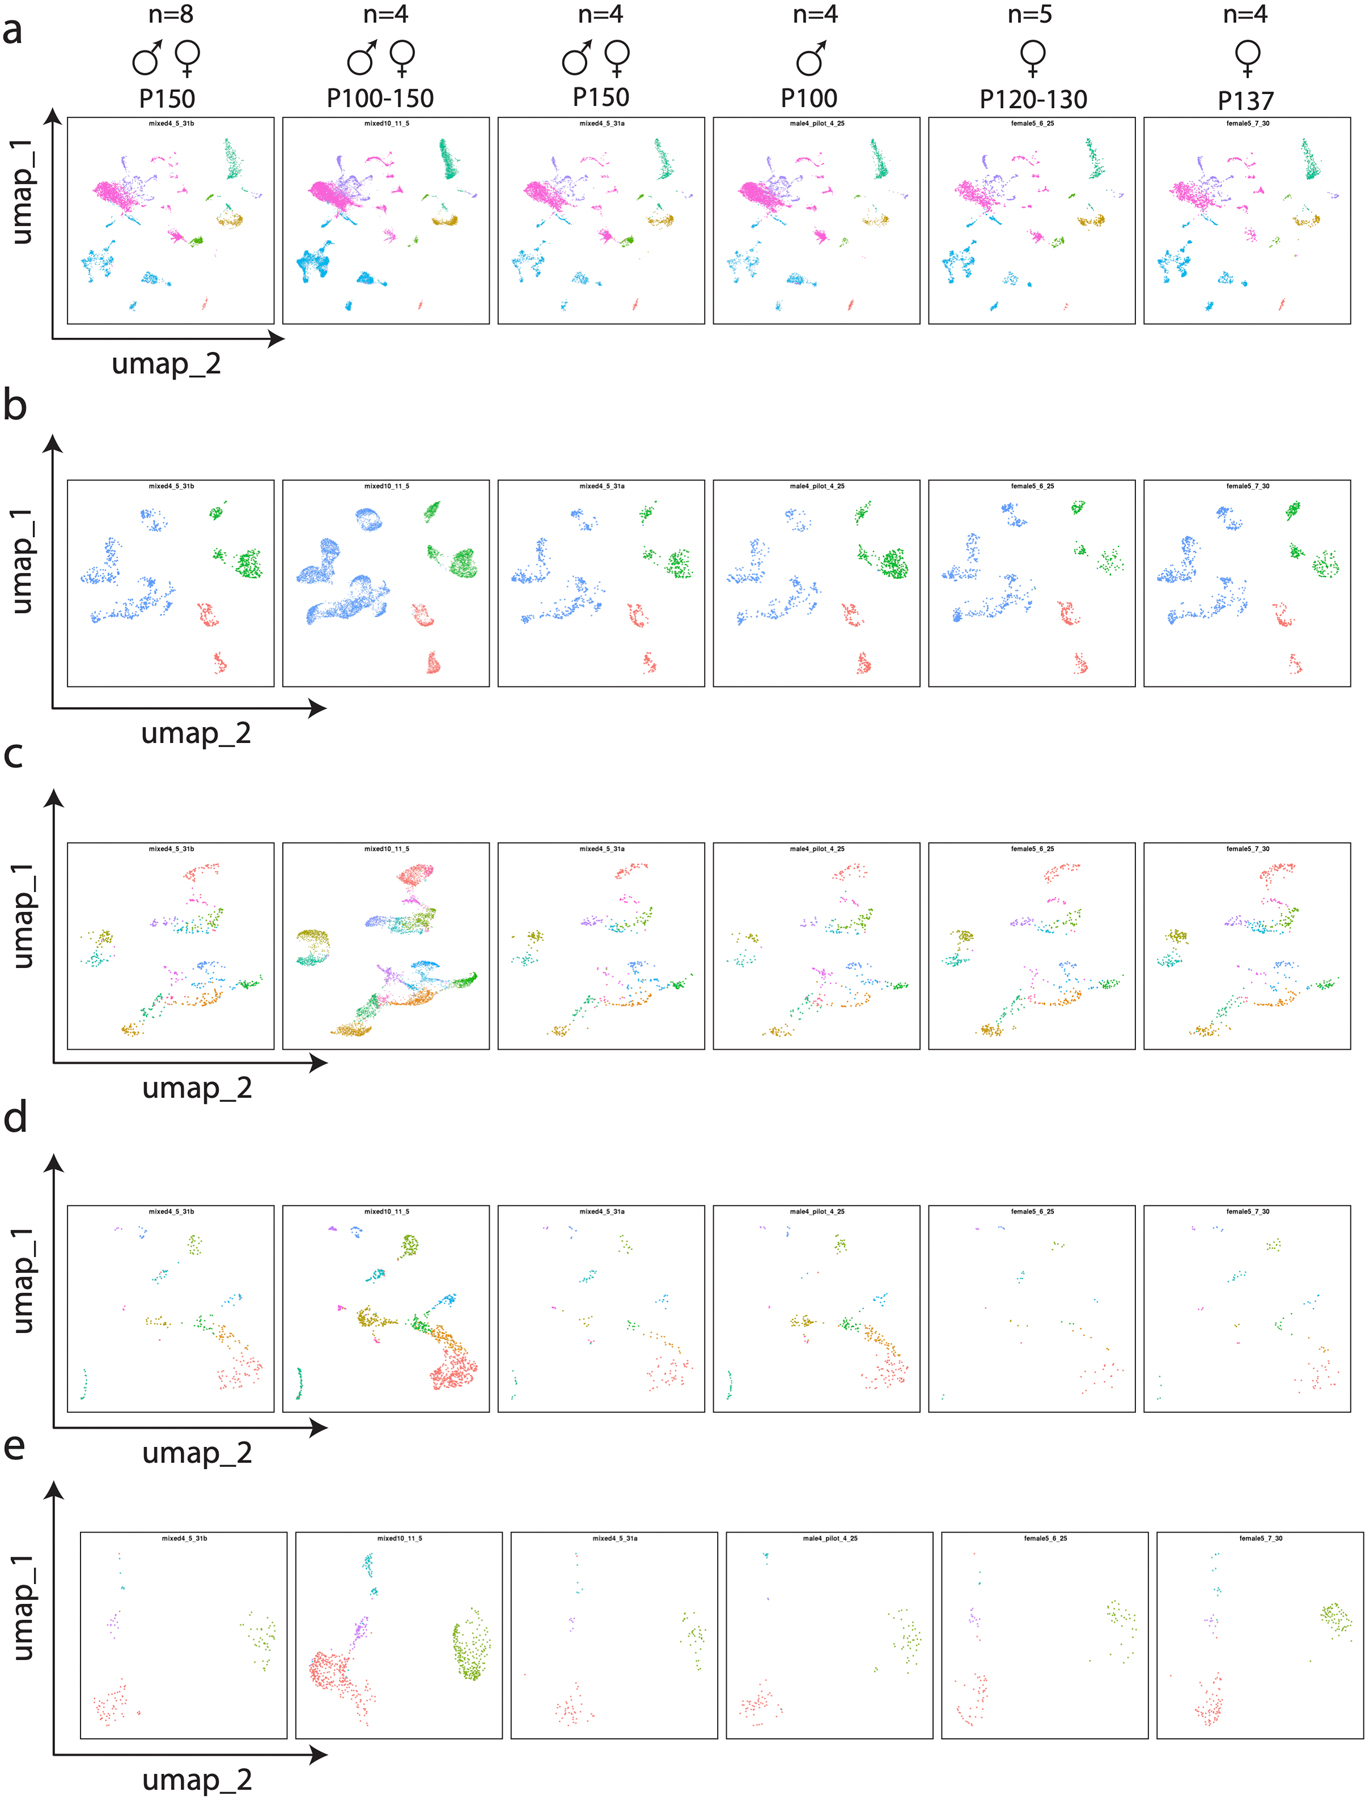
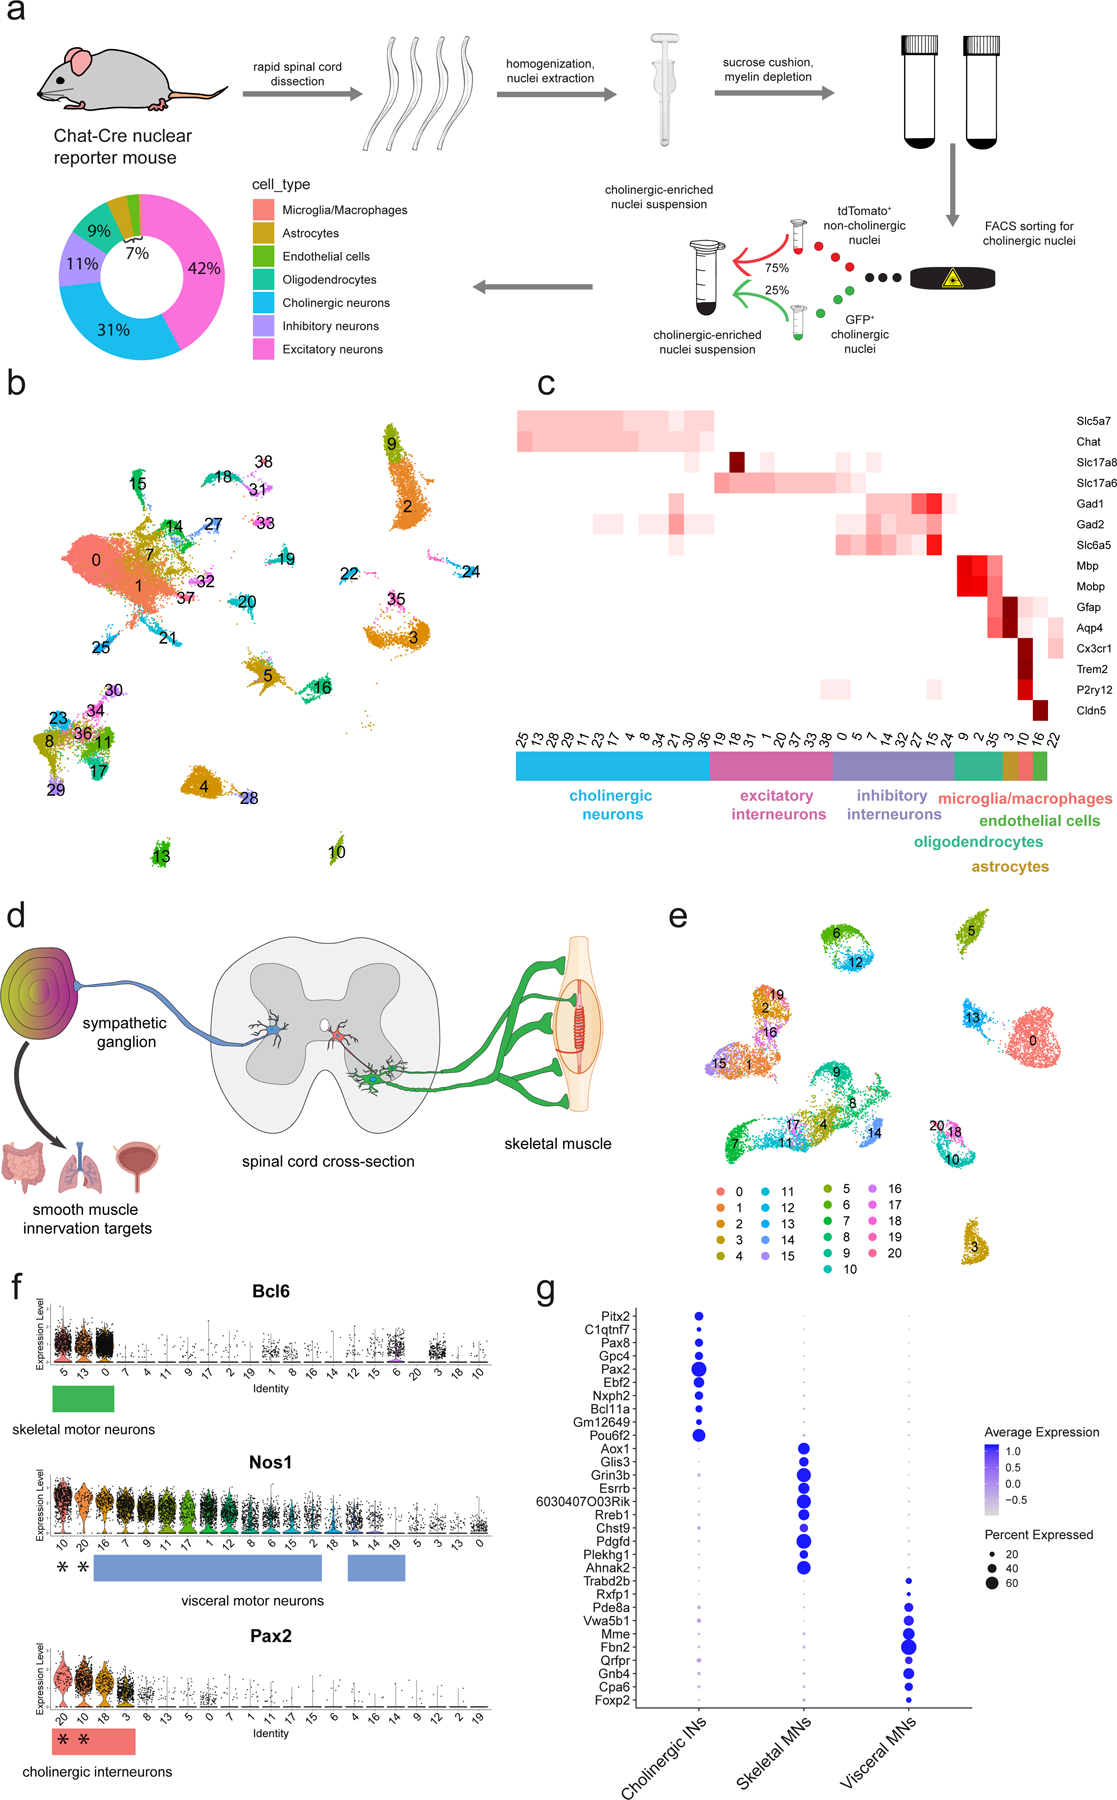
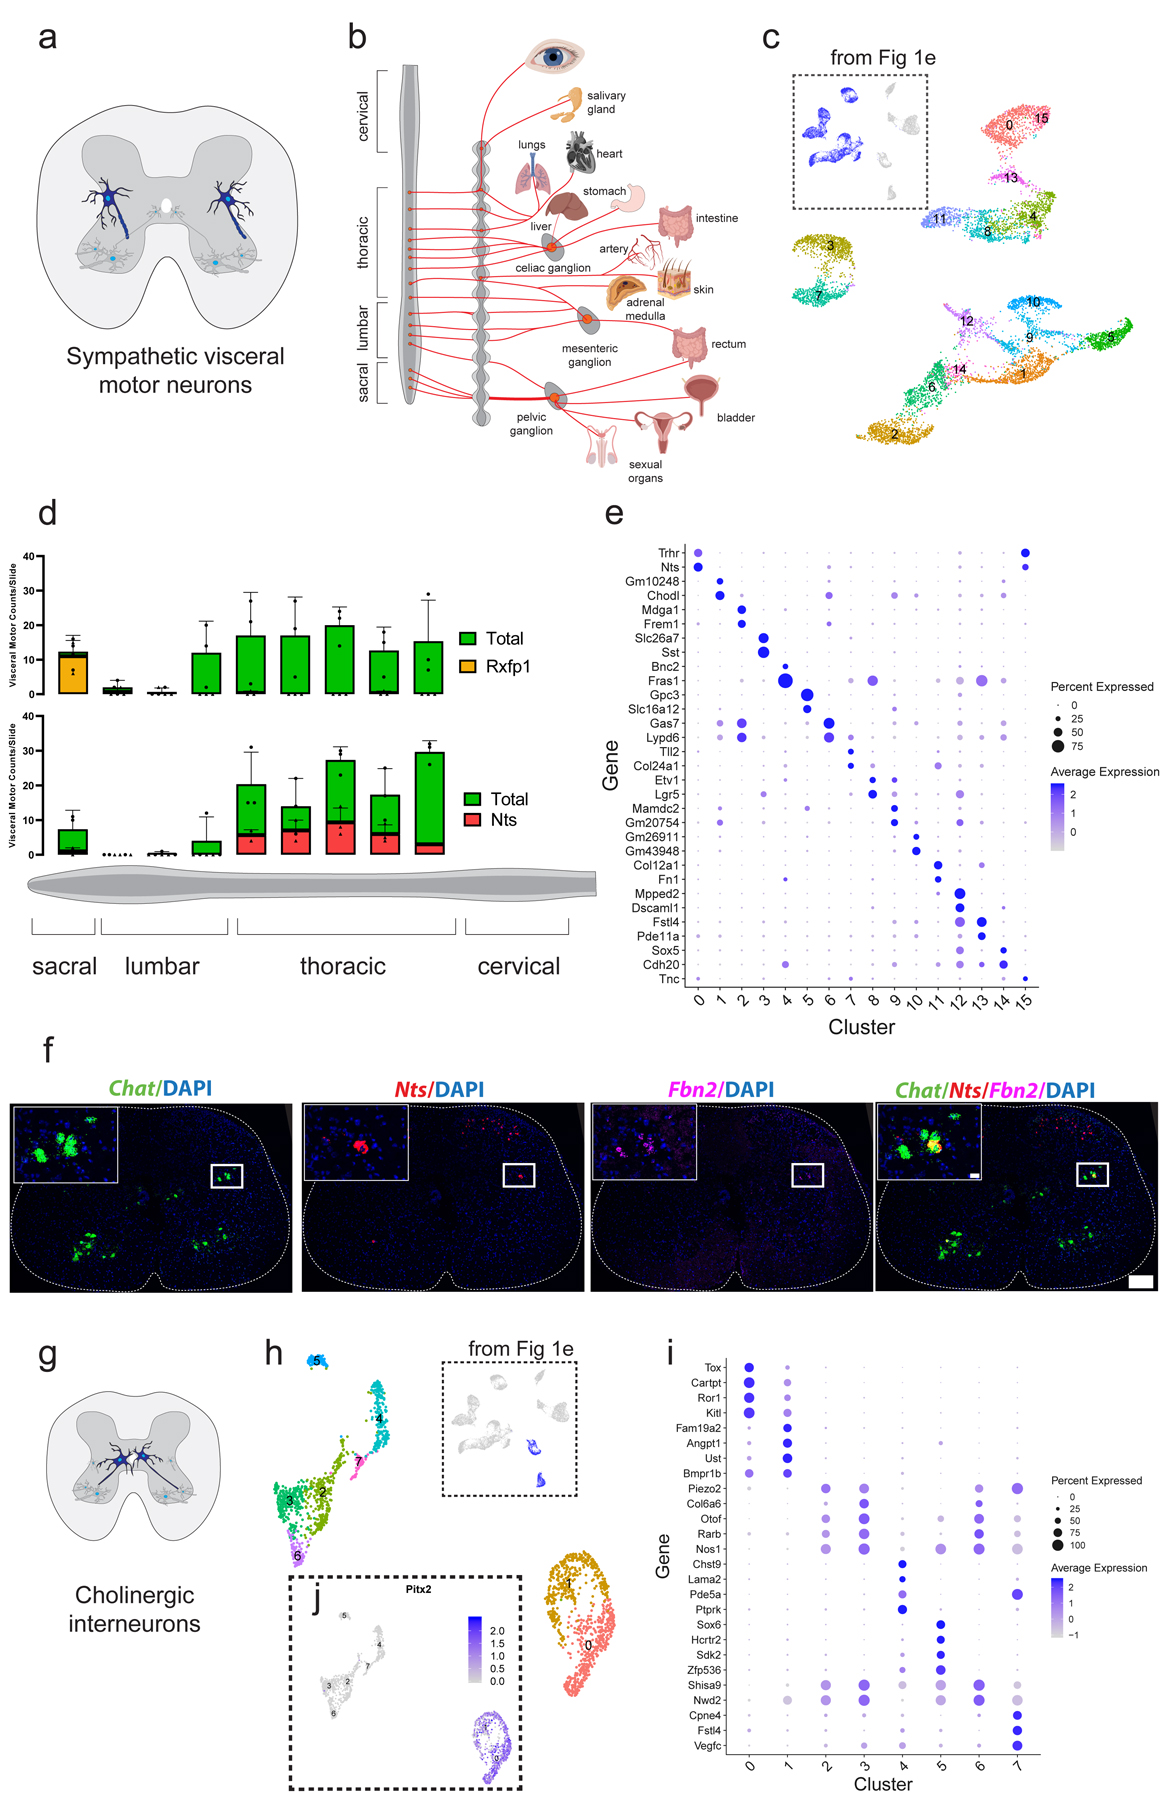
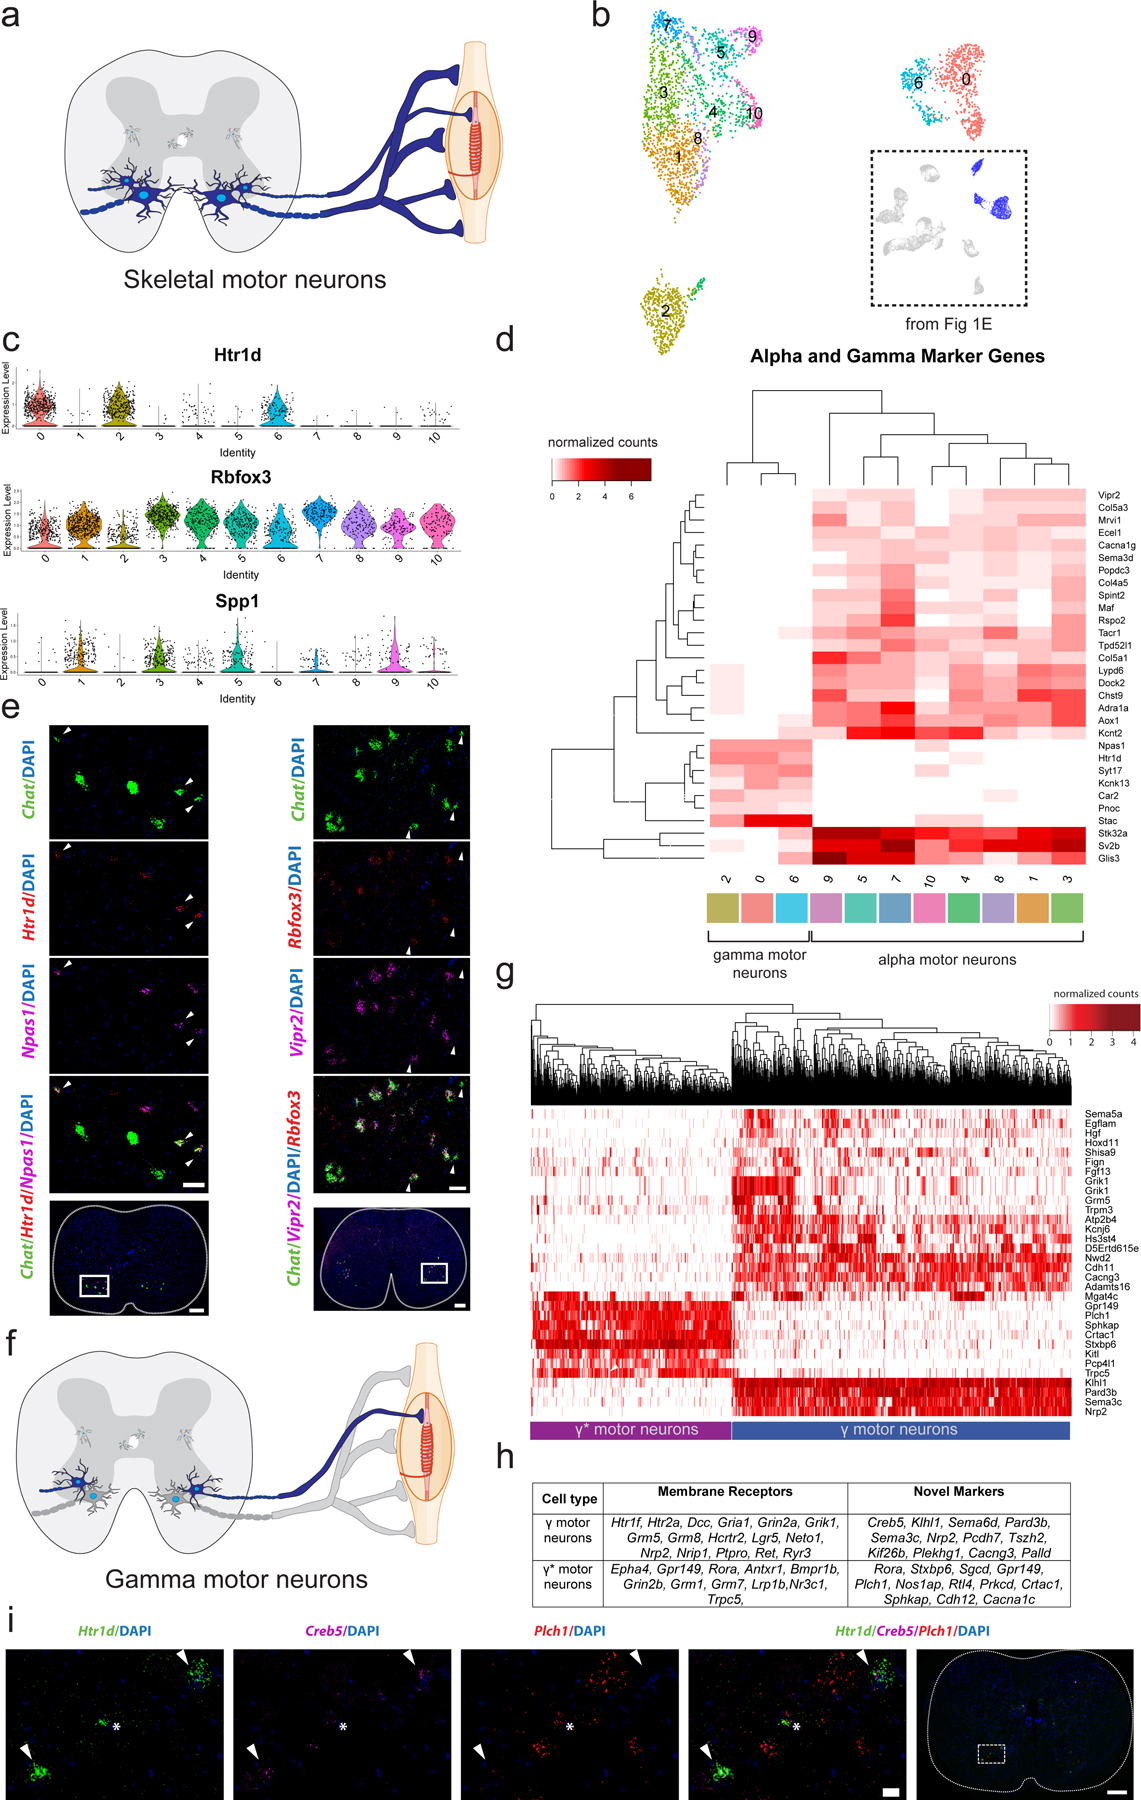
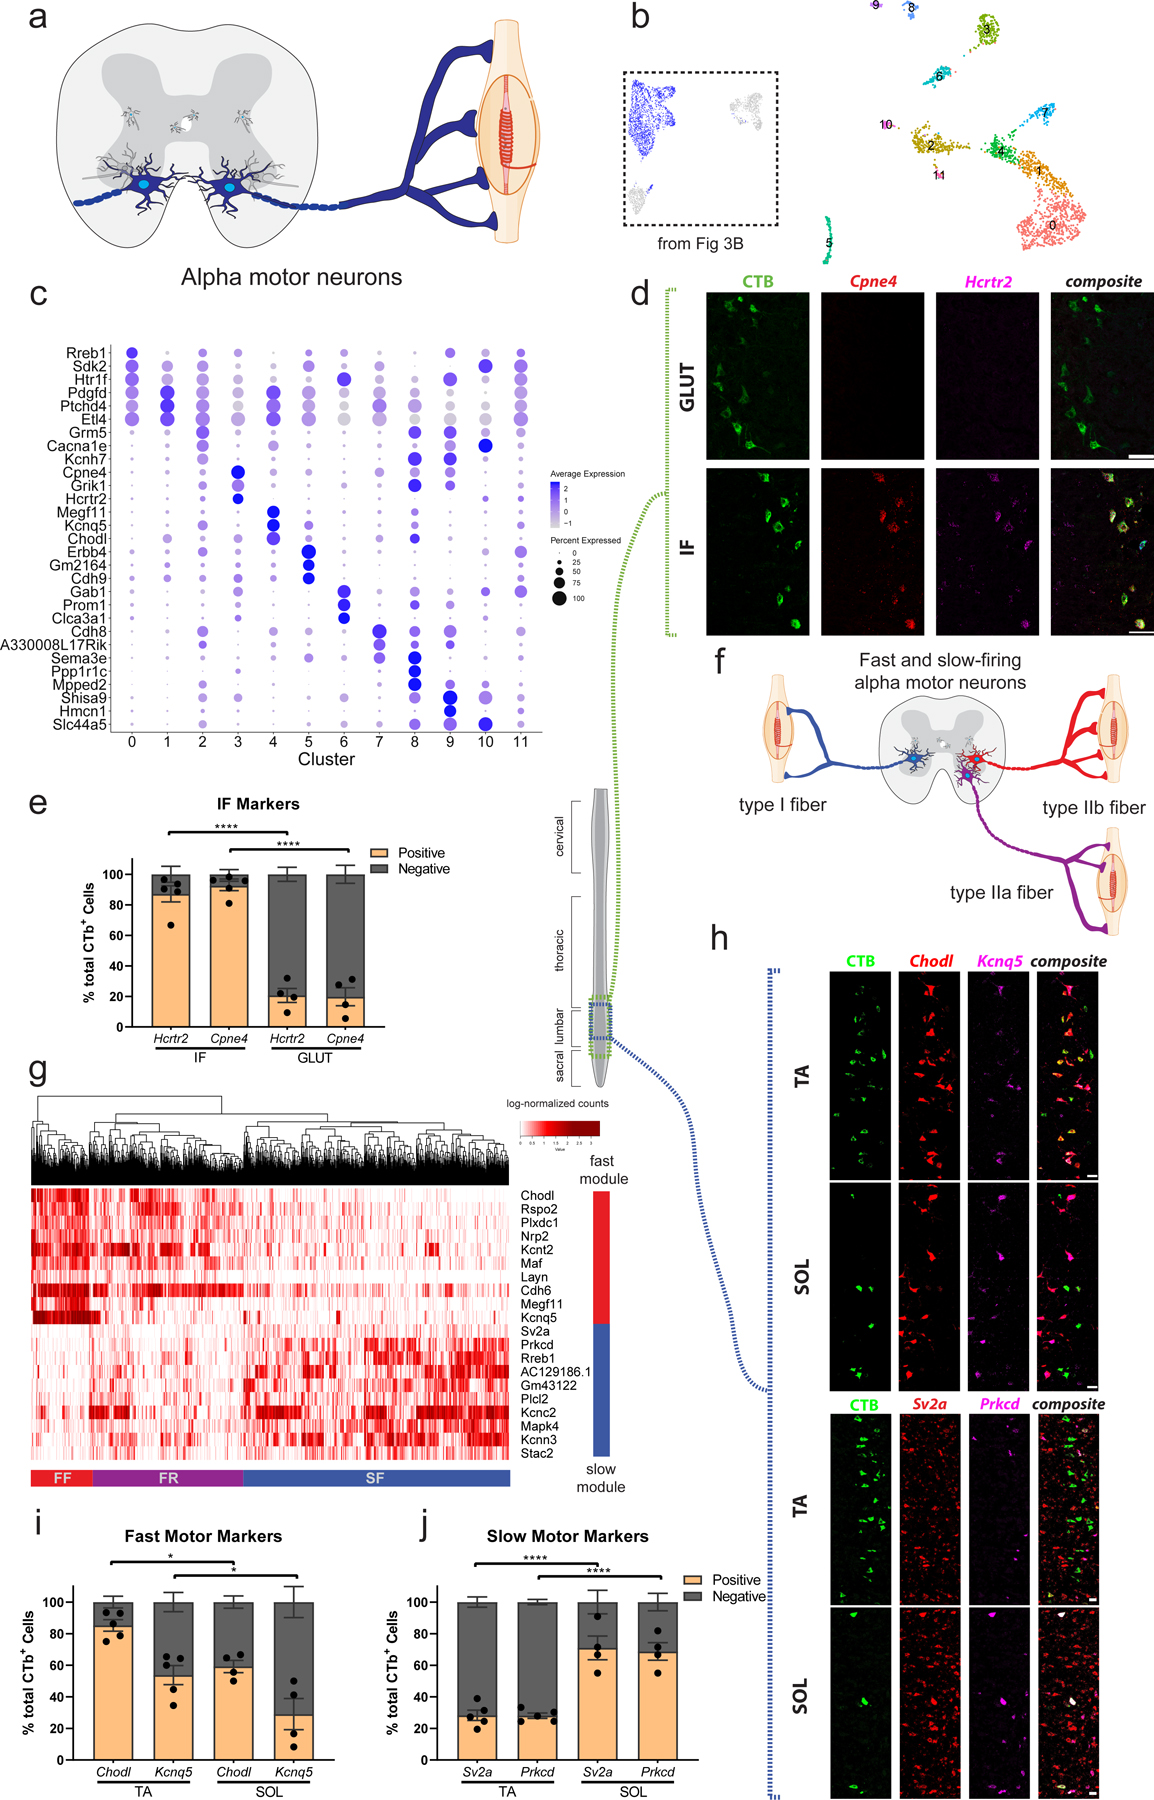
The spinal cord is a fascinating structure that is responsible for coordinating movement in vertebrates. Spinal motor neurons control muscle activity by transmitting signals from the spinal cord to diverse peripheral targets. In this study, we profiled 43,890 single-nucleus transcriptomes from the adult mouse spinal cord using fluorescence-activated nuclei sorting to enrich for motor neuron nuclei. We identified 16 sympathetic motor neuron clusters, which are distinguishable by spatial localization and expression of neuromodulatory signaling genes. We found surprising skeletal motor neuron heterogeneity in the adult spinal cord, including transcriptional differences that correlate with electrophysiologically and spatially distinct motor pools. We also provide evidence for a novel transcriptional subpopulation of skeletal motor neuron (γ*). Collectively, these data provide a single-cell transcriptional atlas ( http://spinalcordatlas.org ) for investigating the organizing molecular logic of adult motor neuron diversity, as well as the cellular and molecular basis of motor neuron function in health and disease.


Conflict of interest statement

Competing Interests

A.D.G. has served as a consultant for Aquinnah Pharmaceuticals, Prevail Therapeutics and Third Rock Ventures and is a scientific founder of Maze Therapeutics. W.J.G. has affiliations with 10x Genomics (consultant), Guardant Health (consultant) and Protillion Biosciences (co-founder and consultant). J.A.B. has served as a consultant for Maze Therapeutics.

Figures

Extended Data Fig. 1
Extended Data Fig. 1. Single-nucleus transcriptional analysis of the adult mouse spinal cord reveals canonical cell types.
a, Canonical cell class labels, visualized on UMAP. b, Average log-normalized marker gene expression across canonical cell classes. c–d, Representative in situ hybridization against Chat/Nos1 in transverse sacral (c) and thoracic (d) spinal cord hemi-sections. n=3 biologically independent animals. e-f, Average log-normalized expression of Zeb2 (e) and Fbn2 (f) across all cholinergic clusters (labeled), overlaid on UMAP. Dotted line surrounds clusters corresponding to visceral motor neurons. g, Representative in situ hybridization against Chat/Fbn2 in transverse thoracic spinal cord hemi-section. n=3 biologically independent animals. Scale bars=200 µm (c–d) and 100 µm (g). LAC=lateral autonomic column (c,d), VH=ventral horn (c,d).
Extended Data Fig. 2
Extended Data Fig. 2. Novel markers of skeletal motor neurons confirmed by Allen Spinal Cord Atlas in situ hybridizations
a-d, Transverse schematic illustrating expected positions of skeletal motor neurons in ventral horn (VH, green) in lumbar spinal cord. Second row—corresponding in situ hybridization against Tns1 (a), Bcl6 (b), Syn1 (c), and Actb (d). Third row—expression mask shows relative enrichment of Tns1 and Bcl6 in small and large cell bodies in the VH.
Extended Data Fig. 3
Extended Data Fig. 3. Visceral motor neuron populations express selective repertoires of neuropeptides and are spatially distinct
a, Estimated relative density of visceral motor neurons along the rostral-caudal axis of the spinal cord based on Allen Spinal Cord Atlas. Density functions are combined density estimates of marker genes for each cluster (see Methods). Clusters were grouped according to shape of density function, with clusters 3,7, and 10 clearly enriched in the sacral spinal cord. b, Validation of visceral spatial modeling from (a) via high-resolution in situ hybridization for Chat and visceral cluster markers (Piezo2, Cdh8, Creb5, Cpne4, Fbn2). Plots show number of motor neurons counted in the autonomic column, added across three counted slides in each region. Individual data points for total visceral motor neurons shown with filled circles, while marker gene-positive cell numbers shown with filled triangles. n=2 (Piezo2, Cdh8, Creb5, Cpne4) or 5 (Fbn2) biologically independent replicates. Error bars are SEM. c, Average log-normalized expression of Rxfp1 and Nts across all visceral motor neuron clusters (labeled), overlaid on UMAP. d, Representative in situ hybridization against Chat/Fbn2/Rxfp1 in transverse sacral spinal cord shows coexpression in the autonomic column but not in the ventral horn (VH). n=3 biologically independent animals. Scale bar=100 µm. e, Average log-normalized expression of Adra2a across all visceral clusters (labeled) shows that sporadic expression exists across populations, overlaid on UMAP. f, Representative in situ hybridization against Chat/Piezo2/Cdh8 in cholinergic cells around the central canal (CC). Scale bar=50 µm. n=2 biologically independent animals. g, Average log-normalized expression of Gldn across all cells in spinal cord shows clear enrichment in partition cell cluster (arrowhead), overlaid on UMAP. h, Average log-normalized expression of Nrxn3 across cholinergic interneurons shows that Nrxn3 expression is limited to half of partition cells (arrowhead), overlaid on UMAP.
Extended Data Fig. 4
Extended Data Fig. 4. Vipr2 and Npas1 are novel, robust, and specific markers of α and γ motor neurons in the spinal cord
a, Average expression of Vipr2 and Npas1 across all spinal cord cell populations (labeled), overlaid on UMAP. Arrow points to α and γ motor neuron clusters, respectively. b, Representative in situ hybridization against Chat/Rbfox3/Vipr2 in transverse spinal cord shows coexpression in the ventral horn (VH). n=4 biologically independent animals. Scale bar=100 µm. c, Representative in situ hybridization against Chat/Htr1d/Vipr2 in transverse spinal cord shows mutual exclusion. Scale bar=50 µm (inset) and 200 µm (overview). n=4 biologically independent animals. d, Representative in situ hybridization against Chat/Npas1/Rbfox3 in transverse spinal cord shows mutual exclusion of Rbfox3 and Npas1 in Chat+ cells. n=5 biologically independent animals. Scale bar=20 µm (inset) and 200 µm (overview). e, Representative in situ hybridization against Chat/Npas1/Vipr2 in transverse spinal cord shows mutual exclusion of novel markers Vipr2 and Npas1 in Chat+ cells. n=4 biologically independent animals. Scale bar=20 µm (inset) and 200 µm (overview).
Extended Data Fig. 5
Extended Data Fig. 5. Discovery of a fundamental transcriptional bifurcation among γ motor neurons
a, UMAP with 3 subclustered γ motor neurons populations. b, Novel marker gene expression across γ motor neuron subpopulations. Dot size is proportional to the percent of each cluster expressing the marker gene, while blue color intensity is correlated with expression level. c, Average log-normalized expression of genes enriched in γ* motor neurons over γ overlaid on UMAP. α, γ, and γ* populations are labeled. d, Average log-normalized expression of genes enriched in γ motor neurons over γ* overlaid on UMAP. α, γ, and γ* populations are labeled. e-h, Average expression of novel γ markers Stxbp6 (e) and Plch1 (f), as well as novel γ* markers Pard3b (g) and Creb5 (h) by cluster. i, Representative in situ hybridization against Htr1d/Creb5/Stxbp6 in transverse spinal cord shows mutual exclusion of novel markers Creb5 and Stxbp6 in Htr1d+ cells. n=4 biologically independent animals. Scale bar=20 µm (inset) and 200 µm (overview). j, Representative in situ hybridization against Htr1d/Pard3b/Stxbp6 in transverse spinal cord shows mutual exclusion of novel markers Pard3b and Stxbp6 in Htr1d+ cells. Arrowheads label canonical γ motor neurons and *labels γ*. n=5 biologically independent animals. Scale bar=20 µm (inset) and 100 µm (overview). Differentially expressed genes determined by Wilcoxon rank sum test implementation in Seurat and adjusted for multiple comparisons (Bonferroni method) (p_adj<0.01, log2-fold change >0.5).
Extended Data Fig. 6
Extended Data Fig. 6. Retrograde CTB labeling of motor pools connects transcriptional subpopulations with motor pools
a, Proportion of CTB-labeled cells from GLUT and IF that are labeled with Cdh8 and Sema3e. The GLUT has a significantly larger proportion of Cdh8+ and Sema3e+ cells than the IF. n=5 biologically independent animals. b, Lower power view of in situ hybridization against Prkcd/Sv2a, and Kcnq5/Chodl (insets=Fig. 4h) in longitudinal sections demonstrates the specificity of CTB injections into the Soleus (SOL) and Tibialis anterior (TA). n=5 (TA) and 4 (SOL) biologically independent animals. One-way ANOVA with post-hoc Sidak multiple comparison test between same-gene conditions. Adjusted p-values=0.0212 (Cdh8) and 0.0499 (Sema3e). c, Expression of FF and SF gene modules overlaid on UMAP of all α motor neurons. d, Average log-normalized canonical marker expression of Chodl (fast-firing) and Sv2a (slow-firing). Scale bars = 250 µm. e, Proportion of Prkcd+ cells positive for Sv2a (left) and proportion of Chodl+ cells that are positive for Kcnq5 (right). n=3 biologically independent animals. f, Representative in situ hybridization showing Kcnq5 is expressed in a subset of Chodl+ cells. n=4 biologically independent animals. Scale bar=50 µm inset and 200 µm overview. *=p value<0.05, **=p value <0.01, ***=p value<0.001, ****=p value<0.0001. Error bars are SEM.
Extended Data Fig. 7
Extended Data Fig. 7. Retrograde CTB labeling of motor pools enables the identification of transcriptionally distinct classes of fast and slow-firing motor neurons in the adult spinal cord
a, Representative in situ hybridization against Chat/Mmp9/Kcnq5 in transverse spinal cord shows that Kcnq5 is expressed in a subset of Mmp9+ fast-firing motor neurons. n=4 biologically independent animals. Scale bar=20 µm inset and 200 µm overview. b, Representative in situ hybridization against Chat/Sv2a/Prkcd in transverse spinal cord shows that Prkcd is expressed in almost every Chat+/Sv2a+ slow-firing motor neuron. n=2 biologically independent animals. Scale bar=20 µm inset and 200 µm overview. c, Representative in situ hybridization against Chat/Mmp9/Prkcd in transverse spinal cord shows that Prkcd is excluded from almost every Chat+/Mmp9+ fast-firing motor neuron. n=4 biologically independent animals. Scale bar=30 µm inset and 200 µm overview. d-e, Proportion of cells expressing fast and slow-firing markers in the CTB-labeled TA (d) and SOL (e) motor pools. There is a significantly higher proportion of cells expressing both known and novel fast-firing markers in TA than SOL (d), and a higher proportion of cells expressing both known and novel slow-firing markers in SOL than TA. Adjusted p-value=0.0456 (Chodl+>Kcnq5+). f, Total number of CTB-positive cells labeled across biologically independent animals. One-way ANOVA with post-hoc Tukey multiple comparison test among all conditions. n=4–5 biologically independent animals (d-f). *=p value<0.05, **=p value <0.01, ***=p value<0.001, ****=p value<0.0001. Error bars are SEM.
Extended Data Fig. 8
Extended Data Fig. 8. Cross-replicate variability in single-nucleus transcriptomic experiments
a–e, Each spinal cord sequencing replicate, plotted side-by-side and visualized by UMAP. Note that we observe minimal batch-to-batch variability along sex, age, or replicate number axes in terms of cluster identification and overall shape of the dimensionality reduced data. This does not preclude sex or age-related transcriptional changes but demonstrates that they do not fundamentally alter the transcriptomic classes that we focus on in the manuscript.
Fig. 1:
Fig. 1:. Motor neuron enrichment and single-nucleus transcriptional analysis of the adult mouse spinal cord uncovers novel skeletal and visceral motor neuron markers.
a, Workflow for cholinergic nucleus enrichment and single-nucleus RNA sequencing (snRNAseq)—GFP+ and TdTomato+ cells were mixed at a ratio between 1:3 and 2:3. Plot shows the distribution of canonical cell types with their proportional representation. FACS was used to select appropriate proportion of singlet, DAPI+/GFP+/tdTomato− nuclei. b, UMAP of clustered snRNAseq data from 43,890 transcriptomes. c, Average expression levels per cluster for marker genes of each canonical cell population. Cell type labels based on expression patterns of marker genes. d, Schematic depicting expected cholinergic cell types in the spinal cord. Visceral motor neurons (blue) innervate sympathetic ganglia, skeletal motor neurons (green) directly innervate muscle fibers, and cholinergic interneurons (red) innervate motor neurons and other cells. e, UMAP with graph-based clustering of all cholinergic neurons reveals 21 clusters. f, Ranked expression of known marker genes Pax2 (interneurons) and Nos1 (visceral motor neurons), as well as novel marker gene Anxa4 (skeletal motor neurons) by cluster. Cell labels were assigned hierarchically by expression levels of Pax2, Nos1, and Bcl6 and are reported below each plot. Cholinergic interneuron clusters that also express Nos1 are denoted with a (*). g, Enriched differentially expressed genes for cholinergic interneurons, skeletal motor neurons, and visceral motor neurons. Dot size is proportional to the percent of each cluster expressing the marker gene, while blue color intensity is correlated with expression level. All expression values were log-normalized in Seurat.
Fig. 2:
Fig. 2:. Single-nucleus transcriptomics reveals immense diversity within the autonomic nervous system and partition cells.
a, Schematic illustrating the position of sympathetic visceral motor neurons (blue) in the lateral autonomic column of the spinal cord. b, Diagram adapted from Espinosa-Medina 2016 showing innervation targets of the sympathetic nervous system. c, UMAP with 16 visceral motor neuron subclusters. Inset shows all cells from Fig. 1e that were subclustered. d, Frequency of visceral motor neuron subpopulations (Rxfp1+ and Nts+) along the rostral-caudal axis of the spinal cord. Individual data points for total visceral motor neurons shown with filled circles, while marker gene-positive cell numbers shown with filled triangles. n=3 biologically independent animals. e, Novel marker genes for each cluster of visceral motor neurons. f, Representative in situ hybridization of Chat, Nts, and Fbn2 demonstrating Nts expression in visceral motor neurons. 200 µm scale bar in overview and 20 µm in inset. n=3 biologically independent animals. g, Schematic showing cholinergic interneuron innervation of skeletal motor neurons as demonstrated previously. h, UMAP with graph-based clustering labels for cholinergic interneurons. Inset shows all cells from Fig. 1e that were subclustered. i, Novel marker genes for cholinergic interneuron clusters identified. j, Expression of Pitx2 in cholinergic interneuron populations, overlaid on UMAP projection from (h). Cluster 0 and 1 are Pitx2-positive. All expression values were log-normalized in Seurat. Dot size is proportional to the percent of each cluster expressing the marker gene, while blue color intensity is correlated with expression level in (e,i).
Fig. 3:
Fig. 3:. Transcriptional differences between alpha (α) and gamma (γ) motor neurons.
a, Transverse schematic illustrating position of skeletal motor neurons (blue) in the ventral horn of the spinal cord. Gamma motor neurons are small and innervate intrafusal muscle fibers. α motor neurons are large and innervate extrafusal fibers. b, UMAP with 11 subclustered skeletal motor neurons populations. Inset shows all cells from Fig 1e that were subclustered. c, Average expression of known γ marker Htr1d and α markers Rbfox3 and Spp1 by cluster. d, Heatmap with average expression by cluster of differentially expressed genes in α and γ populations. Differentially expressed genes between γ and α populations. e, Representative in situ hybridization against Chat/Htr1d/Npas1 and Chat/Rbfox3/Vipr2 in transverse lumbar spinal cord sections. Arrowheads indicate γ motor neurons in both images. Scale bars are 200 µm (overview) and 50 µm (inset). n=4 biologically independent animals. f, Transverse schematic illustrating γ motor neurons (blue) innervating intrafusal muscle fibers. Inset shows all cells from Fig 3b that were subsequently subclustered. g, Heatmap showing fundamental subdivision between γ and γ* motor neurons, hierarchically clustered by expression of highly variable genes among all classes of γ motor neurons (see Methods). h, Differentially expressed membrane receptors between two main populations of γ motor neurons, as well as novel markers that delineate them. i, Representative in situ hybridization against Htr1d/Plch1/Creb5 in transverse lumbar spinal cord. Plch1 and Creb5 are expressed reciprocally in Htr1d+ cells and represent γ and γ* motor neurons. Arrow heads demarcate Creb5+ γ motor neurons and * indicates γ* motor neurons. n=5 biologically independent animals. All differential expression calculated using Wilcoxon rank sum test and adjusted for multiple comparisons (Bonferroni method) (p_adj < 0.01, log2fc>0.5). All expression values were log-normalized in Seurat. Scale bars=50 µm.
Fig. 4:
Fig. 4:. Alpha (α) motor neuron pool, position, and electrophysiological subtype reflect transcriptional differences.
a, Transverse schematic shows α motor neurons (blue) innervating extrafusal muscle fibers. b, UMAP with 12 subclustered α motor neuron populations. Inset shows all α motor neurons from Fig. 3b that were subclustered. c, Novel marker gene expression across α motor neuron subpopulations. Dot size is proportional to the percent of each cluster expressing the marker gene, while blue color intensity is correlated with expression level. d, Representative in situ hybridization against novel (Hcrtr2) and known (Cpne4) intrinsic-foot (IF) motor pool markers in longitudinal sections, overlaid with CTb labeled cells that innervate the gluteus (GLUT) and IF. n=5 (IF) and 4 (GLUT) biologically independent animals. e, Proportion of CTB-labeled cells from GLUT and IF that are labeled with Hcrtr2 and Cpne4 shows novel and known markers selectively label the IF motor pool. n=5 (IF) and 4 (GLUT) biologically independent animals. f, Schematic illustrating slow-firing (SF, blue), fast fatigue-resistant (FR, purple) and fast fatigable (FF, red) α motor neuron populations innervating type I, IIa, and IIb fibers respectively. g, Heatmap showing all α motor neurons hierarchically clustered and colored by expression of differentially expressed genes between fast (Chodl+) and slow (Sv2a+) α motor neurons shows three cell populations corresponding to SF, FR, and FF motor neurons. Red and blue bars show gene modules enriched in fast- and slow-firing α motor neurons, respectively. h, Representative in situ hybridization in longitudinal sections against novel (Kcnq5, Prkcd) and known (Chodl, Sv2a) fast and slow-firing motor neuron markers, respectively. Images show CTb labeled cells that innervate a muscle with predominantly fast-twitch fibers (TA) and slow-twitch fibers (SOL). n=5 (TA) and 4 (SOL) biologically independent animals. i, Proportion of CTB-labeled cells from TA and SOL that are labeled with Chodl and Kcnq5. The TA has a significantly larger proportion of Chodl+ and Kcnq5+ cells than the SOL, though Kcnq5+ cells are significantly less frequently found in both populations. n=5 (TA) and 4 (SOL) biologically independent animals. Adjusted p-values=0.0197 (Chodl), 0.0262 (Kcnq5). j, Proportion of CTB-labeled cells from TA and SOL that are labeled with Sv2a and Prkcd. The SOL pool has a significantly larger proportion of Prkcd+ and Sv2a+ cells than the TA. n=5 (TA) and 4 (SOL) biologically independent animals. All differential expression calculated using Wilcoxon rank sum test and adjusted for multiple comparisons (Bonferroni method) (p_adj < 0.01, log2fc>0.5). All expression values were log-normalized in Seurat. Scale bars=50µm (h), 75 µm (all others). One-way ANOVA with post-hoc Sidak multiple comparison test between same-gene conditions. *=p value<0.05, **=p value <0.01, ***=p value<0.001, ****=p value<0.0001. Error bars are SEM.

References

    1. Haase G et al. GDNF Acts through PEA3 to Regulate Cell Body Positioning and Muscle Innervation of Specific Motor Neuron Pools. Neuron 35, 893–905 (2002). - PubMed
    1. Song M-R & Pfaff SL Hox Genes: The Instructors Working at Motor Pools. Cell 123, 363–365 (2005). - PubMed
    1. Arber S Motor Circuits in Action: Specification, Connectivity, and Function. Neuron 74, 975–989 (2012). - PubMed
    1. Dasen JS, Tice BC, Brenner-Morton S & Jessell TM A Hox Regulatory Network Establishes Motor Neuron Pool Identity and Target-Muscle Connectivity. Cell 123, 477–491 (2005). - PubMed
    1. Kaplan A et al. Neuronal matrix Metalloproteinase-9 is a determinant of selective Neurodegeneration. Neuron 81, 333–348 (2014). - PMC - PubMed

Publication types