. 2021 Mar;18(3):283-292.
doi: 10.1038/s41592-021-01060-3. Epub 2021 Feb 15.

Joint profiling of histone modifications and transcriptome in single cells from mouse brain

Affiliations

Joint profiling of histone modifications and transcriptome in single cells from mouse brain

Chenxu Zhu et al. Nat Methods. 2021 Mar.

Abstract

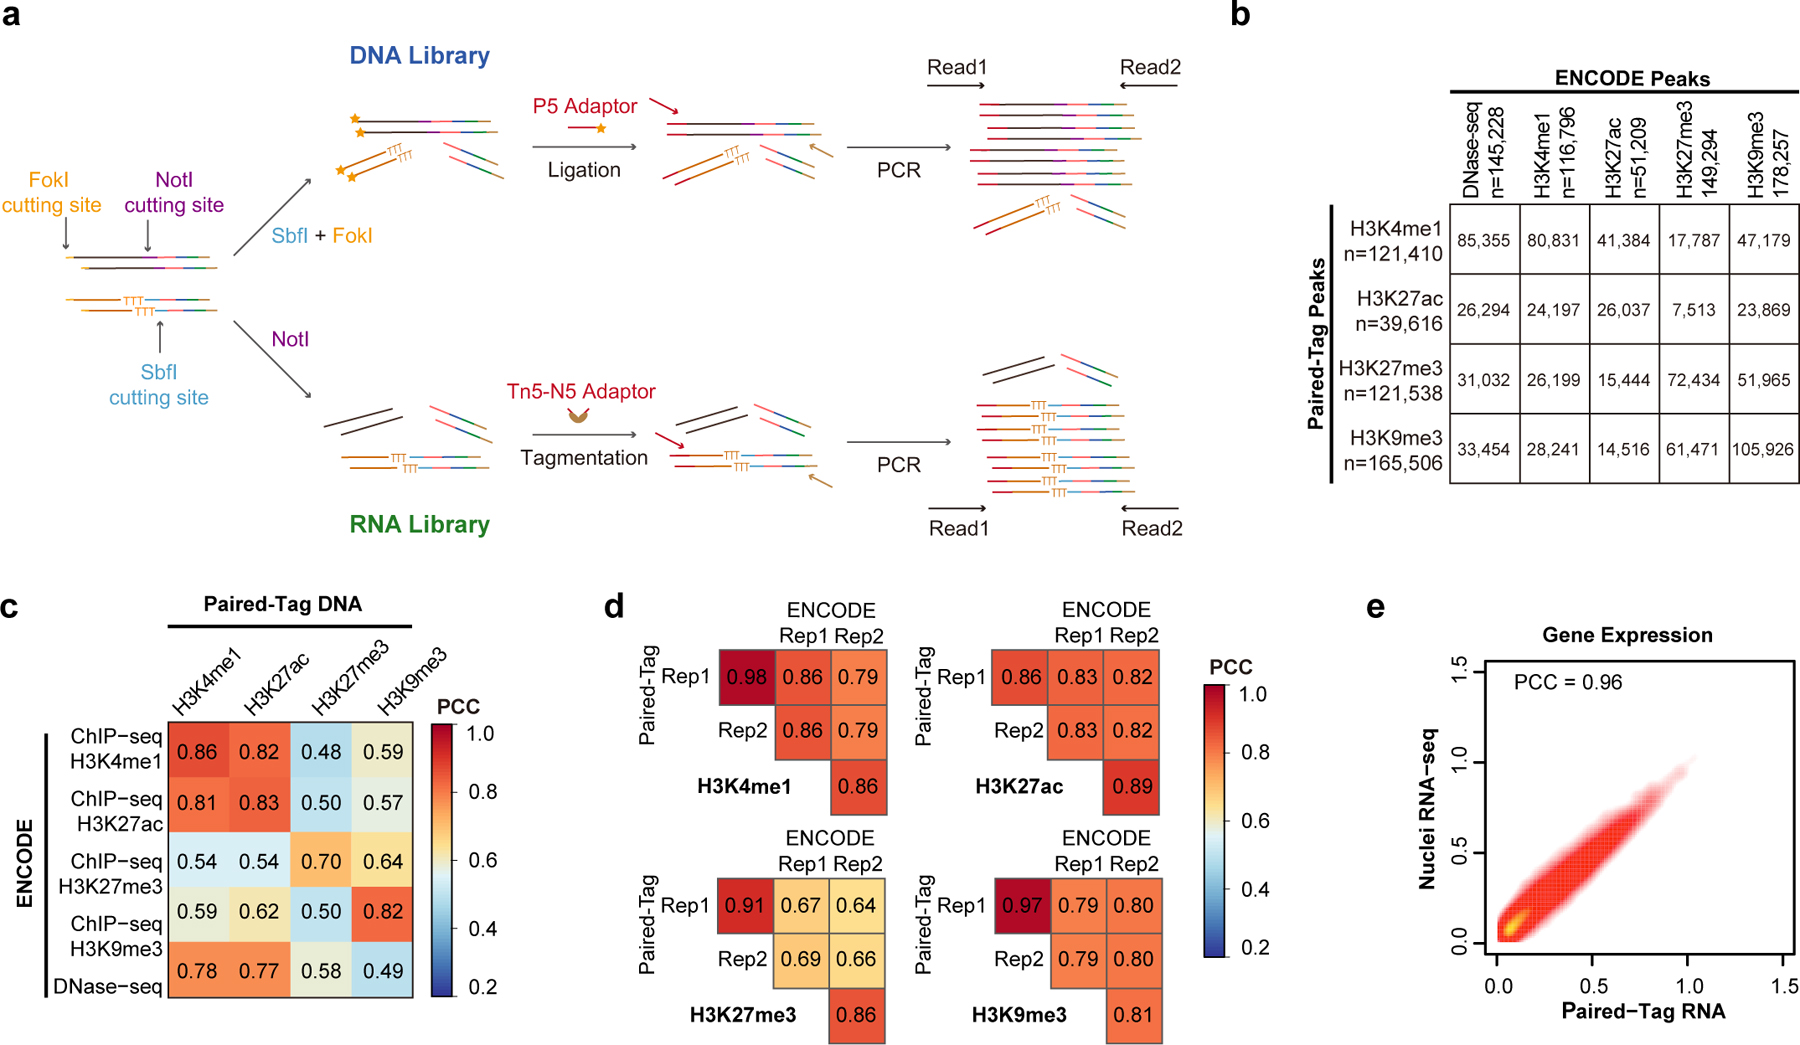
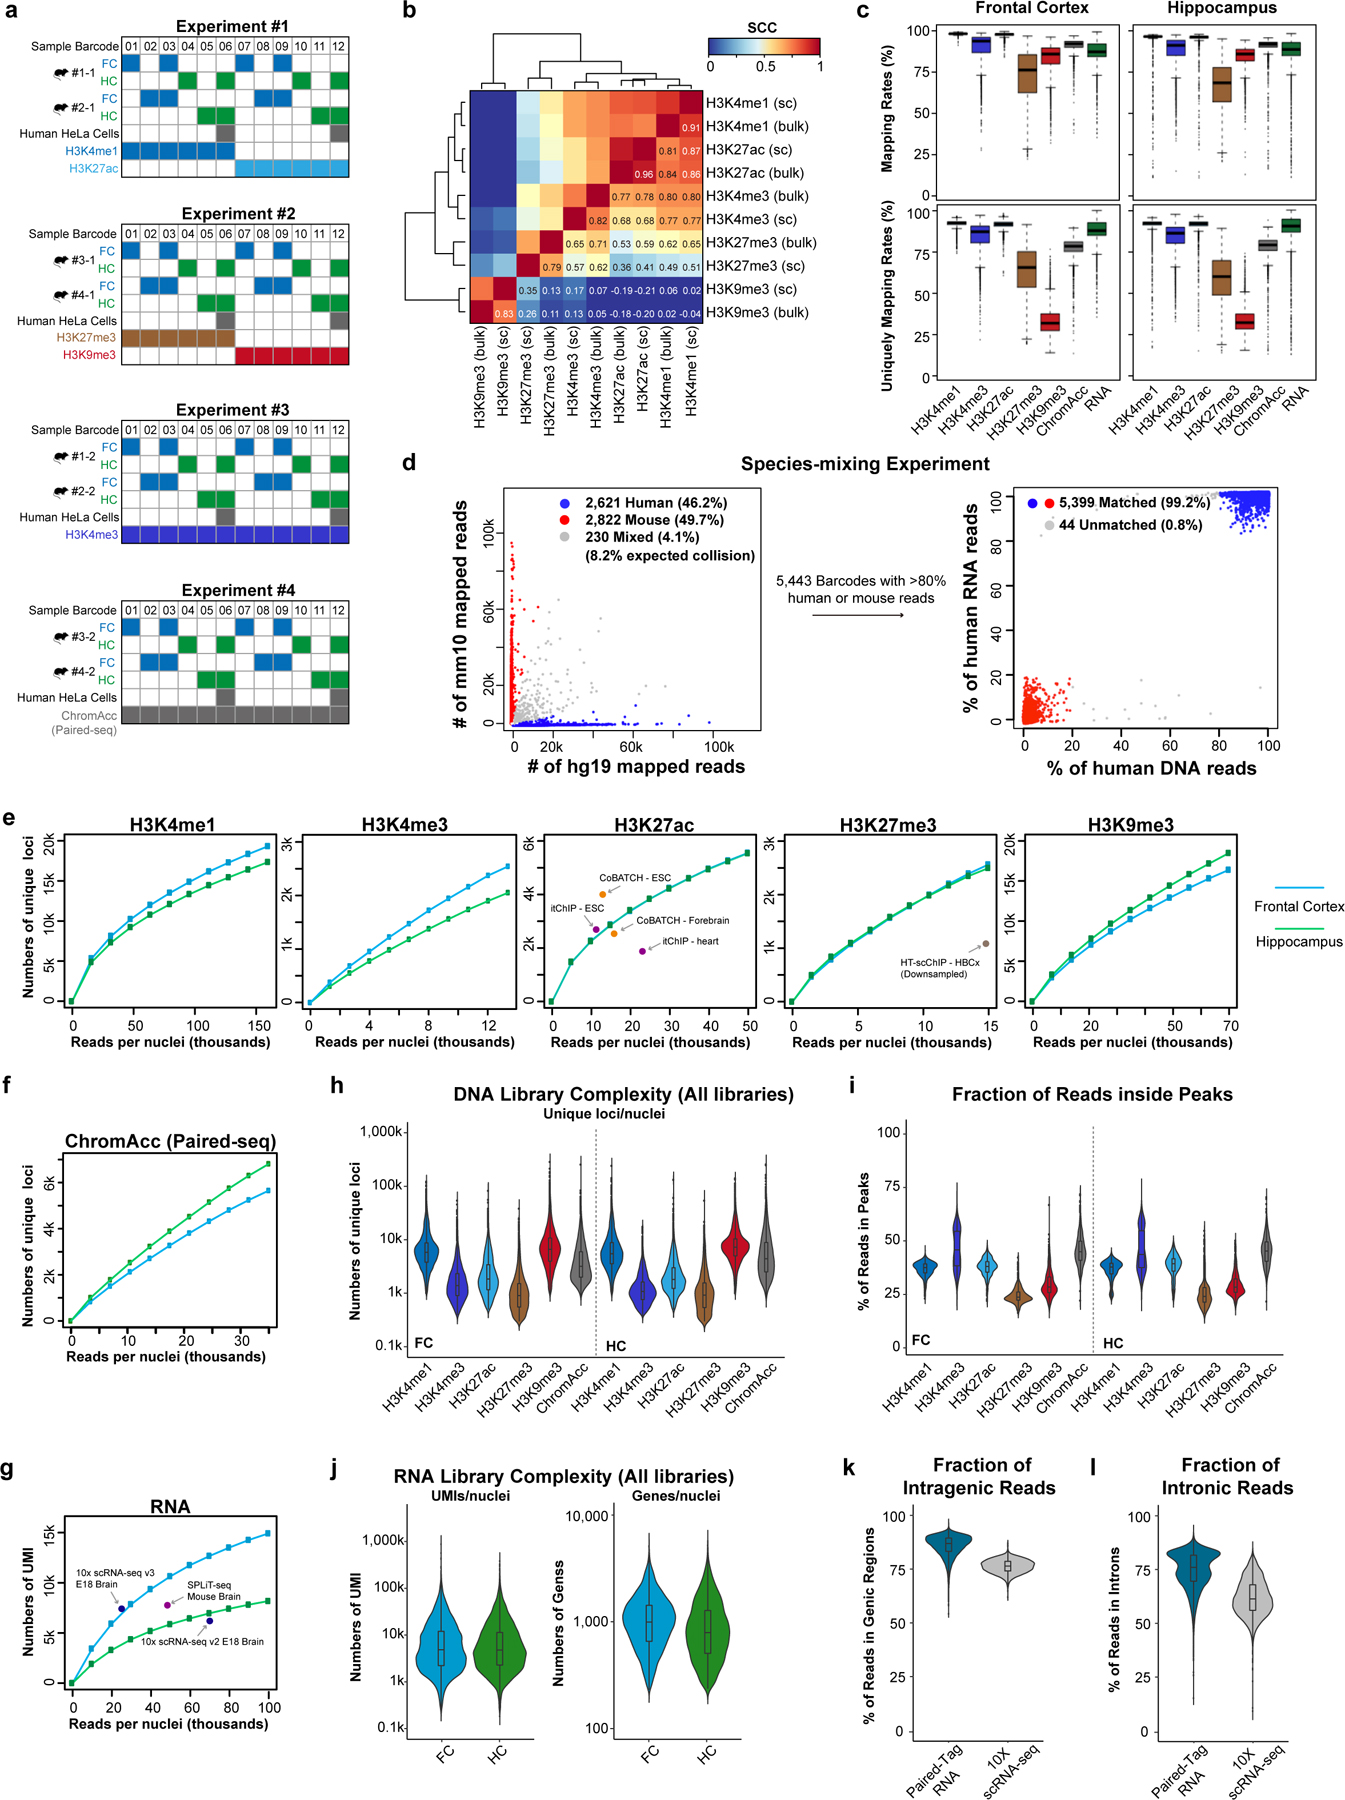
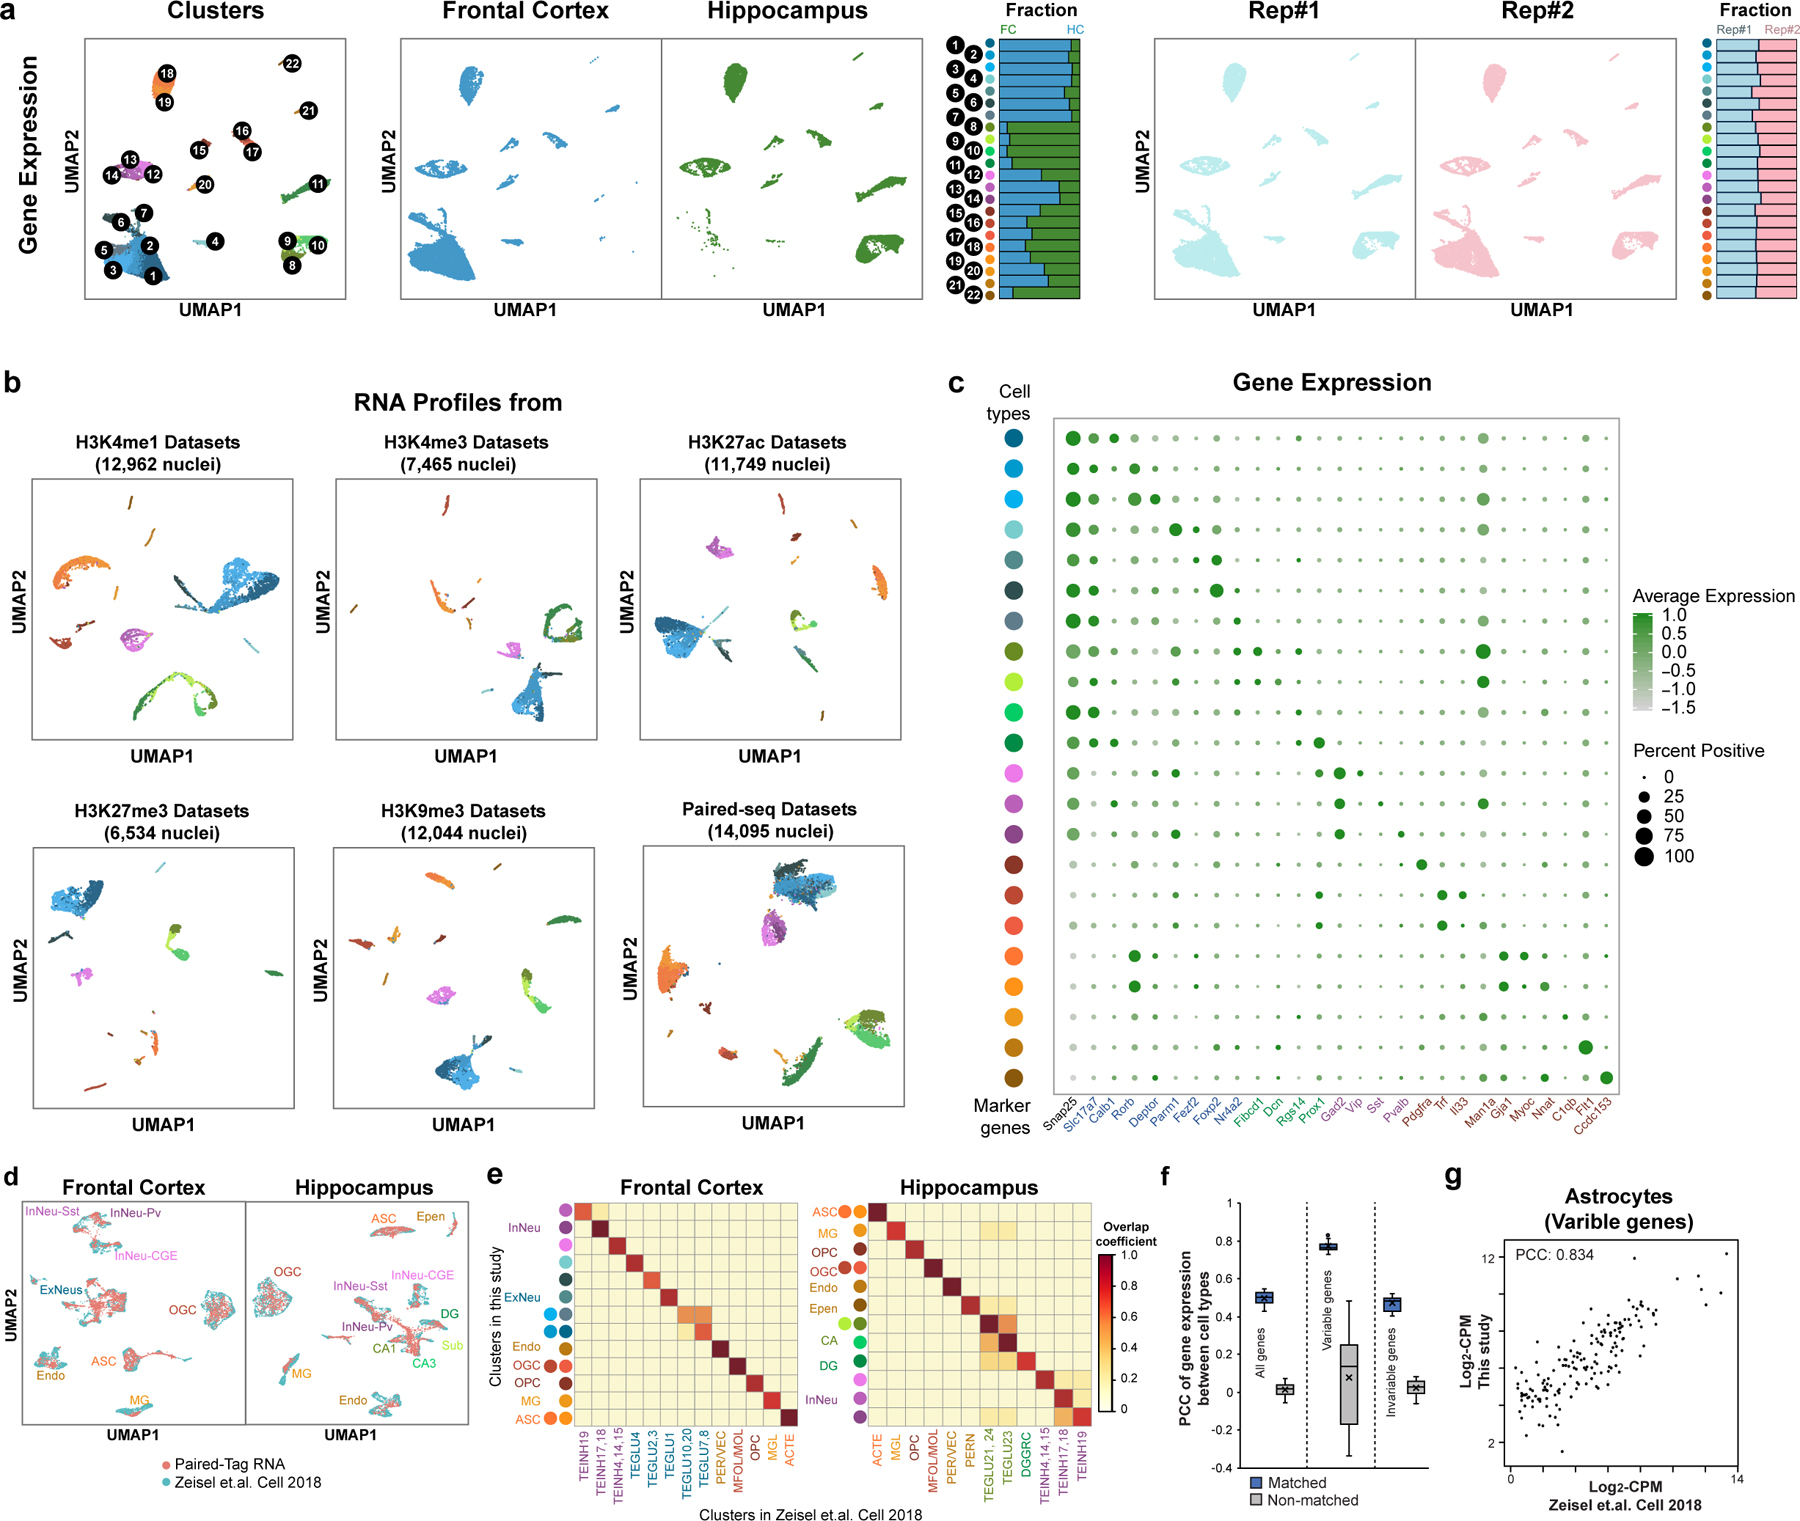
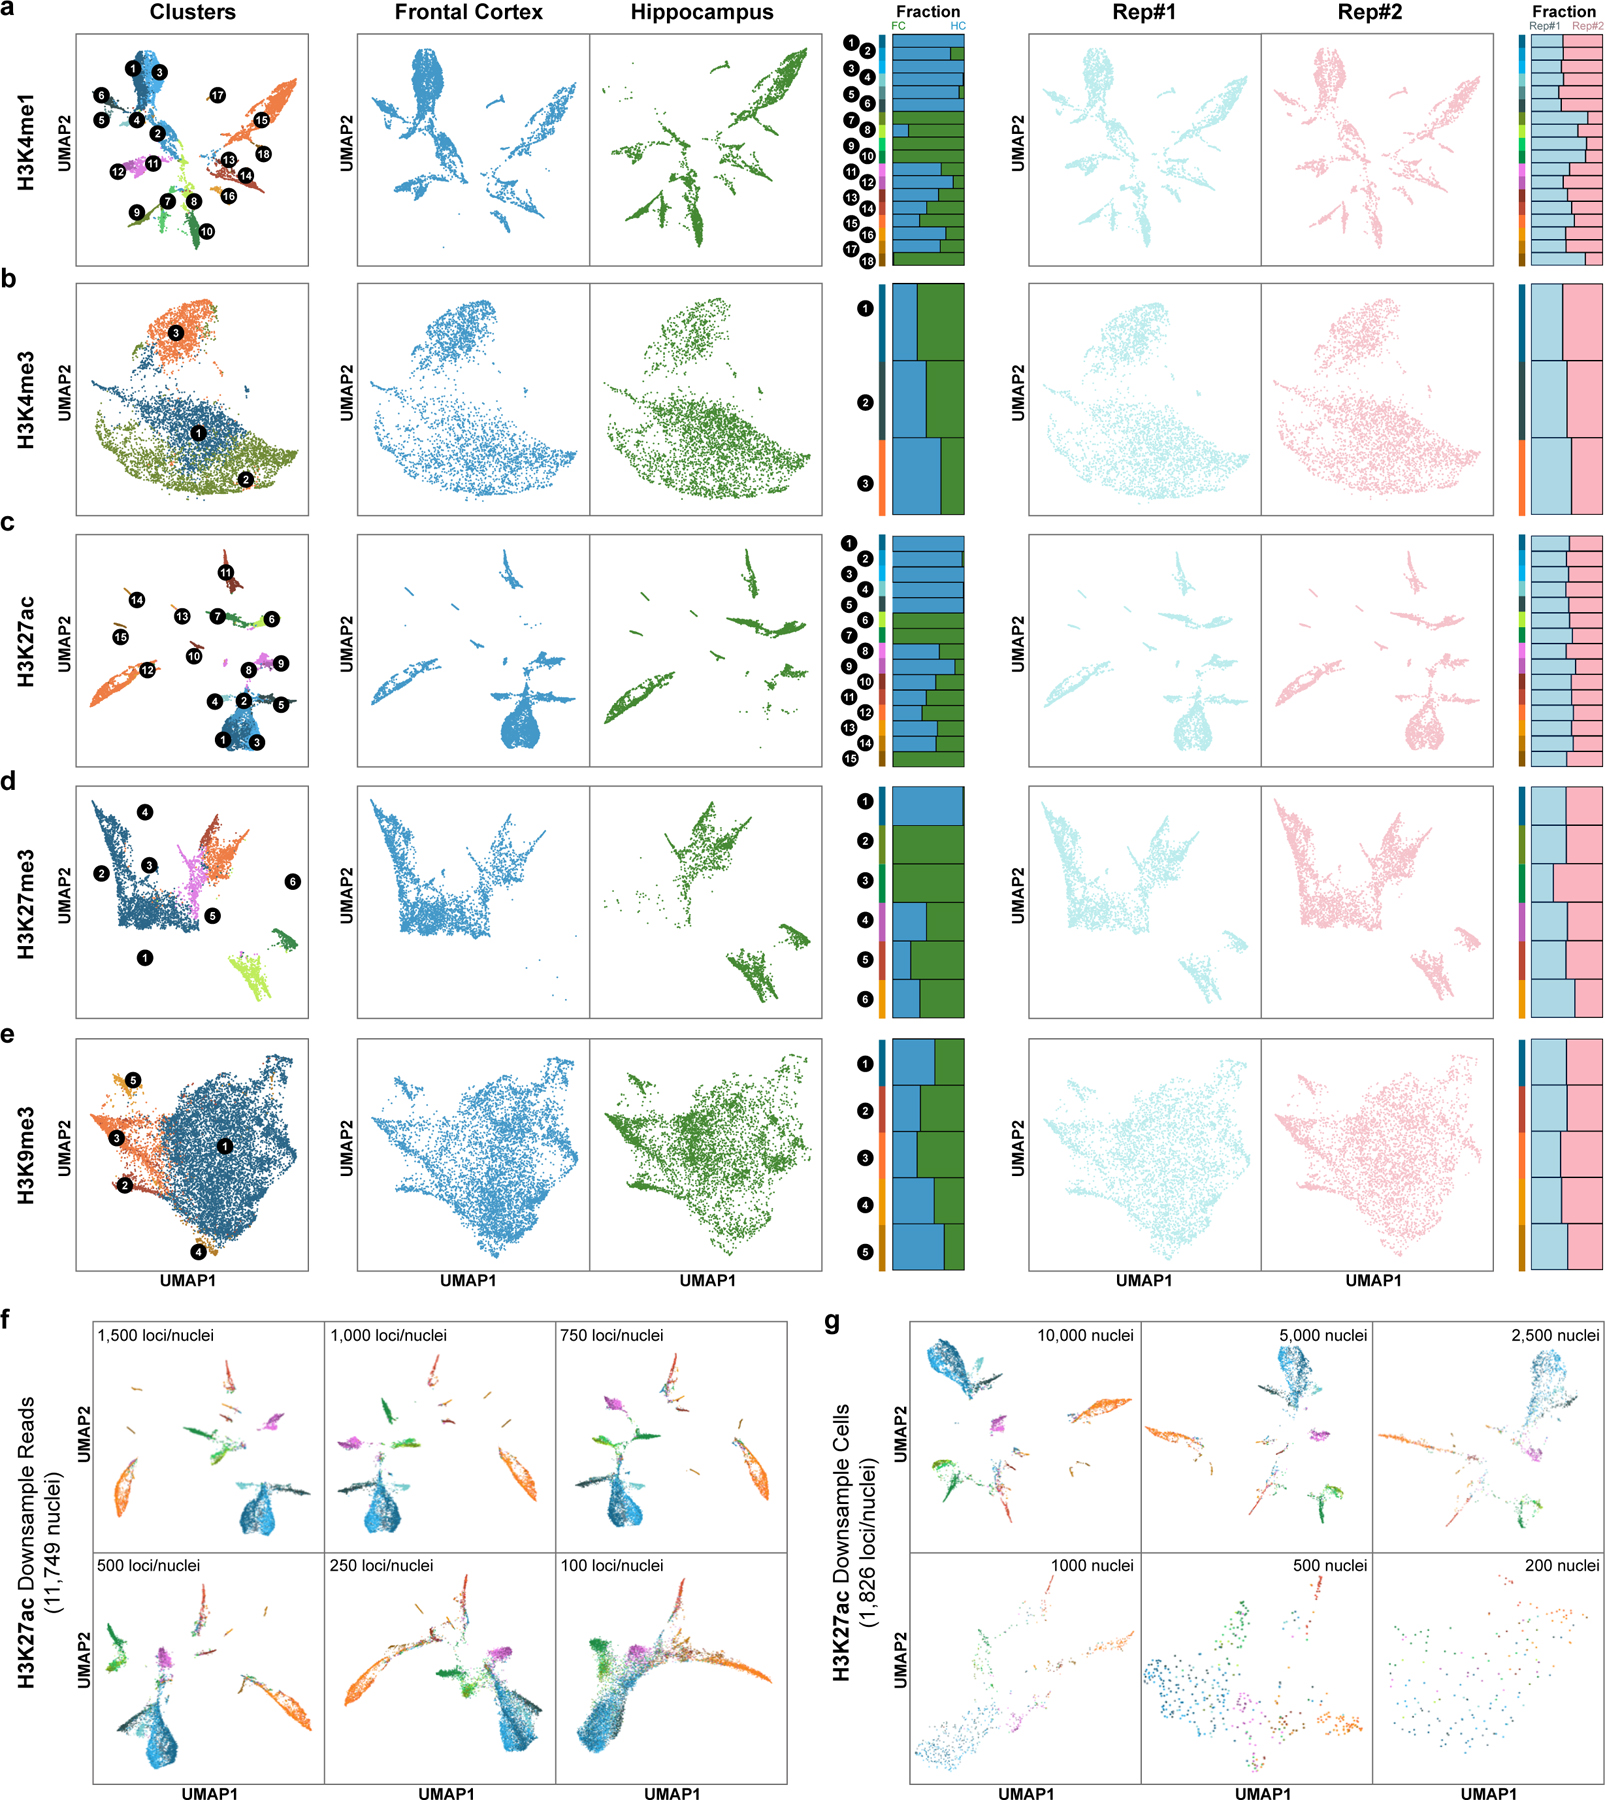
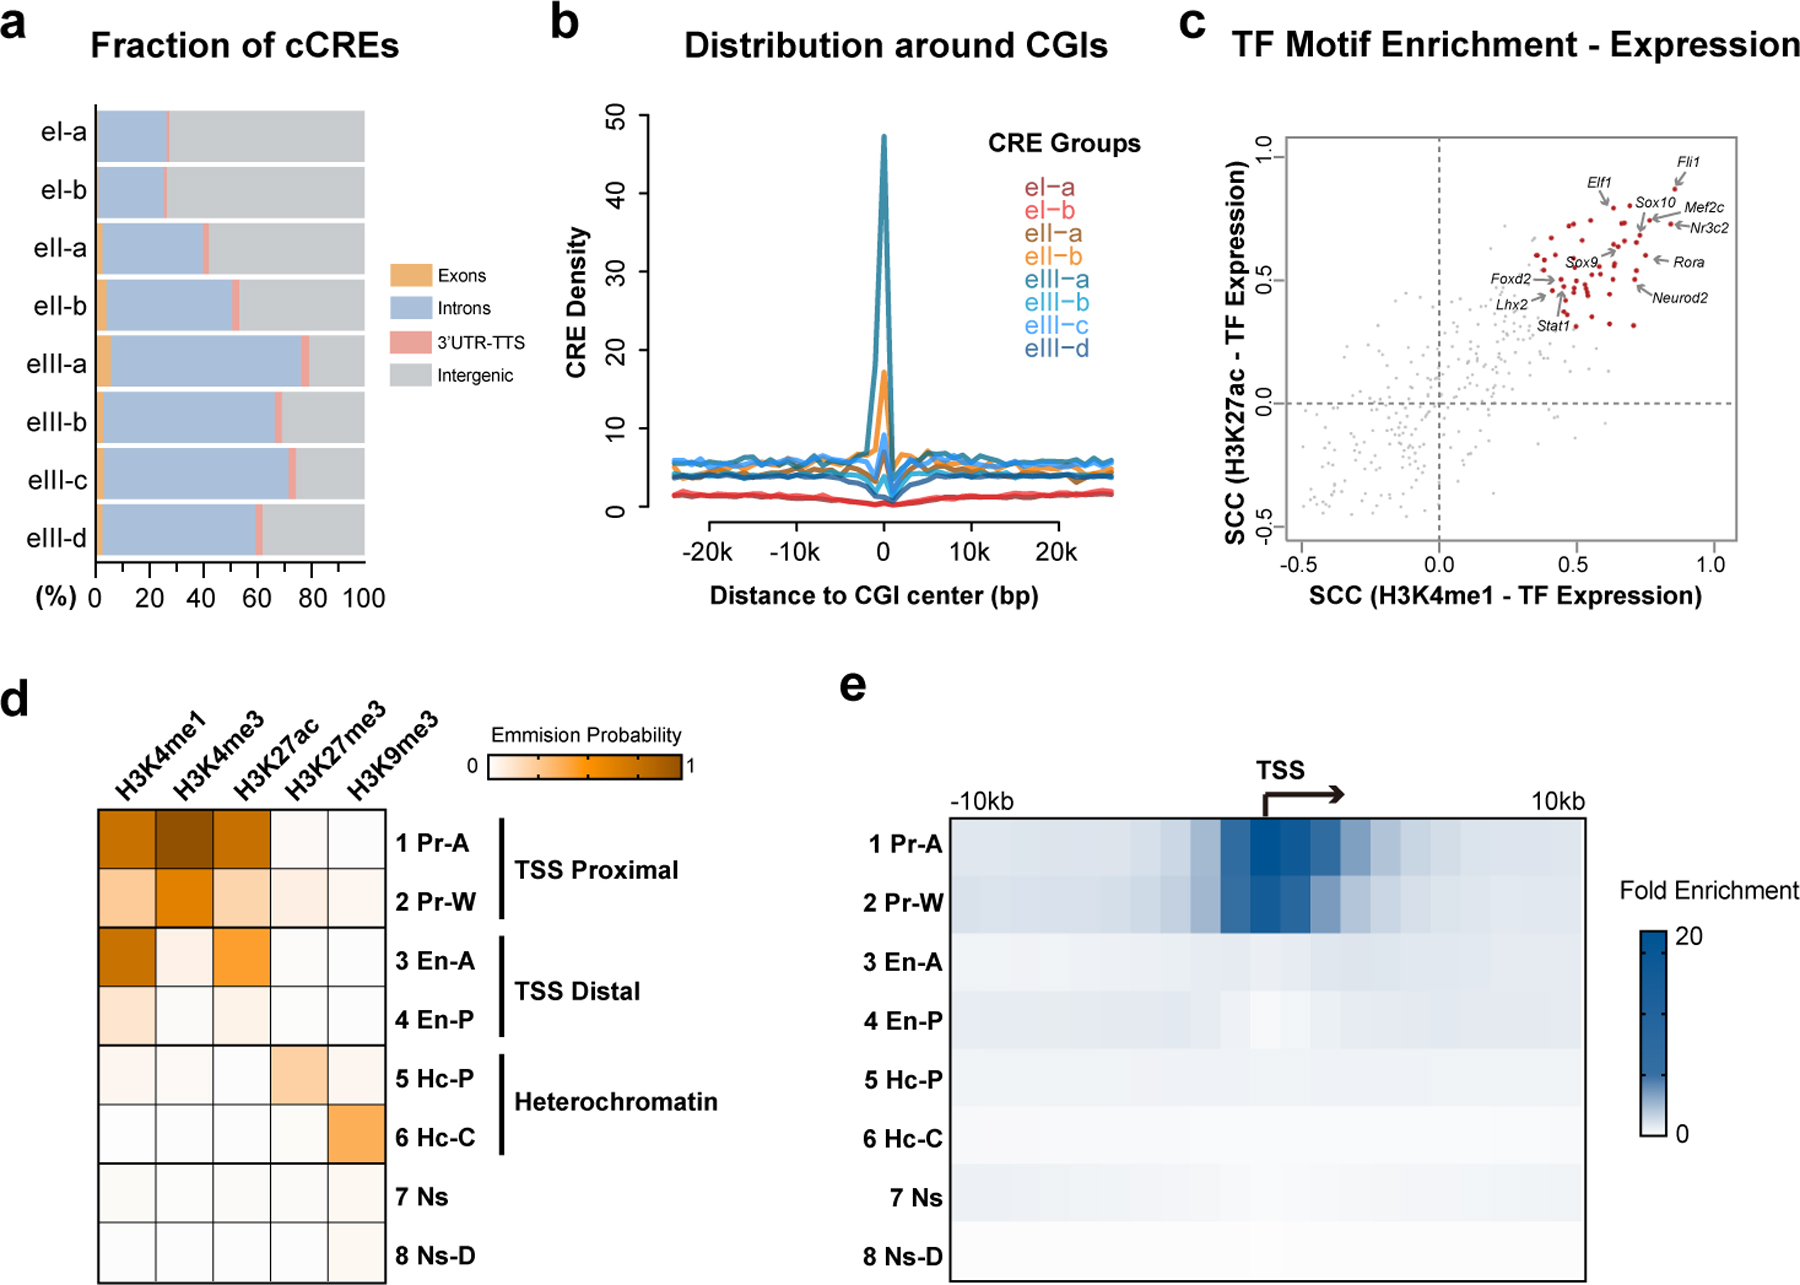
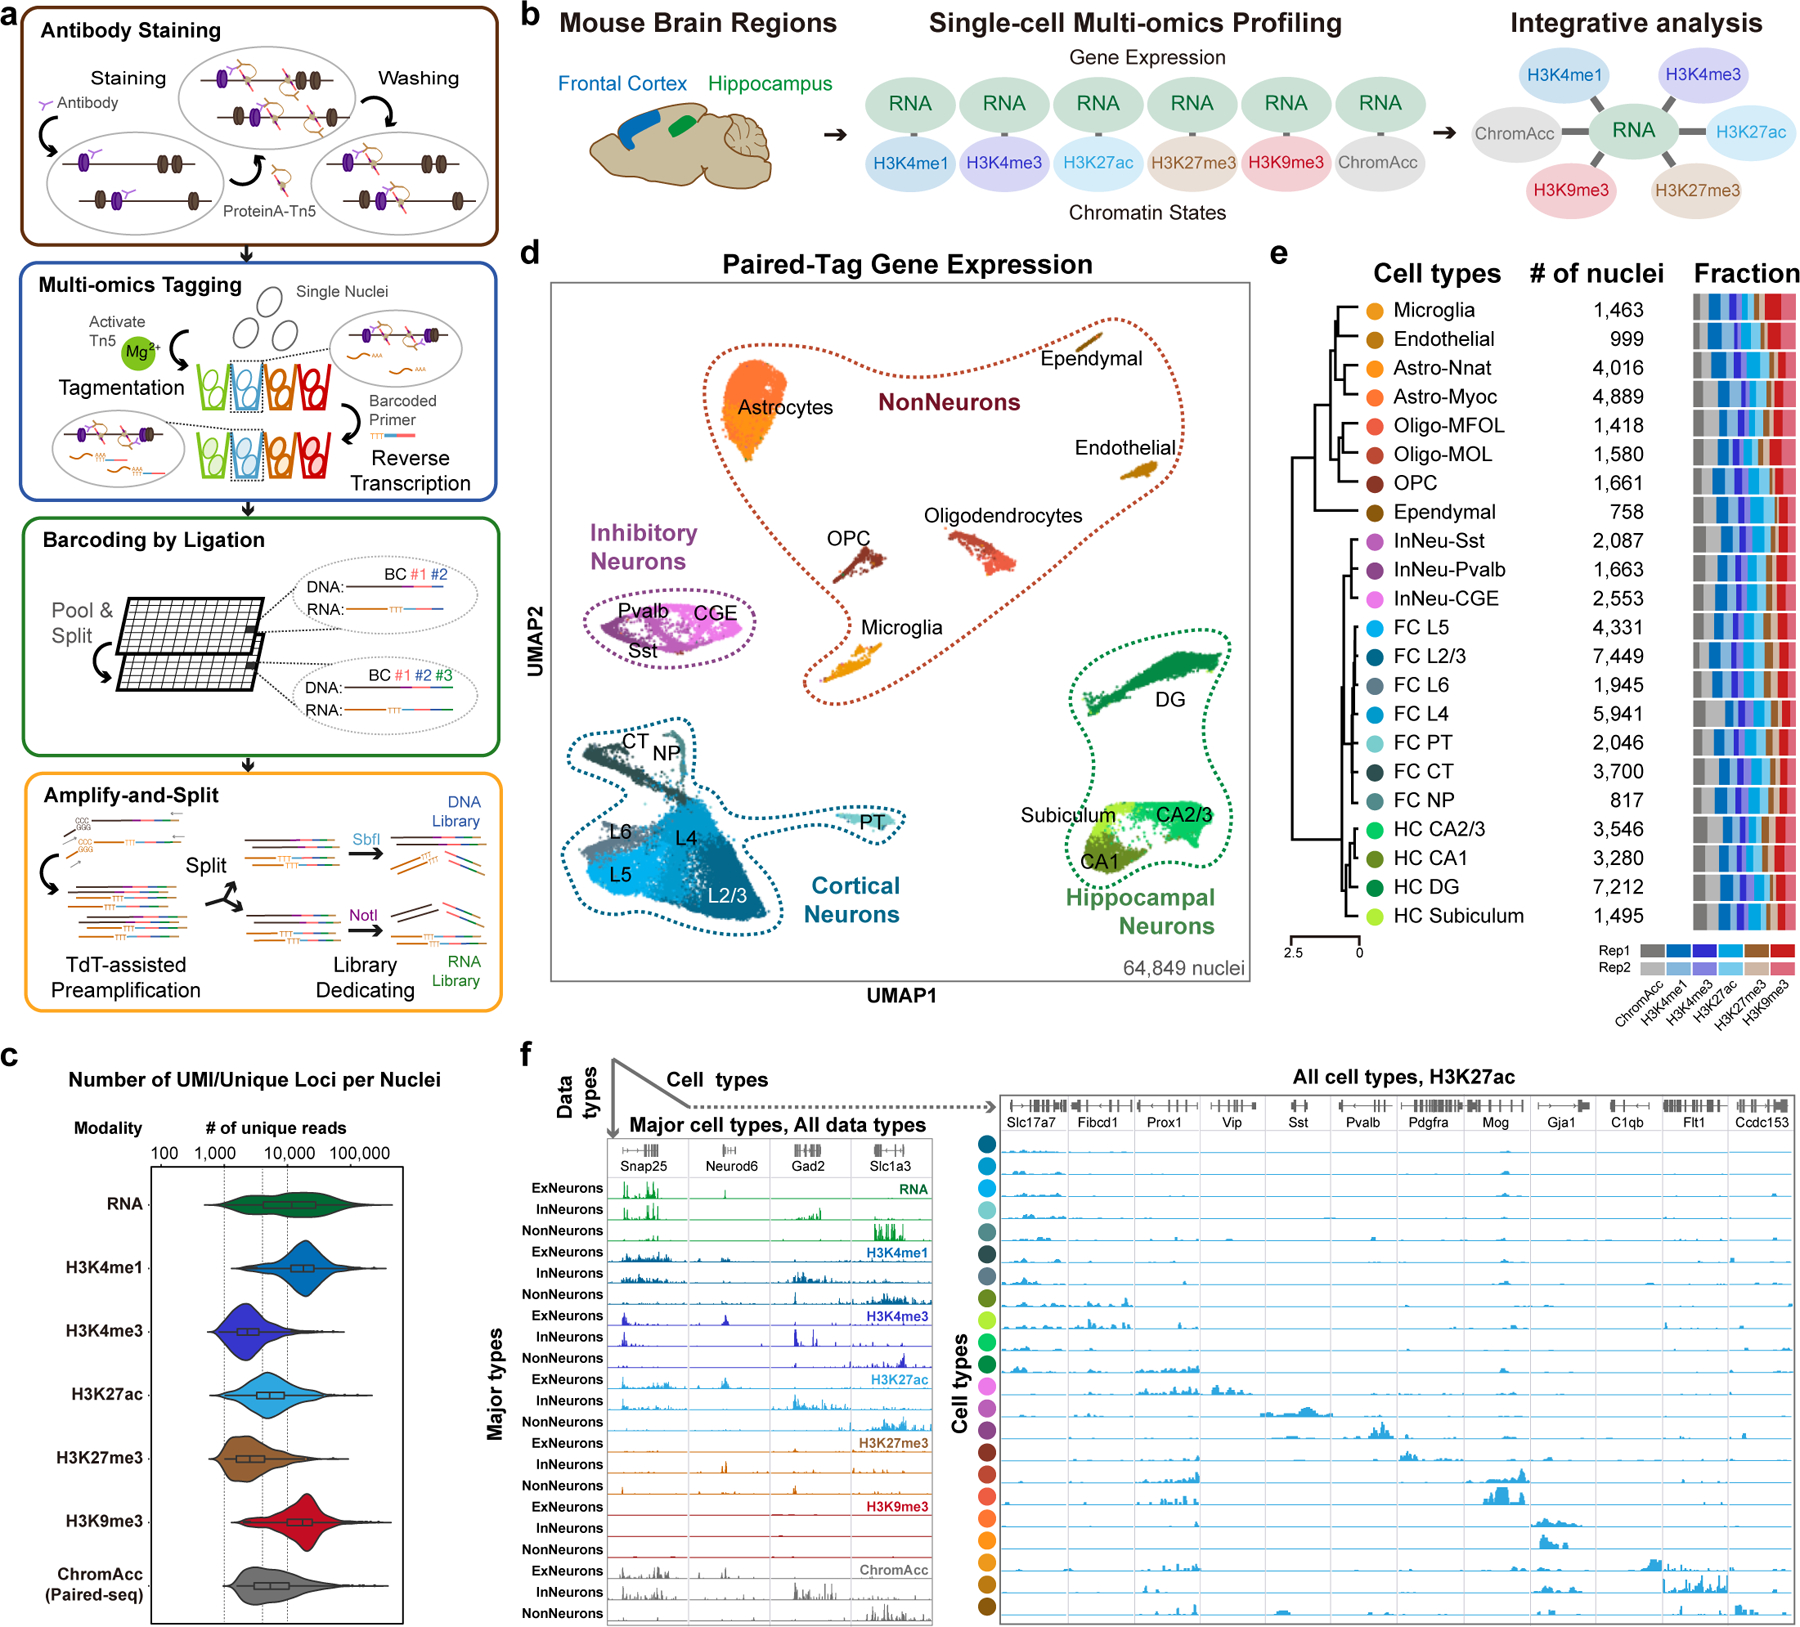
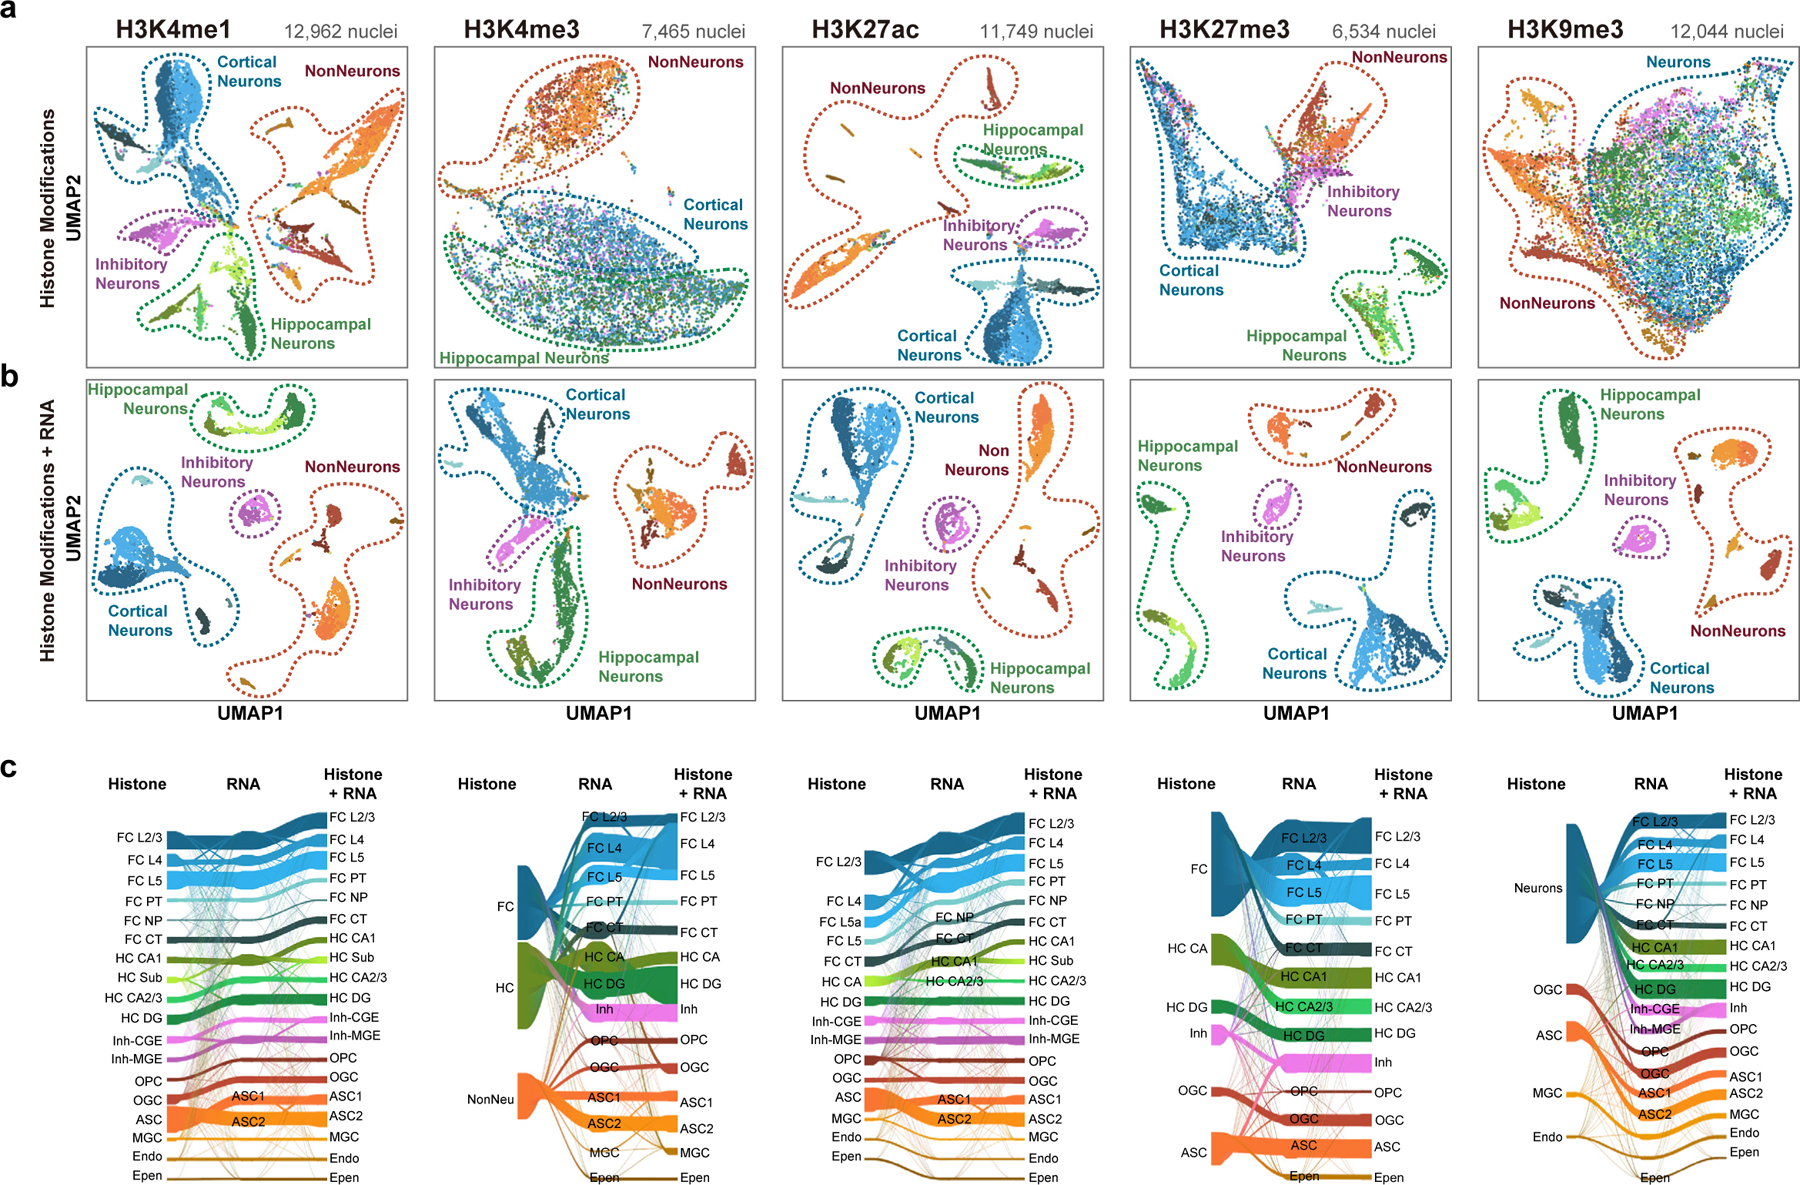
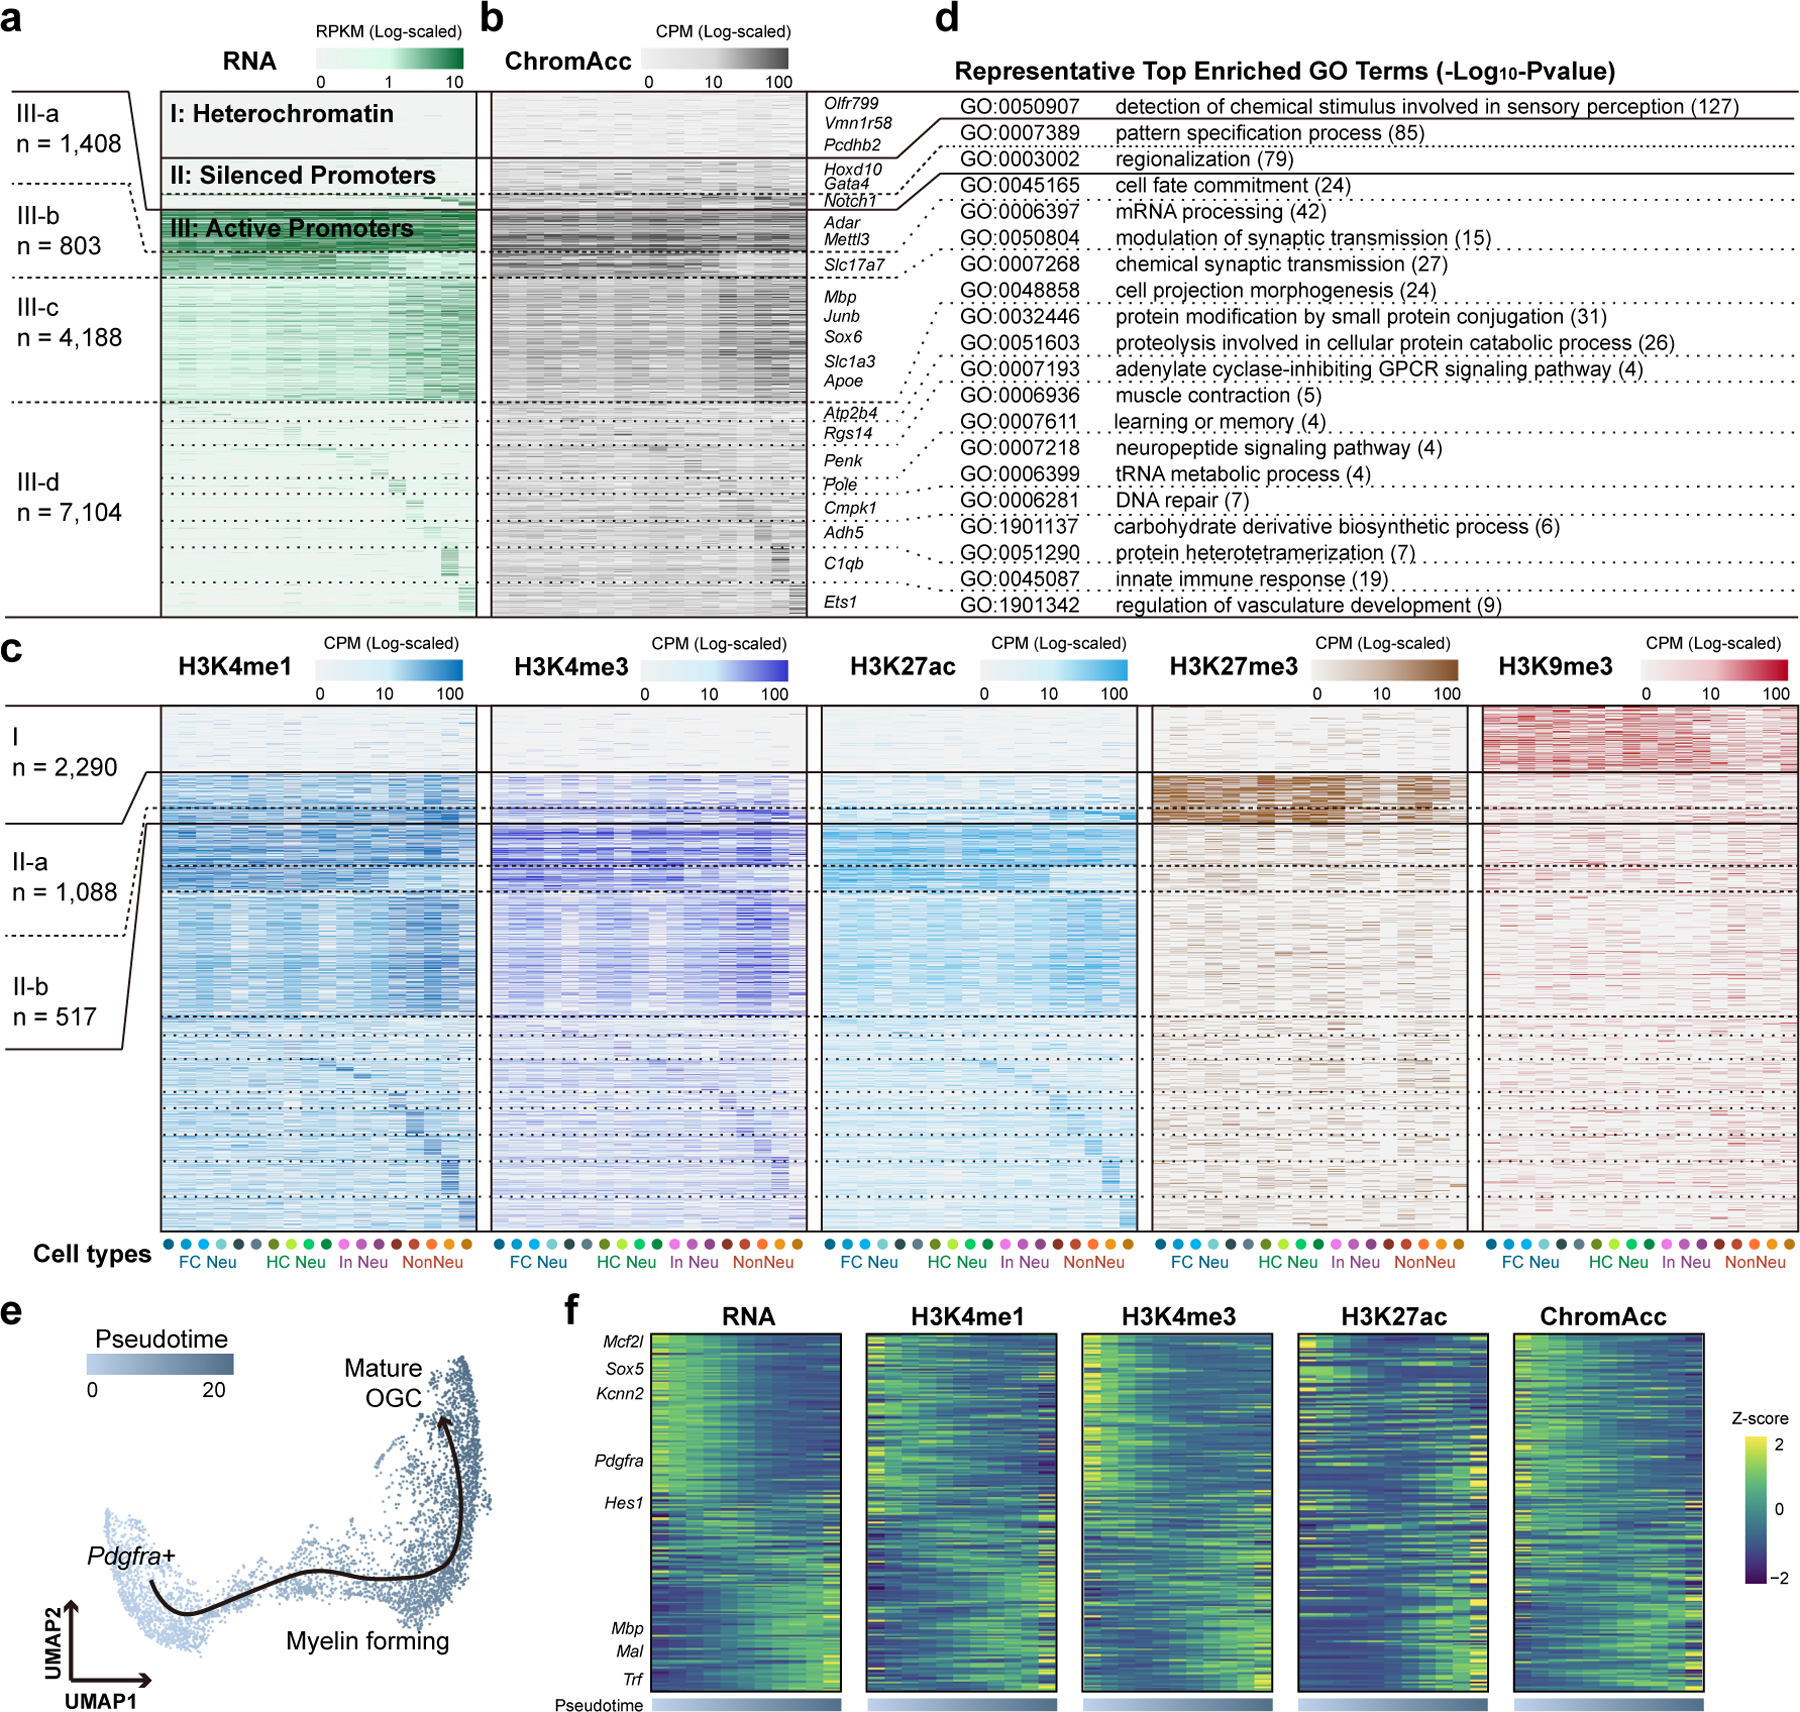
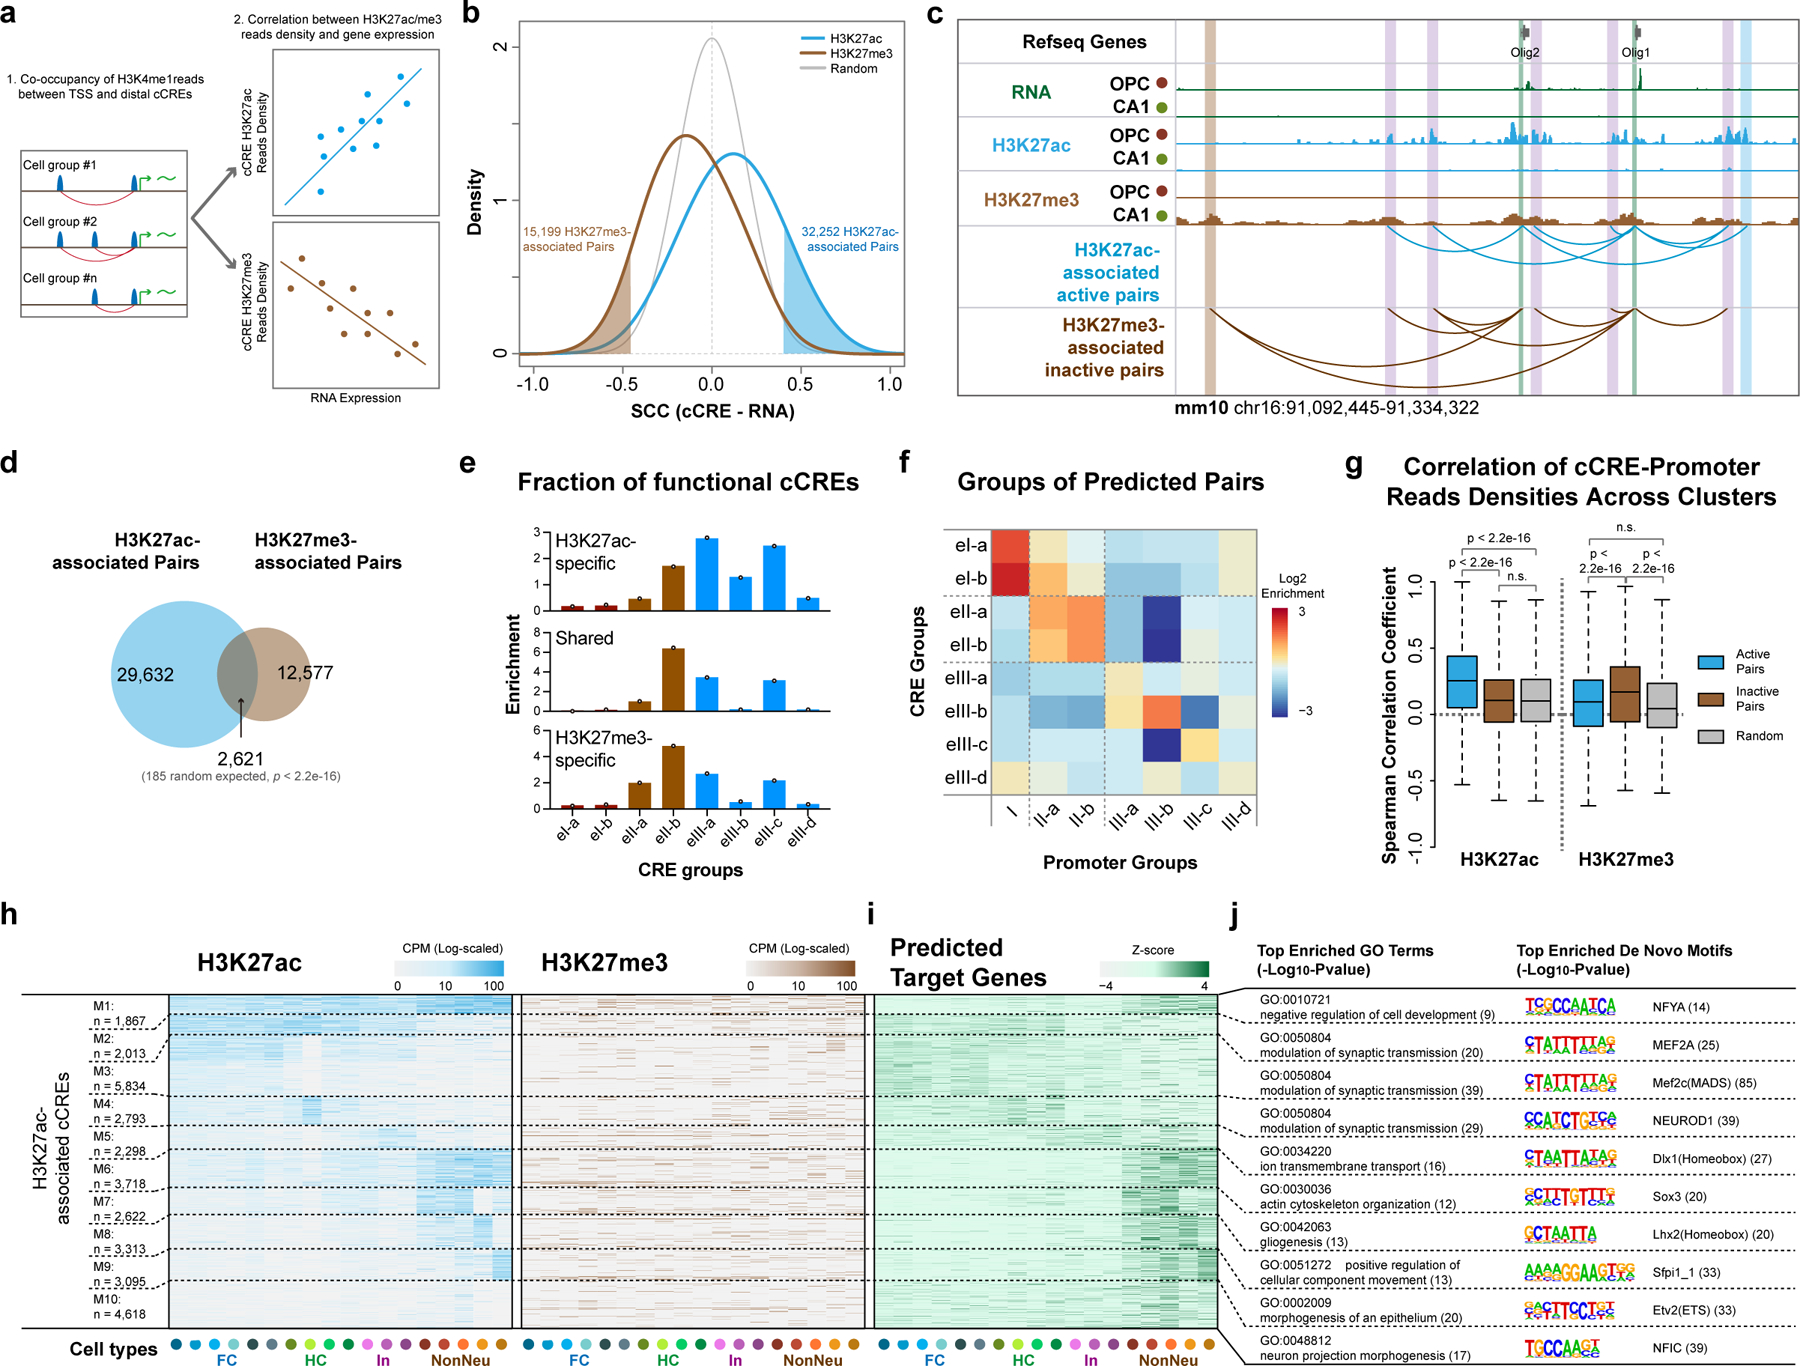
Genome-wide profiling of histone modifications can reveal not only the location and activity state of regulatory elements, but also the regulatory mechanisms involved in cell-type-specific gene expression during development and disease pathology. Conventional assays to profile histone modifications in bulk tissues lack single-cell resolution. Here we describe an ultra-high-throughput method, Paired-Tag, for joint profiling of histone modifications and transcriptome in single cells to produce cell-type-resolved maps of chromatin state and transcriptome in complex tissues. We used this method to profile five histone modifications jointly with transcriptome in the adult mouse frontal cortex and hippocampus. Integrative analysis of the resulting maps identified distinct groups of genes subject to divergent epigenetic regulatory mechanisms. Our single-cell multiomics approach enables comprehensive analysis of chromatin state and gene regulation in complex tissues and characterization of gene regulatory programs in the constituent cell types.


Conflict of interest statement

Competing interests

B.R. is a co-founder and consultant for Arima Genomics, Inc, and co-founder of Epigenome Technologies, Inc. B.R. and C.Z. are listed as inventors of a provisional patent titled “PARALLEL ANALYSIS OF INDIVIDUAL CELLS FOR RNA EXPRESSION AND DNA FROM TARGETED TAGMENTATION BY SEQUENCING”.

Figures

Extended Data Fig. 1
Extended Data Fig. 1. Overview of Paired-Tag
a, Schematics for 2nd adaptor tagging of DNA and RNA libraries. For DNA libraries, amplified products were digested with a type IIS restriction enzyme – FokI, and the cohesive end was then used to ligate the P5 adaptor. For RNA libraries, N5 adaptor was added by tagmentation. b, Table showing the numbers of overlapped peaks across different histone marks between Paired-Tag and ENCODE ChIP-seq or DNase-seq datasets. The total numbers of peaks identified for each dataset are also indicated. c, d, Heatmaps showing the Pearson’s Correlation Coefficients of genome-wide reads distribution (in 10-kb bins) (c) between Paired-Tag datasets and ENCODE ChIP-seq or DNase-seq datasets, and (d) between replicates of Paired-Tag datasets and ENCODE ChIP-seq datasets from HeLa cells. e, Scatter plot showing the Pearson’s correlation coefficients of Paired-Tag RNA dataset and in-house generated nuclei RNA-seq from HeLa cells.
Extended Data Fig. 2
Extended Data Fig. 2. Performances of Paired-Tag in single-nucleus analysis from mouse brain
a, Schematics showing the sample multiplexing strategy in this study. Different samples or replicates were labeled by the 1st round of Paired-Tag cellular barcode (Sample Barcode) located in reverse transcription primers and transposome oligos. b, Heatmap showing the pair-wise Pearson’s correlation coefficients of genome-wide reads distribution for different histone marks from single-cell Paired-Tag datasets (indicated with “sc”, aggregated from all cells shown in Fig. 2a) and bulk datasets. c, Boxplots showing the mapping rates (upper panels) and the fraction of reads uniquely mapped to the reference genome (bottom panels) of DNA profiles of different histone marks and RNA profiles in frontal cortex and hippocampus. The boxes were drawn from lower quartile (Q1) to upper quartile (Q3) with the middle line denote the median, whiskers with maximum 1.5 IQR, outliers were indicated with dots. For Frontal Cortex, n = 7,781 (H3K4me1), 3,509 (H3K4me3), 7,584 (H3K27ac), 3,891 (H3K27me3), 6,560 (H3K9me3), 6,551 (ChromAcc) from dissections of 2 different mice s and n = 35,876 (RNA) from dissections of 4 different mice; for Hippocampus, n = 5,181 (H3K4me1), 3,956 (H3K4me3), 4,165 (H3K27ac), 2,643 (H3K27me3), 5,484 (H3K9me3), 7,544 (ChromAcc) from dissections of 2 different mice and n = 28,973 (RNA) from dissections of 4 different mice. d, Scatter plots showing the proportion of human and mouse RNA reads in each cell (left panel) and the fraction of human reads in DNA and RNA libraries for each cell (right panel) in the species-mixing experiment. Barcodes with less than 80% reads from the same species were identified as mixed cells, the 230 mixed cells of RNA profiles (left panel) were excluded from plotting of the right panel. e, Numbers of unique loci per nucleus for deeply sequenced H3K4me1, H3K4me3, H3K27ac, H3K27me3 and H3K9me3 DNA profiles down-sampled to different levels. f, Numbers of unique loci per nucleus for deeply sequenced Paired-seq DNA profiles down-sampled to different levels. g, Numbers of UMI per nucleus for the deeply sequenced RNA sub-library down-sampled to different levels. For comparison, the numbers of unique loci per cell from the stand-alone high-throughput scChIP-seq assays and the numbers of UMI per cell from scRNA-seq assays were also shown, indicated by dots with labels. h, Violin plots showing the numbers of unique loci mapped per nucleus for all sequenced DNA libraries (average 35k sequenced reads/nuclei with ~40–60% PCR duplication rates). Median numbers, H3K4me1: 5,770 and 5,443, H3K4me3: 1,392 and 1,081, H3K27ac: 1,842 and 1,803, H3K27me3: 904 and 925, H3K9me3: 6,563 and 7,182, chromatin accessibility: 3,170 and 4,381, for frontal cortex and hippocampus, respectively. i, Violin plots showing the fraction of reads inside peaks for different histone marks and brain regions. For Frontal Cortex, n = 7,781 (H3K4me1), 3,509 (H3K4me3), 7,584 (H3K27ac), 3,891 (H3K27me3), 6,560 (H3K9me3), 6,551 (ChromAcc) from dissections of 2 different mice; for Hippocampus, n = 5,181 (H3K4me1), 3,956 (H3K4me3), 4,165 (H3K27ac), 2,643 (H3K27me3), 5,484 (H3K9me3), 7,544 (ChromAcc) from dissections of 2 different mice. j, Violin plots showing the numbers of UMI and genes detected per nucleus for all sequenced RNA libraries (average 30k sequenced reads/nuclei with ~40–60% PCR duplication rates). Median numbers, 4,215 and 3,568 RNA UMI per nucleus for frontal and hippocampus, respectively. k,l, Violin plots showing the (k) fraction of reads mapped to annotated gene regions (GENCODE GRCm38.p6) and (l) fraction of intronic reads for Paired-Tag RNA datasets and 10X scRNA-seq datasets (10k Brain Cells from an E18 Mouse, V3). n = 35,876 (Frontal Cortex) and 28,973 (Hippocampus) from dissections of 4 different mice. For (h-l), the violin plots were drawn from lower quartile (Q1) to upper quartile (Q3) with the middle line denote the median, whiskers with maximum 1.5 IQR, outliers were indicated with dots.
Extended Data Fig. 3
Extended Data Fig. 3. Annotation of cell types by Paired-Tag transcriptomic profiles
a, UMAP embedding of Paired-Tag transcriptomic profiles and stacked bar plots showing the fraction of cells from different regions or replicates (dissections from different mice) in each cell type. b, UMAP embedding of transcriptomic profiles from individual Paired-Tag and Paired-seq datasets. The color of cell types was the same as in Fig.1d. c, Dot plots showing the expression of marker genes for each mouse brain cell type measured from Paired-Tag RNA profiles. The size of the dots represents the fraction of cells positively detect the transcripts and the color of the dots represents the average. d, UMAPs showing the co-embedding of single-nucleus gene expression from Paired-Tag RNA profiles and the previously published scRNA-seq datasets of the same tissues. e, Heatmaps showing the confusion matrices of the overlap between cell type annotations based on Paired-Tag RNA profiles and from the previously published scRNA-seq datasets. The circles left side indicating RNA clusters and were colored according to Fig.1d. f, Boxplots showing the Pearson’s correlation coefficients for all genes, variable genes and invariable genes for matched and non-matched cell types between Paired-Tag RNA profiles and the previously published scRNA-seq. The boxes were drawn from lower quartile (Q1) to upper quartile (Q3) with the middle line denote the median, whiskers with maximum 1.5 IQR, outliers were indicated with dots. n = 22 cell types. g, Scatter plot showing the expression levels of variable genes in Astrocytes measured by Paired-Tag RNA profiles and the published scRNA-seq datasets.
Extended Data Fig. 4
Extended Data Fig. 4. Histone marks-based single-cell clustering
a-e, UMAP embeddings based on (a) H3K4me1, (b) H3K4me3, (c) H3K27ac, (d) H3K27me3 and (e) H3K9me3 DNA profiles and stacked bar plots showing the fraction of cells from each region or replicate. f, UMAP embeddings based on Paired-Tag H3K27ac DNA profiles down-sampled to different sequencing depth (11,749 nuclei, 100 – 1,500 loci/nuclei). g, UMAP embeddings based on Paired-Tag H3K27ac DNA profiles of different numbers of sub-sampled nuclei (median 1,826 loci/nuclei, 200 – 10,000 nuclei). For visualization, cells were colored according to clustering results from Fig. 1d.
Extended Data Fig. 5
Extended Data Fig. 5. Gene expression and promoter epigenetic states
a, Violin plots showing reads densities of the five histone marks in Group II-a and III-b promoters. Colors represent cell types the same as in (e). Group II-a promoters were repressed by H3K27me3 in all cell types; genes in III-b were activated by H3K27ac in neuron cells, with comparable H3K27me3 levels in all cell groups. b, Boxplots showing the expression levels of genes grouped by their promoter DNA reads densities for different histone marks. The boxes were drawn from lower quartile (Q1) to upper quartile (Q3) with the middle line denote the median, whiskers with maximum 1.5 IQR, outliers were indicated with dots. n = 2,900 genes for the first 5 groups and n = 2,898 for the 6th group of each histone modification. c, Heatmap showing the Spearman’s correlation coefficients of gene expression and promoter histone modification levels within each cell type. d, Genome browser view of aggregated Paired-Tag profiles showing the three Olfr gene clusters in chr7 was silenced by H3K9me3. e, 3D-scatter plot showing the PCA embedding of aggregated RNA profiles. PC1 differs neuron cells from glial cells and PC2 mainly separates different non-neuron cell types. f, Scatter plot showing the loadings of the first 2 PCs for each gene. Genes from group II-b and III-d were colored in brown and blue, respectively. g, UMAP embedding of 4,659 OPC and Oligodendrocytes nuclei used for pseudotime analysis. h, Expression of marker genes alone the pseudotime.
Extended Data Fig. 6
Extended Data Fig. 6. Histone modification states in mouse neuron cell types
a, Stacked bar plots showing the fraction of genomic regions for CREs of each group in Fig. 4a and b. b, Line plots showing the densities of CREs from different groups around CpG islands. c, Scatter plot showing the Spearman’s correlation coefficients of TF motif enrichment and TF gene expression across cell types. TFs with significant positive correlations (FDR < 0.05) between expression and motif enrichment for both H3K4me1 and H3K27ac were colored in red. d, Heatmap showing the emission probability of each histone mark across the 8 chromatin states identified by chromHMM. e, Heatmap showing the fold enrichment of the 8 chromatin states around transcription start sites of FC L2/3 cell cluster.
Extended Data Fig. 7
Extended Data Fig. 7. Identification of putative CRE-gene pairs
a, Bar charts showing the fraction of predicted H3K27ac- and H3K27me3- associated cCRE-gene pairs supported by the CEMBA datasets. P-value, two-tailed Fisher’s exact test. b-e, Bar charts showing the numbers of cCREs per targeted genes for (b) H3K27ac- and (c) H3K27me3- associated cCRE-gene pairs, and the numbers of predicted targeted genes per cCRE for (d) H3K27ac- and (e) H3K27me3- associated cCRE-gene pairs. f, Representative genome browser view of Gad2 gene locus, both H3K27ac- and H3K27me3-associated cCREs were shown. TSS-proximal region is indicated with green box and cCREs are marked with blue (H3K27ac-specific), brown (H3K27me3-specific) or purple (shared) boxes. g, Top enriched de novo TF motifs and GO terms of cCREs in H3K27ac-specific, shared and H3K27me3-specific pairs. h, Stacked bar plots showing the fraction of genomic regions for cCREs with potential active and repressive functions. P-value, two-tailed Fisher’s exact test. i,j, Bar charts showing the distribution of the distance between cCRE and TSS of predicted target genes from (i) H3K27ac- and (j) H3K27me3- associated cCRE-gene pairs. k, Spearman’s correlations coefficients between reads densities of cCREs and promoters of putative target genes across cell types for H3K4me1 and H3K9me3. P-value, two-tailed Wilcoxon signed-rank test. The boxes were drawn from lower quartile (Q1) to upper quartile (Q3) with the middle line denote the median, whiskers with maximum 1.5 IQR. n = 22 cell types. l, Heatmap showing the histone modification levels at cCREs with potential repressive roles in expression of putative target gene. cCRE were grouped using K-means clustering based on histone modification levels. m, Heatmap showing the expression levels of corresponding putative target genes of cCREs in (l). n, Top enriched Gene Ontology terms for genes in (m) and the top enriched de novo motifs for cCREs from each group in (l).
Fig. 1 |
Fig. 1 |. Overview of Paired-Tag.
a, Schematic of Paired-Tag workflow. b, Single-cell, joint analysis of histone modifications and transcriptome in adult mouse frontal cortex and hippocampus. Paired-Tag assays were performed with antibodies against H3K4me1, H3K27ac, H3K27me3 or H3K9me3. Paired-seq assay was also performed with the same tissue samples (ChromAcc: chromatin accessibilities). The transcriptomic profiles from each paired dataset were then used to annotate each cell cluster. c, Violin plots showing the unique loci (DNA) or UMI (RNA) per nuclei of representative deeply sequenced Paired-Tag and Paired-seq datasets. The violin plots were drawn from lower quartile (Q1) to upper quartile (Q3) with the middle line denote the median, whiskers with maximum 1.5 IQR, outliers were indicated with dots. n= 1,651 (RNA), 865 (H3K4me1), 1,002 (H3K4me3), 786 (H3K27ac), 558 (H3K27me3), 1,054 (H3K9me3) and 2,472 (ChromAcc) cells from dissections of 2 different mice. d, UMAP embedding showing the clustering of single nuclei from Paired-Tag and Paired-seq transcriptomic profiles. Each dot represents an individual nucleus profiled by Paired-Tag and Paired-seq and was colored according to the assigned cell cluster according to (e). e, Numbers of nuclei from the 22 mouse brain cell types and the fraction of nuclei from each replicate. Cell clusters were annotated based on marker genes expression. PT: pyramidal tract excitory neurons; CT: corticothalamic excitatory neurons; NP: near projecting excitatory neurons. f, Representative genome browser views of aggregated single-nuclei transcriptomic and the matched epigenetic profiles.
Fig. 2 |
Fig. 2 |. Histone modification-based cell-clustering recapitulate transcriptomic -based cell clustering with varying degrees of success.
a, UMAP-embedding from single-nucleus histone modification profiles. b, UMAP-embedding from single-nucleus joint histone modification and nuclear transcriptome profiles. Each dot represents an individual nucleus profiled by Paired-Tag and was colored by cell type annotations from the joint clustering. c, Sankey plots showing the overlap between cell clustering based on Paired-Tag histone modification profiles, RNA profiles and joint modalities for H3K4me1, H3K4me3, H3K27ac, H3K27me3 and H3K9me3 DNA datasets.
Fig. 3 |
Fig. 3 |. Integrative analysis of chromatin states at promoters and gene expression across mouse brain cell types.
a, Heatmap showing the (a) transcript levels of genes with detected matched histone modification profiles for each mouse brain cell type. Cell types were indicated with colored dots below and the color of the dots are the same as in Fig. 1d. b, c, Heatmaps showing the matched (b) chromatin accessibility and (c) histone modification levels for the promoters of corresponding genes in (a). Genes were grouped using K-means clustering based on both expression and histone modification levels of H3K27ac, H3K27me3 and H3K9me3. c, Top enriched GO terms for genes in each category of (a). e, UMAP embedding showing the trajectory of oligodendrocyte maturation. Each dot represents a single nucleus and colored by pseudotime. f, Heatmaps showing the gene expression levels, promoter histone modification levels and promoter chromatin accessibility of differentially expressed genes along the pseudotime.
Fig. 4 |
Fig. 4 |. Characterization of chromatin state at distal candidate cis-regulatory elements across brain cell types.
a-c Heatmaps showing the modification levels of (a) active histone marks (H3K4me1, H3K4me3, H3K27ac), (b) repressive histone marks (H3K27me3, H3K9me3) and (c) chromatin accessibility of candidate CREs in each mouse brain cell type. The cCREs were grouped using K-means clustering based on histone modification signals (H3K27ac, H3K27me3 and H3K9me3) across different cell types. Cell types were indicated with colored dots below and the color of the dots are same as in Fig. 1d. d, Top enriched de novo motifs and GO terms for cCREs in different classes. e, Heatmap showing the enrichment of known transcription factor motifs for cCREs of each class in (a-c). cCREs in eIII-d group were further separated by their densities in each cell type, indicated by the colored dots left side. The color of the dots is the same as Fig. 1d. Each column represents a TF motif, colored by -Log10(P-value) and ordered according to K-means clustering. f, Boxplots showing genomic coverage of chromHMM chromatin state. The boxes were drawn from lower quartile (Q1) to upper quartile (Q3) with the middle line denote the median, whiskers with maximum 1.5 IQR. n = 22 cell types. g, Representative genome browser view of chromHMM chromatin states on marker genes. Chromatin states were colored according to (f). h, Heatmap showing the fraction of variable bases in different chromatin states of FC L2/3 compared to the other 21 cell clusters.
Fig. 5 |
Fig. 5 |. Correlative analysis of chromatin state and gene expression links distal candidate cis-regulatory elements to putative target genes.
a, Schematics for identifying potential targets for cCREs. Putative cCRE-gene pairs were first determined by calculating the co-occupancy of H3K4me1 reads in gene promoter and distal cCRE regions. The Spearman’s Correlation Coefficients between expression levels of genes and H3K27ac or H3K27me3 levels of cCREs were then used to identify cCRE-gene pairs. b, Density plot showing the distribution of correlations between histone modification levels of cCREs and expression of potential target genes. The cutoffs (FDR = 0 .05) for identifying potential H3K27ac-associated active and H3K27me3-associated inactive cCRE-gene pairs are also indicated. c, Representative genome browser view of Olig1 and Olig2 gene locus, both H3K27ac- and H3K27me3-associated cCREs were shown. TSS-proximal regions are marked with green boxes and cCREs are indicated with blue (H3K27ac-specific), brown (H3K27me3-specific) or purple (shared) boxes. d, Venn diagram showing the overlap between predicted H3K27ac- and H3K27me3- associated cCRE-gene pairs. P-value, two-tailed Fisher’s exact test. e, Relative enrichment of the distribution in CRE groups of Fig. 4 for cCREs in H3K27ac-specific, shared and H3K27me3-specific pairs. f, Heatmap showing the enrichments of predicted targeted genes of each promoter group defined in Fig. 3a linked by cCREs of each CRE group defined in Fig. 4. g, Spearman’s Correlations Coefficients between reads densities of cCREs and promoters of putative target genes across cell types for H3K27ac and H3K27me3. P-value, two-tailed Wilcoxon signed-rank test. The boxes were drawn from lower quartile (Q1) to upper quartile (Q3) with the middle line denote the median, whiskers with maximum 1.5 IQR. n = 22 cell types. h, Heatmap showing the histone modification levels at cCREs with potential active roles in expression of putative target gene. cCRE were grouped using K-means clustering based on histone modification levels. i, Heatmap showing the expression levels of corresponding putative target genes of cCREs in (h). j, Top enriched Gene Ontology terms for genes in (i) and the top enriched de novo motifs for cCREs from each group in (h).

Comment in

References

    1. Stadhouders R, Filion GJ & Graf T Transcription factors and 3D genome conformation in cell-fate decisions. Nature 569, 345–354, doi:10.1038/s41586-019-1182-7 (2019). - DOI - PubMed
    1. Johnson DS, Mortazavi A, Myers RM & Wold B Genome-wide mapping of in vivo protein-DNA interactions. Science 316, 1497–1502, doi:10.1126/science.1141319 (2007). - DOI - PubMed
    1. Crawford GE et al. Genome-wide mapping of DNase hypersensitive sites using massively parallel signature sequencing (MPSS). Genome Res 16, 123–131, doi:10.1101/gr.4074106 (2006). - DOI - PMC - PubMed
    1. Buenrostro JD, Giresi PG, Zaba LC, Chang HY & Greenleaf WJ Transposition of native chromatin for fast and sensitive epigenomic profiling of open chromatin, DNA-binding proteins and nucleosome position. Nat Methods 10, 1213–1218, doi:10.1038/nmeth.2688 (2013). - DOI - PMC - PubMed
    1. Consortium EP et al. Expanded encyclopaedias of DNA elements in the human and mouse genomes. Nature 583, 699–710, doi:10.1038/s41586-020-2493-4 (2020). - DOI - PMC - PubMed

Publication types

MeSH terms