. 2021 Mar;18(3):272-282.
doi: 10.1038/s41592-020-01050-x. Epub 2021 Feb 15.

Joint probabilistic modeling of single-cell multi-omic data with totalVI

Affiliations

Joint probabilistic modeling of single-cell multi-omic data with totalVI

Adam Gayoso et al. Nat Methods. 2021 Mar.

Abstract

The paired measurement of RNA and surface proteins in single cells with cellular indexing of transcriptomes and epitopes by sequencing (CITE-seq) is a promising approach to connect transcriptional variation with cell phenotypes and functions. However, combining these paired views into a unified representation of cell state is made challenging by the unique technical characteristics of each measurement. Here we present Total Variational Inference (totalVI; https://scvi-tools.org ), a framework for end-to-end joint analysis of CITE-seq data that probabilistically represents the data as a composite of biological and technical factors, including protein background and batch effects. To evaluate totalVI's performance, we profiled immune cells from murine spleen and lymph nodes with CITE-seq, measuring over 100 surface proteins. We demonstrate that totalVI provides a cohesive solution for common analysis tasks such as dimensionality reduction, the integration of datasets with different measured proteins, estimation of correlations between molecules and differential expression testing.


Figures

Extended Data Fig. 1
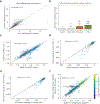
Evaluation of totalVI model. a, Posterior predictive check of coefficient of variation (CV) of genes and proteins. For each of the PBMC10k, MALT, and SLN111-D1 datasets and for each model (totalVI, scVI, factor analysis with normalized input, scHPF) the average coefficient of variation from posterior predictive samples was computed for each feature. Violin plots summarize the distribution of CVs for genes and proteins. Mean absolute error (MAE) between raw data CVs and average posterior predictive CV are reported. b, For each gene and protein, the Mann-Whitney U statistic between posterior predictive samples and observed data averaged over samples. Shown are boxplots of this statistic for each set of features (genes and proteins), model, and dataset (n=4000 genes across datasets and n=14 proteins for PBMC10k and MALT, n=110 proteins for SLN111-D1). Box plots indicate the median (center line), interquartile range (hinges), and whiskers at 1.5x interquartile range. Higher is better.
Extended Data Fig. 2
Evaluation of totalVI model (continued). a, Mean absolute error (MAE) between held out data and posterior predictive mean separated by genes and proteins for each model and dataset. b, Calibration error of held-out data reported separately for genes and proteins. c, Held-out reconstruction loss of RNA for scVI and totalVI. d, e, Stability of held-out results (n=5 initializations) for totalVI on SLN111-D1. Metrics displayed are the (d) Held out MAE, and (e) held out calibration error. Box plots indicate the median (center line), interquartile range (hinges), and whiskers at 1.5x interquartile range. f, Inference time for totalVI and scVI across cells randomly subsampled to different levels from SLN-all. scVI was run with only genes. totalVI was applied with 20 latent dimensions and 100 latent dimensions.
Extended Data Fig. 3
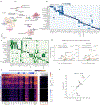
Protein background in cells and empty droplets a–c, Histogram of log(protein counts + 1) in the SLN111-D1 dataset for B cells, T cells, and empty droplets (Methods) for CD19 (a), CD20 (b), and CD28 (c). d-f, Fraction of empty droplets, B cells, or T cells with > 0 UMIs detected for a given RNA (left, hatched) or protein (right, solid). RNA/proteins displayed are Cd19/CD19 (d), Ms4a1/CD20 (e), and Cd28/CD28 (f). g, Barcode rank plot for all barcodes detected in the SLN111-D1 dataset. Red lines at 20 and 100 RNA UMI counts indicate the lower and upper bounds, respectively, used to define empty droplets in (a–f). h, Performance of totalVI and a Gaussian mixture model (GMM) fit on all cells for each protein of the SLN111-D1 dataset to classify cell types by marker proteins (Methods). Receiver operating characteristic (ROC) curves shown for CD19 (B cells), CD20 (B cells), or CD28 (T cells). Area under the receiver operating characteristic curve (ROC AUC score) was calculated using as input either the totalVI foreground probability or GMM foreground probability where the indicated cell type was the positive population out of all B and T cells.
Extended Data Fig. 4
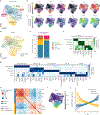
totalVI decouples foreground and background for trimodal protein distributions and denoises protein data a, b, CD4 protein expression in the PBMC10k dataset. (a) Trimodal distribution of log(protein counts + 1). (b) UMAP plot of the totalVI latent space colored by totalVI foreground probability. c-e, UMAP plots of the totalVI latent space for the SLN111-D1 dataset. Plots are colored by log(protein counts+1) (top) and log(totalVI denoised protein+1) (bottom) for CD19 (c), CD20 (d), and CD28 (e). f, g, Distributions of log(protein counts + 1) (f) and log(totalVI denoised protein + 1) (g) for CD19 protein in B and T cells. y-axis is truncated at 3.
Extended Data Fig. 5
RNA-protein correlations a, b, 2d density plots of Pearson correlations between all RNA and protein features in the SLN111-D1 dataset as well as 100 additional genes whose expression was randomly permuted. Correlations between all proteins and the randomly permuted genes are colored in red. Raw correlations were calculated between log library-size normalized RNA and log(protein counts + 1). (a), Naive totalVI correlations were calculated between totalVI denoised RNA and totalVI denoised proteins. (b), totalVI correlations were calculated between denoised RNA and proteins sampled from the posterior (Methods). c, Pearson correlations between each protein and its encoding RNA for all proteins with a unique encoding RNA, colored by the mean probability foreground of the protein across all cells. totalVI correlations were calculated as in (b) and raw correlation were calculated as in (a, b). d-f, Same as (a-c), but for Spearman correlations.
Extended Data Fig. 6
Integration of SLN-all with totalVI-intersect a, b, UMAP plot of SLN-all colored by (a) dataset, and (b) tissue. c, Heatmap of proteins used for annotation. Proteins (columns) are log(protein counts + 1) scaled by column for visualization. d, Dotplot of RNA markers used for annotation. RNA is log library size normalized.
Extended Data Fig. 7
Differential expression analysis a, 2d density plot of totalVI and scVI log Bayes factors for genes. Bayes factors were computed for each gene in one-vs-all tests on the SLN111-D1 dataset. b, Number of isotype controls called differentially expressed in one-vs-all tests (n=27) for totalVI, totalVI-wBG (totalVI test without background removal), Wilcoxon rank-sum, and t-test. Tests were applied to SLN208-D1, for which isotype controls were retained. Box plots indicate the median (center lines), interquartile range (hinges), whiskers at 1.5x interquartile range. Red dashed line indicates the maximum number of isotype controls. c-e, Significance level (Bayes factors for totalVI, adjusted p-value for frequentist tests) for proteins in one-vs-all tests computed on SLN111-D1 and SLN111-D2 for each of (c) totalVI, (d) t-test, (e) Wilcoxon. f, Bayes factors for proteins in one-vs-all tests computed on the SLN111 datasets integrated with and without the SLN111-D2 proteins held-out. Differential expression tests for both model fits were conditioned on SLN111-D1. Bayes factors are colored by the average protein expression from SLN111-D1.
Extended Data Fig. 8
Interpreting totalVI latent dimensions with archetypal analysis. a, b, Heatmap of top (a) gene and (b) protein features for each archetype. The archetype score corresponds to the standard scaled archetypal expression profiles (Methods). Heatmaps are individually column normalized for visualization. c, Fraction of proteins in top archetypal features for each archetype. Features in each archetype were selected in the “top” if they had an archetype score of greater than 2. For these features, we performed a one-sided hypergeometric test to determine if proteins were over-represented in this feature set relative to the global distribution of feature types. Archetypes with over-representation of proteins (one-sided hypergeometric test, BH-adjusted p-value <0.05) are denoted.
Extended Data Fig. 9
Visualization of archetypes in totalVI-intersect model of SLN-all a, UMAP plots of SLN-all cells colored by latent dimension value. b, totalVI protein expression for CD24 and CD93 proteins as a function of distance to archetype 16. c, totalVI denoised expression for Isg20 and Ifit3 genes as a function of distance to archetype 7. Archetype is colored in blue, all other cells in grey.
Extended Data Fig. 10
totalVI identifies correlated modules of RNA and proteins that are associated with the maturation of transitional B cells a, totalVI Spearman correlations in mature B cells between the same RNA and proteins as in Figure 5h. Features were hierarchically clustered within mature B cells. b, UMAP of the totalVI latent space colored by totalVI RNA expression of Rag1. c, totalVI RNA expression of Rag1 as a function of 1 Z16 (the totalVI latent dimension associated with transitional B cells). d, Histogram of Spearman correlations between each feature in (a) and 1 Z16 (n = 2,735 cells).
Figure 1:
Figure 1:. Schematic of a CITE-seq data analysis pipeline with totalVI.
a, A CITE-seq experiment simultaneously measures RNA and surface proteins molecules in single cells, producing paired count matrices for RNA and proteins. These matrices, along with an optional matrix containing sample-level categorical covariates (batch), are the input to totalVI, which concomitantly normalizes the data and learns a joint representation of the data that is suitable for downstream analysis tasks. b, Schematic of totalVI model. The RNA counts, protein counts, and batch for each cell n are jointly transformed by an encoder neural network into the parameters of the posterior distributions for zn, a low-dimensional representation of cell state, βn, the protein background mean indexed by protein, and n, an RNA size factor. The posterior mean of zn, which we refer to as the latent representation, is corrected for batch effects and can be used as input to clustering and visualization algorithms. Next, a decoder neural network maps samples from the posterior distribution of zn, along with the batch, sn, to parameters of a negative binomial distribution for each gene and a negative binomial mixture for each protein, which contains a foreground (FG) and background (BG) component (Methods). These parameters are used for feature-level analyses.
Figure 2:
Figure 2:. totalVI identifies and corrects for protein background.
totalVI was applied to the SLN111-D1 dataset. a-c, CD20 protein (encoded by Ms4a1 RNA). (a) totalVI foreground probability vs log(proteincounts+1). Vertical line denotes protein foreground/background cutoff determined by a GMM. Horizontal lines denote totalVI foreground probability of 0.2 and 0.8. Cells with foreground probability greater than 0.8 or less than 0.2 are colored by quadrant, while the remaining cells are gray. (b) UMAP plots of the totalVI latent space. Each quadrant contains cells from the corresponding quadrant of (a) in color with the remaining cells in gray. (c) RNA expression (log library-size normalized; Methods 4.8) for cells colored in (a). d-f, Same as (a-c), but for CD28 protein (encoded by Cd28 RNA). g, h, Distributions of log(proteincounts+1) (g) and log(totalVIdenoisedprotein+1) (h) for CD20 protein in B cells (blue) and T cells (yellow). y-axis is truncated at 3. i, j, Same as (g, h), but for CD28 protein.
Figure 3:
Figure 3:. Benchmarking of integration methods for CITE-seq data.
a-c, UMAP plots of SLN111-D1 and SLN208-D2 with no integration (PCA of paired data with intersection of protein panels), and after integration with totalVI-intersect, in which the protein panels were intersected, and totalVI-union, in which the unequal protein panels were preserved, colored by dataset. d, e, Performance of integration methods based on four metrics: (d) latent mixing metric, feature retention metric, clustering metric (displayed as point size), and (e) measurement mixing metric (computed for n=4000 genes and n=111 proteins; higher values are better for each; Methods). Box plots indicate the median (center lines), interquartile range (hinges), whiskers at 1.5x interquartile range. f, UMAP plot of SLN111-D1 integrated with SLN111-D2 (proteins held out) by totalVI. g, UMAP plots colored by totalVI imputed and observed protein expression (log scale) of key cell type markers (range 0–99th percentile of held-out values for each protein). h, Root mean squared error (RMSLE) of imputed versus observed protein expression (log scale) for totalVI-union and Seurat v3. totalVI performance per protein is presented as mean RMSLE with error bars representing 95% confidence intervals of the mean estimate (n=30 model initializations). Proteins colored in black are not significantly different in performance, while those in red are significantly different (two-sided Student’s t-test, BH-adjusted p-value < 0.05). Inset displays ratio in performance across proteins for totalVI and Seurat v3.
Figure 4:
Figure 4:. totalVI identifies differentially expressed genes and proteins.
totalVI intersect was applied to the SLN-all dataset. a, UMAP plot of SLN-all, after clustering and annotating the data (Methods 4.11). b, c, Heatmap of markers derived from one-vs-all tests for (b) RNA and (c) proteins. For each cell type, we display the top three protein markers and top two RNA markers in terms of LFC. d, Volcano plot of protein differential expression test between ICOS-high Tregs and CD4 T cells for a Welch’s t-test and Wilcoxon rank-sum test. Putative positives and negatives are denoted by green and orange arrows, respectively. Significant proteins (BH-adjusted p-value < 0.05) are colored in grey, all others are in black. e, totalVI protein expression for proteins (columns) upregulated in ICOS-high Tregs versus CD4 T cells. Cells (rows) are ordered by cluster, and subsampled to be equal in number per cluster. Columns are normalized in the range [0, 1]. The left section in the heatmap contains all the proteins called differentially expressed by totalVI with a positive log fold change. Proteins are sorted by Bayes factor (significance). The rightmost section contains the putative negatives, which are not called differentially expressed by totalVI. f, Comparison of log fold changes estimated by totalVI and observed in the raw data from a one-vs-all test of CD4 T cells.
Figure 5:
Figure 5:. Characterization of B cell heterogeneity in the spleen and lymph nodes with RNA and protein.
totalVI-intersect was applied to the SLN-all dataset. Data were filtered to include B cells. a, UMAP plot of totalVI latent space labeled by cell type. b, c, UMAP plots of totalVI latent space colored by (b) totalVI protein expression of six marker proteins and (c) totalVI RNA expression of the six genes that encode the corresponding proteins in (b). d, UMAP plot of totalVI latent space labeled by tissue. e, Cell type composition per tissue. f, g, totalVI one-vs-all differential expression test on B cell subsets filtered for significance (Methods) and sorted by the totalVI median LFC. (f) The top three differentially expressed proteins per subset and (g) the top ten differentially expressed genes per subset, arranged by the subset in which the LFC is highest. h, totalVI Spearman correlations in transitional B cells between RNA and proteins, which were selected as described in Methods. Features were hierarchically clustered and are labeled as either RNA or protein, and by the cell type with which the feature is associated. i, UMAP plot of totalVI latent space colored by Z16 (the totalVI latent dimension associated with transitional B cells). j, totalVI expression of features in (h) as a function of (1Z16). Each feature was standard scaled and smoothed with a loess curve.

References

    1. Stubbington MJT, Rozenblatt-Rosen O, Regev A & Teichmann SA Single-cell transcriptomics to explore the immune system in health and disease. Science 358, 58–63 (2017). - PMC - PubMed
    1. Papalexi E & Satija R Single-cell RNA sequencing to explore immune cell heterogeneity. Nature Reviews Immunology (2017) 10.1038/nri.2017.76. - DOI - PubMed
    1. Labib M & Kelley SO Single-cell analysis targeting the proteome. Nature Reviews Chemistry 4, 143–158 (2020). - PubMed
    1. Wagner A, Regev A & Yosef N Revealing the vectors of cellular identity with single-cell genomics. Nature Biotechnology (2016) 10.1038/nbt.3711. - DOI - PMC - PubMed
    1. Efremova M & Tiechmann SA Computational methods for single-cell omics across modalities. Nature Methods (2020). - PubMed

Publication types