Meta-Analysis
. 2021 Mar;53(3):392-402.
doi: 10.1038/s41588-020-00776-w. Epub 2021 Feb 15.

Genome-wide meta-analysis, fine-mapping and integrative prioritization implicate new Alzheimer's disease risk genes

Affiliations
Meta-Analysis

Genome-wide meta-analysis, fine-mapping and integrative prioritization implicate new Alzheimer's disease risk genes

Jeremy Schwartzentruber et al. Nat Genet. 2021 Mar.

Erratum in

Abstract

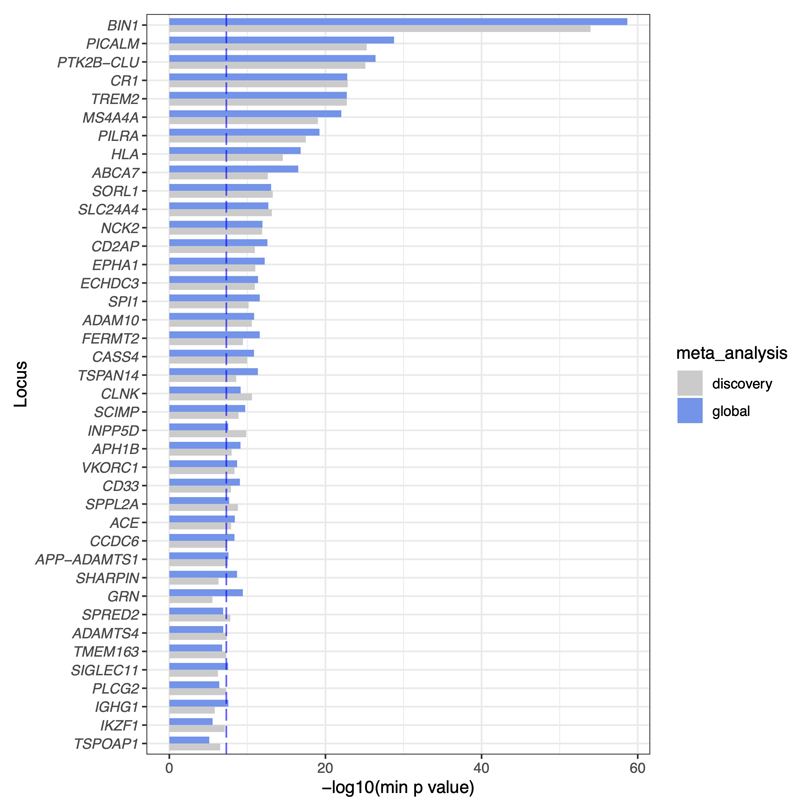
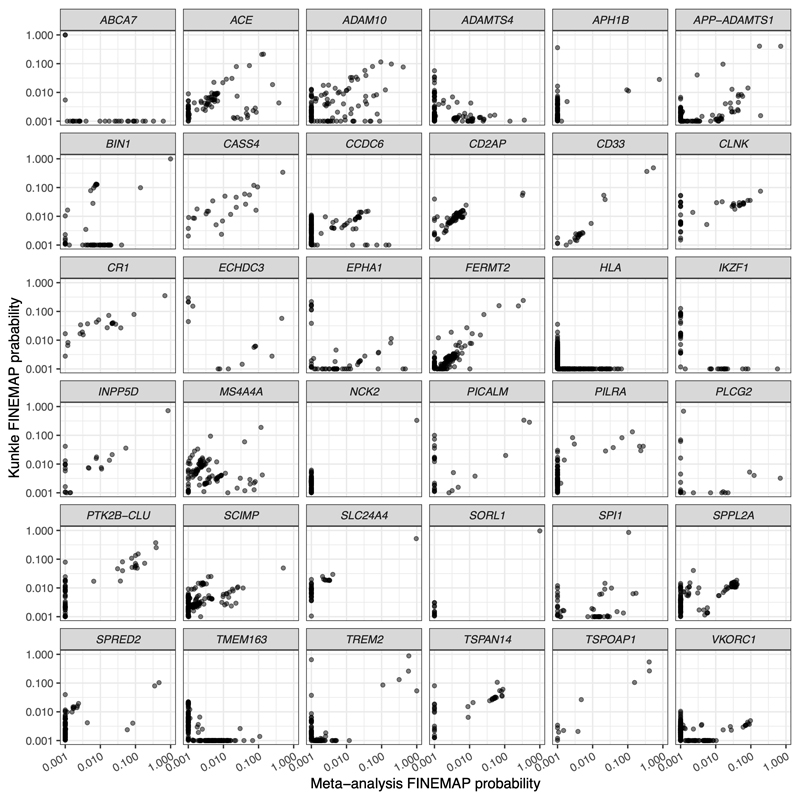
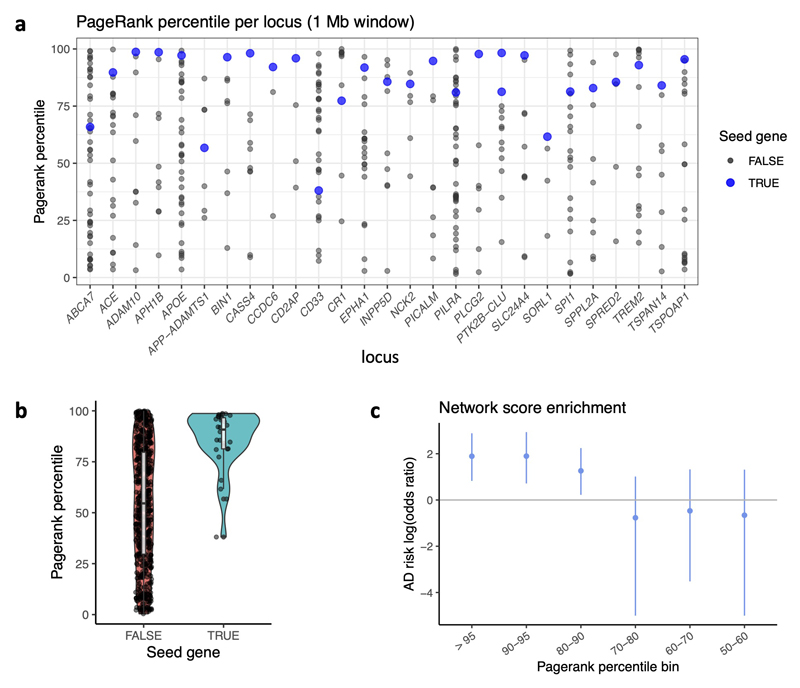
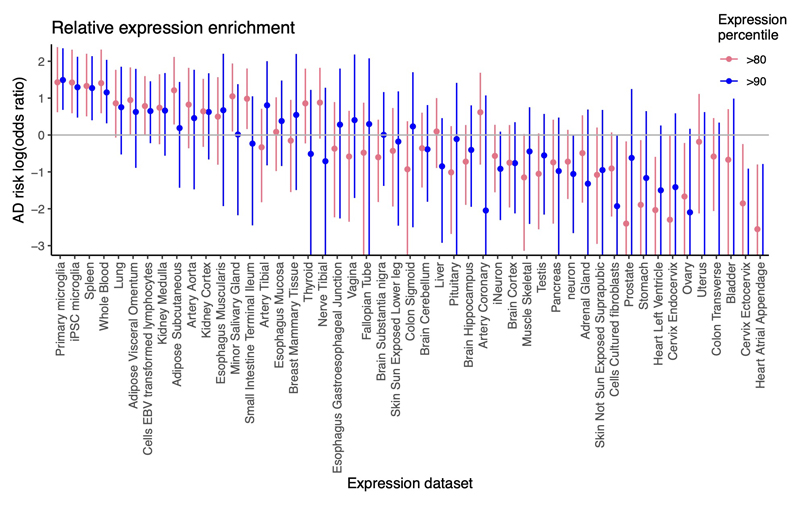
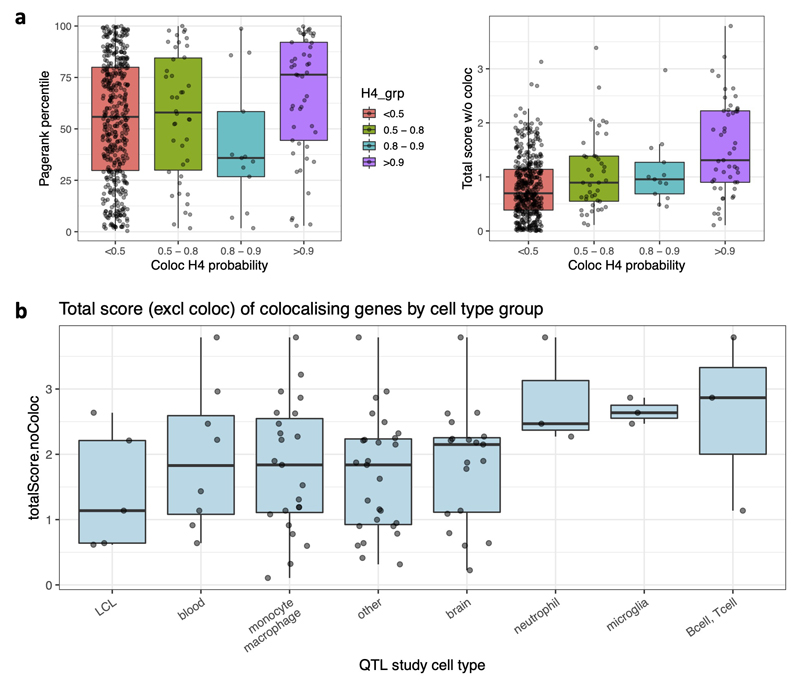
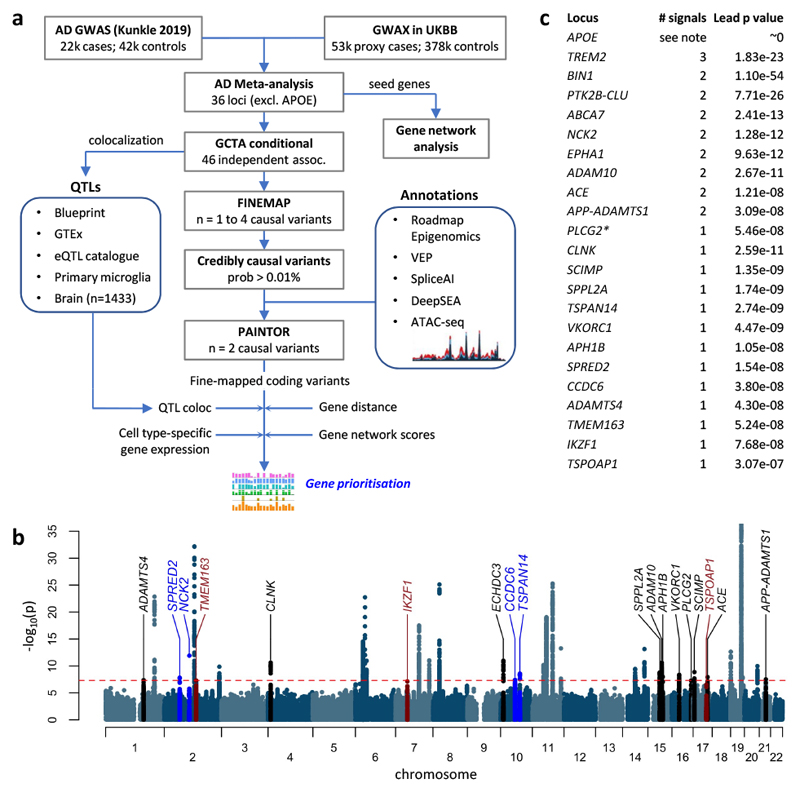
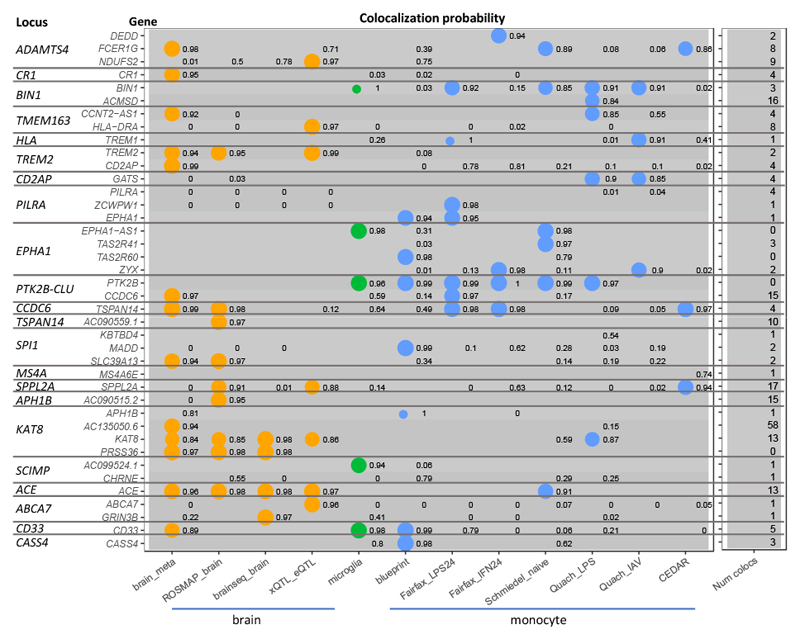
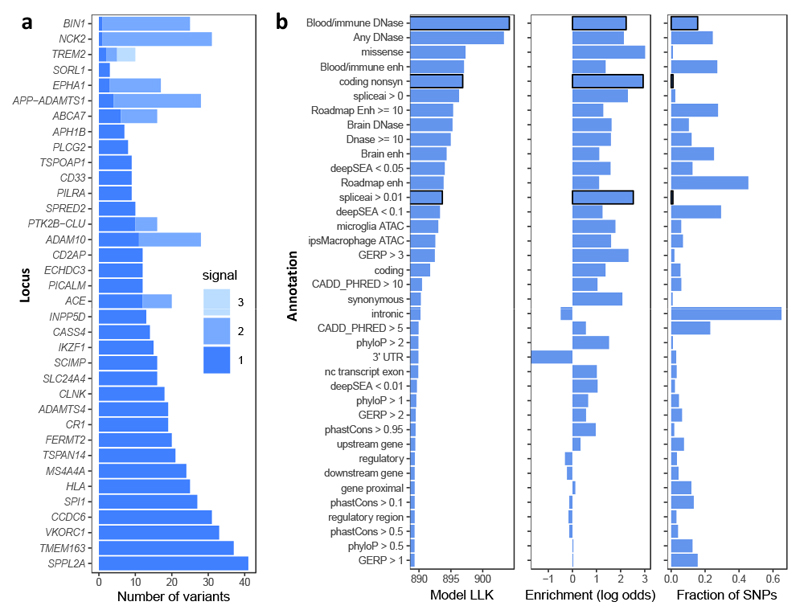
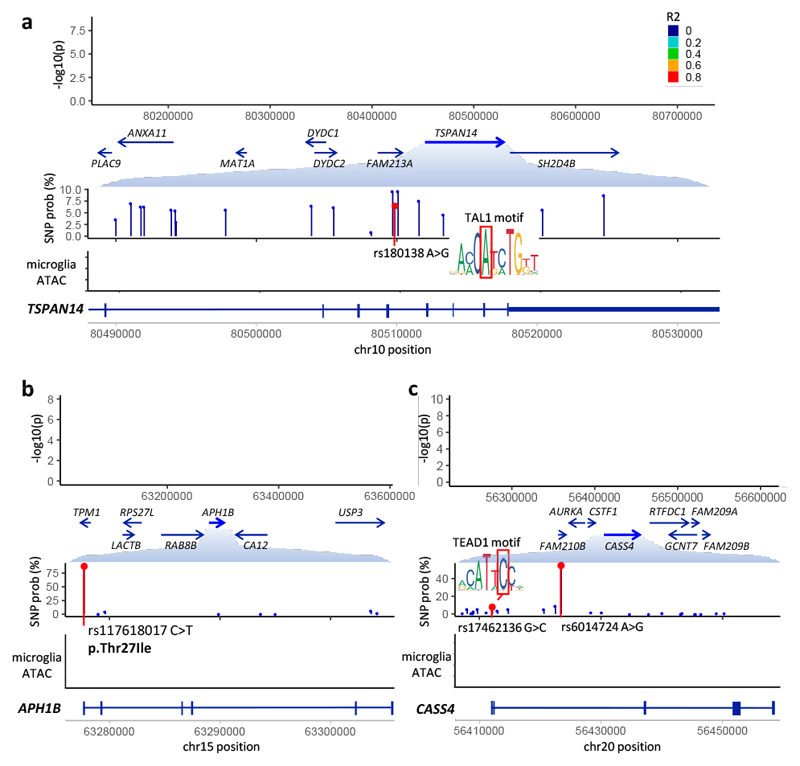
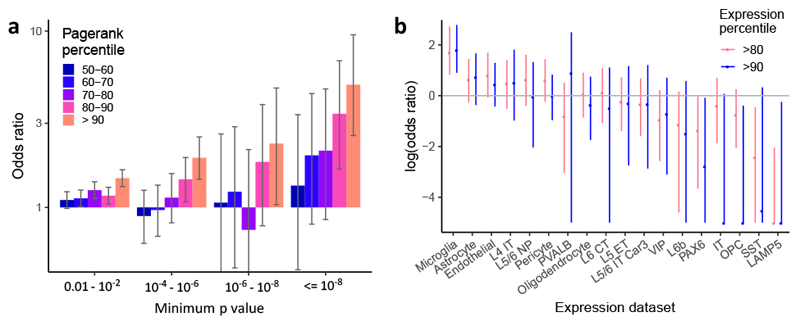
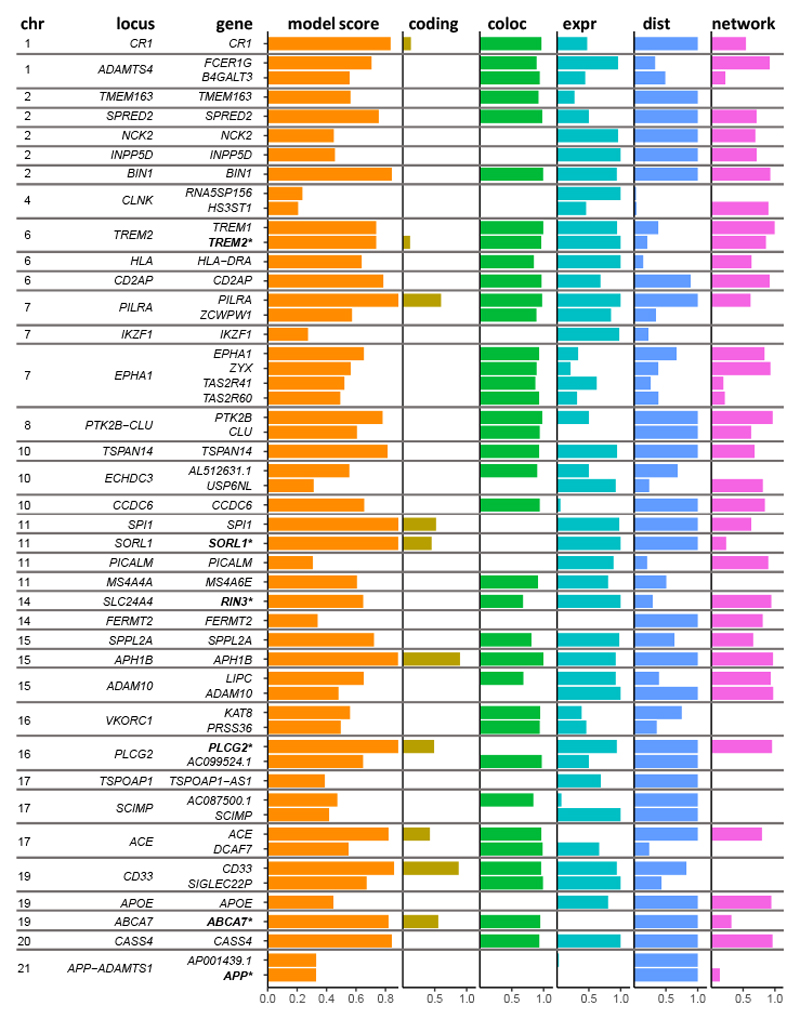
Genome-wide association studies have discovered numerous genomic loci associated with Alzheimer's disease (AD); yet the causal genes and variants are incompletely identified. We performed an updated genome-wide AD meta-analysis, which identified 37 risk loci, including new associations near CCDC6, TSPAN14, NCK2 and SPRED2. Using three SNP-level fine-mapping methods, we identified 21 SNPs with >50% probability each of being causally involved in AD risk and others strongly suggested by functional annotation. We followed this with colocalization analyses across 109 gene expression quantitative trait loci datasets and prioritization of genes by using protein interaction networks and tissue-specific expression. Combining this information into a quantitative score, we found that evidence converged on likely causal genes, including the above four genes, and those at previously discovered AD loci, including BIN1, APH1B, PTK2B, PILRA and CASS4.


Conflict of interest statement

Competing interests

J.Z.L. was an employee of Biogen at the time of the study, and is now an employee of GSK. D.J.G. is an employee of Genomics Plc. T.J. is an employee of GSK. K.E. is an employee of BioMarin Pharmaceutical.

Figures

Extended Data Fig. 1
Extended Data Fig. 1. Association of AD loci in discovery + replication (“global”) meta-analysis
Association of AD loci in discovery + replication dataset (“global”) meta-analysis. For most loci, association significance is increased in the global meta-analysis (blue bars) relative to the discovery analysis (grey bars). The dashed vertical line shows P = 5 x 10⁻⁸. P-values were computed by inverse variance weighted meta-analysis, and bars show the -log10(P) for the SNP with minimum P value at the locus in either the discovery or global meta-analysis.
Extended Data Fig. 2
Extended Data Fig. 2. Comparison of fine-mapping in the meta-analysis vs. Kunkle et al.
Comparison of fine-mapping in the meta-analysis vs. Kunkle et al. Scatterplots showing, for each locus, SNP probabilities from FINEMAP applied to either the Kunkle et al. + UK Biobank meta-analysis (x-axis), or to only Kunkle et al. The number of causal variants at each locus was set to the number detected by GCTA in the meta-analysis. For most of the 36 loci, SNP probabilities are well correlated. For a few loci that are well powered in Kunkle et al., this is not the case, namely ABCA7, EPHA1, ECHDC3, and HLA. For these loci, fine-mapping results should be interpreted with caution. Six other loci are not well correlated (ADAMTS4, APH1B, IKZF1, PLCG2, TMEM163, and VKORC1), but these loci are poorly powered in Kunkle et al. (lead P values 2.1 x 10⁻⁶ to 2.1 x 10⁻³).
Extended Data Fig. 3
Extended Data Fig. 3. Network enrichment
a, The Pagerank percentile of all genes (within 500 kb) at each AD GWAS locus containing a seed gene is shown, with seed genes highlighted in blue. b, A violin/boxplot shows that seed genes have a markedly higher network Pagerank percentile than remaining genes (P = 2.4 x 10⁻⁹, one-tailed Wilcoxon rank sum test). c, Log odds ratio enrichment of AD risk among SNPs nearest to genes with network Pagerank percentile in different bins, determined using fgwas (whiskers represent 95% confidence intervals).
Extended Data Fig. 4
Extended Data Fig. 4. Gene expression enrichments
Expression enrichments for GTEx + microglia. Shown are the log odds ratio enrichments of AD risk among SNPs with relative gene expression in each tissue above the 80th (or 90th) percentile across tissues. Whiskers represent 95% confidence intervals determined by fgwas.
Extended Data Fig. 5
Extended Data Fig. 5. Colocalization scores
a, Genes with maximum colocalization H4 probability >0.9 have higher Pagerank percentile (left boxplot) and higher total score (sum of the four non-coloc predictors, right boxplot) than do genes without colocalisation (<0.5). Genes with intermediate colocalisation evidence (bins 0.5 - 0.8 and 0.8 - 0.9) show little evidence of having higher scores by the other metrics. Based on this, we chose a maxColoc probability of 0.9 as the lower bound for our colocalization score. b, Boxplot of the total score (excluding coloc) for genes that have a colocalisation probability > 0.9 in at least one QTL dataset within each tissue group. The most significant difference is between totalScore for genes with microglial colocalizations vs. the genes with colocalization in “other” tissues (non-immune GTEx tissues), but the for a difference is weak (P = 0.041, Wilcoxon rank sum test). In all cases, boxplots show the 25th, median, and 75th percentile of the distribution, with whiskers extending to the largest (and smallest) value no further than 1.5 times the interquartile range from the boxplot hinge.
Extended Data Fig. 6
Extended Data Fig. 6. Gene distance score
The distance score assigned to genes near an AD GWAS peak, which decreases approximately linearly (past a distance of 1 kb) with increasing log-scaled distance up to 500 kb.
Figure 1
Figure 1. Analysis overview.
a, Summary of AD meta-analysis and data processing steps. b, Manhattan plot of the meta-analysis of GWAS for diagnosed AD and our GWAX in UK Biobank. Novel genome-wide significant loci are labelled in blue, sub-threshold loci in red, and recently discovered loci,, replicated in our analysis in black. c, The number of independent signals at each locus which is either recently discovered or which has more than one signal, as well as the meta-analysis P value the lead SNP at the locus. *The PLCG2 locus was significant (P < 5 x 10⁻⁸) when including Kunkle stage 3 SNPs. Conditional analyses were not done at APOE due to the strength of the signal (see Methods).
Figure 2
Figure 2. Colocalization with eQTLs.
For genes with the top overall colocalization scores across AD risk loci, the colocalization probability (H4) is shown for selected brain, microglia, and monocyte eQTL datasets. For three loci with multiple signals (BIN1, EPHA1, PTK2B-CLU), scores are shown separately for the conditionally independent signals. The last column shows, for each gene, the number of eQTL datasets with a colocalization probability above 0.8 (Supplementary Tables 5 and 6).
Figure 3
Figure 3. Fine-mapping summary.
a, Number of variants with mean causal probability > 1% for each independent signal. Variant counts for independent signals are shown in different shades. b, PAINTOR outputs, showing (left) log-likelihood (LLK) of model for each individual annotation; (middle) log-odds enrichments for individual genomic annotations determined by PAINTOR; (right) fraction of SNPs which are in each annotation (among those selected by FINEMAP probability > 0.01%). Annotations selected for the final model are shown with a black border.
Figure 4
Figure 4. Fine-mapped variants.
a, SNP rs1870138 in an intron of TSPAN14 disrupts an invariant position of a TAL1 motif. b, Missense SNP rs117618017 in exon 1 of APH1B. c, SNP rs17462136 in the 5’ UTR of CASS4 introduces a TEAD1 motif. Each panel shows (top) locus plot with GWAS P-values, SNP color representing LD to the lead SNP; (middle) expanded view of a subregion showing the mean SNP probabilities from fine-mapping; (bottom) read density of ATAC-sequencing assay from primary microglia.
Figure 5
Figure 5. Genome-wide network and gene expression enrichments.
a, Enrichment of low GWAS P values within 10 kb of genes having high vs. low network pagerank percentile (low defined as below 50th percentile). Whiskers represent 95% confidence intervals based on Fisher’s exact test for n = 18,055 genes. b, Enrichment of AD risk near genes with high expression in each brain cell type (above 80th or 90th percentile) relative to the other cell types. Cell types are defined based on single-cell clusters defined in Hodge et al.. Neuronal cells are defined either by cortical layer (L4, L5, L6), and/or by projection target (IT, intratelencephalic; CT, corticothalamic; ET, extratelencephalic-pyramidal tract; NP, near-projecting), or by binary marker genes (LAMP5, PAX6, PVALB, VIP, SST). OPC, oligodendrocyte precursor cells. Whiskers represent 95% confidence intervals as determined by fgwas.
Figure 6
Figure 6. Gene evidence summary.
The top gene at each locus is shown, as well as the next 13 top genes by model score; for three loci where a non-coding gene was the top scoring, we also show the top scoring protein-coding gene. Score components for each gene are indicated by colored bars, and points show the distribution of scores for all genes within 500 kb at the locus. Bold gene names are those with evidence of causality based on rare variants from other studies. Scores for all genes are listed in Supplementary Table 13.

Comment in

References

    1. Liu JZ, Erlich Y, Pickrell JK. Case-control association mapping by proxy using family history of disease. Nat Genet. 2017;49:325–331. - PubMed
    1. Marioni RE, et al. GWAS on family history of Alzheimer’s disease. Transl Psychiatry. 2018;8:99. - PMC - PubMed
    1. Jansen IE, et al. Genome-wide meta-analysis identifies new loci and functional pathways influencing Alzheimer’s disease risk. Nat Genet. 2019;51:404–413. - PMC - PubMed
    1. Claussnitzer M, et al. FTO obesity variant circuitry and adipocyte browning in humans. N Engl J Med. 2015;373:895–907. - PMC - PubMed
    1. Sekar A, et al. Schizophrenia risk from complex variation of complement component 4. Nature. 2016;530:177–183. - PMC - PubMed

Publication types

LinkOut - more resources