Multicenter Study
. 2021 Mar;53(3):294-303.
doi: 10.1038/s41588-021-00785-3. Epub 2021 Feb 15.

Genome sequencing analysis identifies new loci associated with Lewy body dementia and provides insights into its genetic architecture

Ruth Chia #  1 Marya S Sabir #  2 Sara Bandres-Ciga  3 Sara Saez-Atienzar  1 Regina H Reynolds  4   5   6 Emil Gustavsson  5   6 Ronald L Walton  7 Sarah Ahmed  2 Coralie Viollet  8   9 Jinhui Ding  10 Mary B Makarious  2 Monica Diez-Fairen  11 Makayla K Portley  2 Zalak Shah  2 Yevgeniya Abramzon  1   12 Dena G Hernandez  3 Cornelis Blauwendraat  3 David J Stone  13 John Eicher  14 Laura Parkkinen  15 Olaf Ansorge  15 Lorraine Clark  16 Lawrence S Honig  17 Karen Marder  17 Afina Lemstra  18 Peter St George-Hyslop  19   20 Elisabet Londos  21 Kevin Morgan  22 Tammaryn Lashley  4   23 Thomas T Warner  12   23 Zane Jaunmuktane  23 Douglas Galasko  24   25 Isabel Santana  26   27   28   29 Pentti J Tienari  30   31 Liisa Myllykangas  32   33 Minna Oinas  34 Nigel J Cairns  35 John C Morris  35 Glenda M Halliday  36   37   38 Vivianna M Van Deerlin  39 John Q Trojanowski  39 Maurizio Grassano  1   40 Andrea Calvo  40   41 Gabriele Mora  42 Antonio Canosa  40   41 Gianluca Floris  43 Ryan C Bohannan  44 Francesca Brett  45 Ziv Gan-Or  46 Joshua T Geiger  2 Anni Moore  10 Patrick May  47 Rejko Krüger  47   48   49 David S Goldstein  50 Grisel Lopez  51 Nahid Tayebi  51 Ellen Sidransky  51 American Genome CenterLucy Norcliffe-Kaufmann  52 Jose-Alberto Palma  52 Horacio Kaufmann  52 Vikram G Shakkottai  53 Matthew Perkins  54 Kathy L Newell  55 Thomas Gasser  56 Claudia Schulte  56 Francesco Landi  57 Erika Salvi  58 Daniele Cusi  59 Eliezer Masliah  60 Ronald C Kim  61 Chad A Caraway  62 Edwin S Monuki  63 Maura Brunetti  40 Ted M Dawson  64   65   66   67 Liana S Rosenthal  64 Marilyn S Albert  64 Olga Pletnikova  68   69 Juan C Troncoso  68 Margaret E Flanagan  70   71 Qinwen Mao  70   71 Eileen H Bigio  70   71 Eloy Rodríguez-Rodríguez  72 Jon Infante  72 Carmen Lage  72 Isabel González-Aramburu  72 Pascual Sanchez-Juan  72 Bernardino Ghetti  55 Julia Keith  73 Sandra E Black  74   75   76   77   78 Mario Masellis  77   78   79   80 Ekaterina Rogaeva  81 Charles Duyckaerts  82   83 Alexis Brice  83 Suzanne Lesage  83 Georgia Xiromerisiou  84 Matthew J Barrett  85 Bension S Tilley  86 Steve Gentleman  86 Giancarlo Logroscino  87   88 Geidy E Serrano  89 Thomas G Beach  89 Ian G McKeith  90 Alan J Thomas  90 Johannes Attems  90 Christopher M Morris  90 Laura Palmer  91 Seth Love  92 Claire Troakes  93 Safa Al-Sarraj  94 Angela K Hodges  93 Dag Aarsland  93   95 Gregory Klein  96 Scott M Kaiser  97 Randy Woltjer  98 Pau Pastor  11 Lynn M Bekris  99 James B Leverenz  100 Lilah M Besser  101 Amanda Kuzma  102 Alan E Renton  103 Alison Goate  104 David A Bennett  96 Clemens R Scherzer  105 Huw R Morris  106 Raffaele Ferrari  4 Diego Albani  107 Stuart Pickering-Brown  108 Kelley Faber  109 Walter A Kukull  110 Estrella Morenas-Rodriguez  111   112   113 Alberto Lleó  112   113 Juan Fortea  112   113 Daniel Alcolea  112   113 Jordi Clarimon  112   113 Mike A Nalls  114   115   116 Luigi Ferrucci  117 Susan M Resnick  118 Toshiko Tanaka  117 Tatiana M Foroud  109 Neill R Graff-Radford  119 Zbigniew K Wszolek  119 Tanis Ferman  120 Bradley F Boeve  121 John A Hardy  4   12   122   123   124 Eric J Topol  125 Ali Torkamani  125 Andrew B Singleton  3   116 Mina Ryten  5   6 Dennis W Dickson  7 Adriano Chiò  40   41   126 Owen A Ross  7   127 J Raphael Gibbs  10 Clifton L Dalgard  128   129 Bryan J Traynor  1   12   64 Sonja W Scholz  130   131
Collaborators, Affiliations
Multicenter Study

Genome sequencing analysis identifies new loci associated with Lewy body dementia and provides insights into its genetic architecture

Ruth Chia et al. Nat Genet. 2021 Mar.

Abstract

The genetic basis of Lewy body dementia (LBD) is not well understood. Here, we performed whole-genome sequencing in large cohorts of LBD cases and neurologically healthy controls to study the genetic architecture of this understudied form of dementia, and to generate a resource for the scientific community. Genome-wide association analysis identified five independent risk loci, whereas genome-wide gene-aggregation tests implicated mutations in the gene GBA. Genetic risk scores demonstrate that LBD shares risk profiles and pathways with Alzheimer's disease and Parkinson's disease, providing a deeper molecular understanding of the complex genetic architecture of this age-related neurodegenerative condition.


Figures

Extended Data Fig. 1
Extended Data Fig. 1. BIN1 and TMEM175 genotype-phenotype analysis
Relationship between BIN1 and TMEM175 genotypes and the presence of Alzheimer’s disease co-pathology in definite LBD cases. The color gradation refers to semi-quantitative pathological measures of neuritic plaques (assessed by CERAD method) and neurofibrillary tangles (assessed by Braak stage). Darker colors refer to higher burden of pathology. Homozygous BIN1 risk allele carriers (TT) were found to have significantly increased neurofibrillary tangle pathology compared to homozygous major allele carriers (CC; Fisher’s exact test P-value on Braak staging = 0.0002). Although the proportion of LBD cases that had high neuritic plaque burden was higher in homozygous risk allele carries compared to homozygous major allele carries, the difference between these groups was not statistically significant (P = 0.23). There was no association of TMEM175 risk allele dosage and Alzheimer’s disease co-pathology, though a trend toward lower Alzheimer’s disease co-pathology was observed among homozygous TMEM175 risk allele carriers.
Extended Data Fig. 2
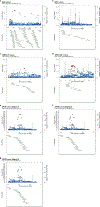
Extended Data Fig. 2. Regional association plots
a-g, Regional association plots, local linkage disequilibrium, and recombination rates at the significantly associated LBD GWAS risk signals. Regional associations are plotted as a function of their genomic position, denoting the index variant by a red diamond. Single nucleotide variants or indels surrounding the index variant are color-coded to reflect the strength of linkage disequilibrium with the index variant based on pairwise r2-values in the study cohort (red, 1.0 ≥ r2 ≥ 0.8; orange, 0.8 > r2 ≥ 0.6; green 0.6 > r2 ≥ 0.4; light blue, 0.4 > r2 ≥ 0.2; dark blue, 0.2 > r2 ≥ 0; gray, no r2 value available). Transcript annotations according to the University of California Santa Cruz genome browser are depicted under each association plot.
Extended Data Fig. 3
Extended Data Fig. 3. Conditional analysis
a-f, Conditional analyses for all genome-wide significant GWAS signals are depicted. For each panel, the x-axis denotes the chromosomal position in build 38, and the y-axis indicates the association P-values on a −log10 scale. The unconditioned GWAS signal is shown in the upper pane of each panel, while the lower pane illustrates the association results after correction for the index variant(s) at each respective signal. This analysis demonstrated two signals at the APOE locus (e, f). The locus name is based on the closest gene to the index variant.
Extended Data Fig. 4
Extended Data Fig. 4. Sensitivity analyses
a,b, Sensitivity analyses of colocalization between eQTLs regulating TMEM175 expression and LBD GWAS signals (a) and SNCA-AS1 expression and LBD GWAS signals (b). eQTLs for TMEM175 were derived from eQTL-Gen, while eQTLs for SNCA-AS1 were derived from PsychENCODE. Plots of prior (left) and posterior (right) probabilities for H0-H4 hypotheses across varying p12 priors are shown. A dashed vertical line indicates the value of p12 used in the initial analysis (p12 = 5 × 10⁻⁶). The green shaded areas in these plots show the regions for which the posterior probability of H4 ≥ 0.90 would still be supported. Abbreviations: H0, hypothesis 0 (no association with either trait); H1, hypothesis 1 (association with trait 1, not with trait 2); H2, hypothesis 2 (association with trait 2, not with trait 1); H3, hypothesis 3 (association with trait 1 and trait 2, two independent SNPs); H4, hypothesis 4 (association with trait 1 and trait 2, one shared SNP).
Extended Data Fig. 5
Extended Data Fig. 5. GWAS variants correlate with increased SNCA-AS1 expression
Shown here are genome-wide significant SNPs that decrease risk for LBD and their correlation with increased SNCA-AS1 expression. a, Scatterplot of beta coefficients and association P-values (on a -log10 scale) for SNPs shared between the LBD GWAS (left) and PsychENCODE (right). The SNPs represented in this plot are those that are eQTLs regulating SNCA-AS1 expression. The top SNP in the LBD GWAS (as determined by the lowest association test P-value) is indicated in both scatterplots by a red point. The dashed line represents the cut-off for genome-wide significance (5 × 10⁻⁸). b, Scatterplot of SNPs shared between the LBD GWAS and PsychENCODE, which pass genome-wide significance in the LBD GWAS. Spearman’s rho (R) and associated P-value are displayed.
Extended Data Fig. 6
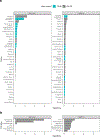
Extended Data Fig. 6. Tissue and cell-type specificity of SNCA-AS1 and TMEM175
a,b, Plot of SNCA-AS1 and TMEM175 specificity in 35 human tissues (GTEx dataset) (a) and seven broad categories of cell types derived from human middle temporal gyrus (Allen Institute for Brain Science dataset) (b). Tissues are colored by whether they belong to the brain. In all plots, tissues and cell types have been ordered by specificity.
Extended Data Fig. 7
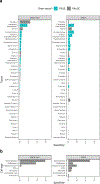
Extended Data Fig. 7. Tissue and cell-specificity of SNCA-AS1 and SNCA
a,b, Plots of SNCA-AS1 and SNCA specificity in 35 human tissues (GTEx dataset) (a) and seven broad categories of cell types derived from human middle temporal gyrus (Allen Institute for Brain Science dataset) (b). Tissues are colored by whether they belong to the brain. In all plots, tissues and cell types have been ordered by specificity.
Extended Data Fig. 8
Extended Data Fig. 8. LBD polygenic risk score is associated with dementia severity
Dementia severity score proportions (measured by the Clinical Dementia Rating scale) at baseline evaluation relative to LBD polygenic risk score quintiles. LBD patients in the highest quintile had significantly more severe cognitive impairment at baseline compared to cases in the lowest quintile (χ2 = 5.60, df = 1, test P-value = 0.009).
Extended Data Fig. 9
Extended Data Fig. 9. Principal components analysis and QQ plot
Quality control metrics of GWAS data. a, Population structure is shown by plotting the first two principal components of the study cohorts (n = 2,591 LBD cases and n = 4,027 controls) compared to the HapMap3 Genome Reference panel. b, Quantile-quantile (QQ) plot of single-variant associations depicting observed (y-axis) versus expected P-values (x-axis). The sample size adjusted genomic inflation factor λ1000 was 1.004.
Extended Data Fig. 10
Extended Data Fig. 10. Quality control metrics
This figure depicts quality control metrics of the genome data across study cohorts. a, Heterozygous-to-homozygous single nucleotide variant (SNV) ratios. b, Mean coverage across the study cohorts.
Fig. 1 |
Fig. 1 |. Analysis workflow.
Schematic illustration of the analytical workflow.
Fig. 2 |
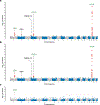
Fig. 2 |. Genome-wide representation of common and rare variant associations in LBD.
a-c, Manhattan plots depicting the GWAS results (n = 2,591 cases and 4,027 controls; MAF > 1%) (a), the GWAS subanalysis of pathologically confirmed LBD cases only (n = 1,789) versus controls (n = 4,027) (b), and gene-based genome-wide SKAT-O test associations of rare missense variants (MAF ≤ 1%, MAC ≥ 3) (c). The x-axis denotes the chromosomal position for all 22 autosomes in hg38, and the y-axis indicates the association P-values on a −log10 scale. Each dot in a and b indicates a single-nucleotide variant or indel, while each dot in c corresponds to a gene. Red dots highlight genome-wide significant signals, while suggestive variants are indicated with orange dots. A dashed line shows the conservative Bonferroni threshold for genome-wide significance. For a and b, the gene with the closest proximity to the top variant at each significant locus is listed. Green font was used to highlight known LBD risk loci, while black font indicates novel association signals.
Fig. 3 |
Fig. 3 |. Regional association plots for eQTL and LBD GWAS colocalizations.
a,b, Regional association plots for eQTL (upper pane) and LBD GWAS signals (lower pane) in the regions surrounding TMEM175 (PPH4 = 0.99) (a) and SNCA-AS1 (PPH4 = 0.96) (b). The x-axis denotes the chromosomal position in hg19, and the y-axis indicates the association P-values on a −log10 scale.
Fig. 4 |
Fig. 4 |. Genetic risk scores from Alzheimer’s disease and Parkinson’s disease GWAS studies illustrate intersecting molecular genetic risk profiles with LBD.
Alzheimer’s disease and Parkinson’s disease genetic risk scores predict risk for LBD and highlight overlapping molecular risk profiles. a, Violin plots comparing z-transformed Alzheimer’s disease genetic risk score distributions in LBD cases, controls, and 100 random Alzheimer’s disease cases. b, Violin plots comparing z-transformed Parkinson’s disease genetic risk score distributions for LBD cases, controls, and 100 random Parkinson’s disease cases. The center line of each violin plot is the median, the box limits depict the interquartile range, and whiskers correspond to the 1.5x interquartile range. Abbreviations: GRS, genetic risk score; AD, Alzheimer’s disease; PD, Parkinson’s disease.
Fig. 5 |
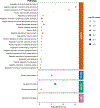
Fig. 5 |. Insights into LBD pathways based on polygenic risk score enrichment analysis.
Functional enrichment analyses of the LBD polygenic risk scores. The x-axis corresponds to the enrichment category in LBD cases compared to controls, and the y-axis shows the enrichment percentages of significant associations after multiple testing correction. The enrichment percentage refers to the percentage of input genes/variants that are within in a given pathway. Significant gene ontology (GO) enrichments for biological processes (BP, orange), cellular functions (CC, blue), molecular functions (MP, green), and pathways from WikiPathways (WP, pink) are shown. The size of each respective dot indicates the P-values on a −log10 scale.

Comment in

References

    1. Walker Z, Possin KL, Boeve BF & Aarsland D Lewy body dementias. Lancet 386, 1683–1697 (2015). - PMC - PubMed
    1. McKeith IG et al. Diagnosis and management of dementia with Lewy bodies: Fourth consensus report of the DLB Consortium. Neurology 89, 88–100 (2017). - PMC - PubMed
    1. Meeus B, Theuns J & Van Broeckhoven C The genetics of dementia with Lewy bodies: what are we missing? Arch. Neurol. 69, 1113–1118 (2012). - PubMed
    1. https://www.lbda.org/page/what-lbd.
    1. Guerreiro R et al. Investigating the genetic architecture of dementia with Lewy bodies: a two-stage genome-wide association study. Lancet Neurol. 17, 64–74 (2018). - PMC - PubMed

Methods-only References

    1. Erikson GA et al. Whole-genome sequencing of a healthy aging cohort. Cell 165, 1002–1011 (2016). - PMC - PubMed
    1. Emre M et al. Clinical diagnostic criteria for dementia associated with Parkinson’s disease. Mov. Disord 22, 1689–1707 (2007). - PubMed
    1. Savica R et al. Incidence of dementia with Lewy bodies and Parkinson disease dementia. JAMA Neurol. 70, 1396–1402 (2013). - PMC - PubMed
    1. Regier AA et al. Functional equivalence of genome sequencing analysis pipelines enables harmonized variant calling across human genetics projects. Nat. Commun 9, 4038 (2018). - PMC - PubMed
    1. Van der Auwera GA et al. From FastQ data to high confidence variant calls: the Genome Analysis Toolkit best practices pipeline. Curr. Protoc. Bioinformatics 43, 11 10 1–11 10 33 (2013). - PMC - PubMed

Publication types

MeSH terms

Grants and funding