. 2021 Mar 12;2(3):281-295.e4.
doi: 10.1016/j.medj.2021.02.001. Epub 2021 Feb 10.

Persistence of SARS-CoV-2-specific B and T cell responses in convalescent COVID-19 patients 6-8 months after the infection

Affiliations

Persistence of SARS-CoV-2-specific B and T cell responses in convalescent COVID-19 patients 6-8 months after the infection

Natalia Sherina et al. Med. .

Abstract

Background: Monitoring the adaptive immune responses during the natural course of severe acute respiratory syndrome coronavirus-2 (SARS-CoV-2) infection provides useful information for the development of vaccination strategies against this virus and its emerging variants. We thus profiled the serum anti-SARS-CoV-2 antibody (Ab) levels and specific memory B and T cell responses in convalescent coronavirus disease 2019 (COVID-19) patients.

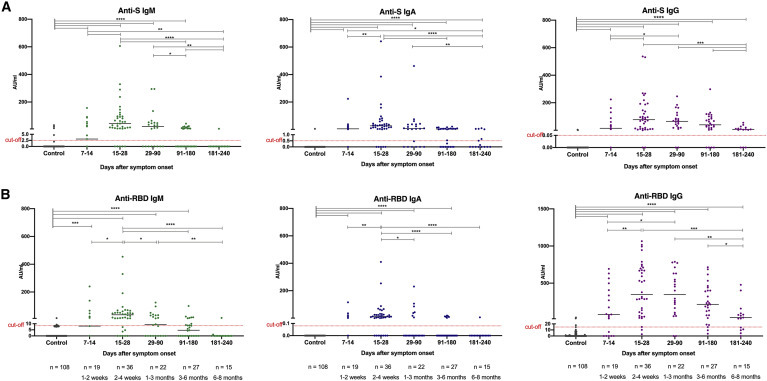
Methods: A total of 119 samples from 88 convalescent donors who experienced mild to critical disease were tested for the presence of elevated anti-spike and anti-receptor binding domain Ab levels over a period of 8 months. In addition, the levels of SARS-CoV-2 neutralizing Abs and specific memory B and T cell responses were tested in a subset of samples.

Findings: Anti-SARS-CoV-2 Abs were present in 85% of the samples collected within 4 weeks after the onset of symptoms in COVID-19 patients. Levels of specific immunoglobulin M (IgM)/IgA Abs declined after 1 month, while levels of specific IgG Abs and plasma neutralizing activities remained relatively stable up to 6 months after diagnosis. Anti-SARS-CoV-2 IgG Abs were still present, although at a significantly lower level, in 80% of the samples collected at 6-8 months after symptom onset. SARS-CoV-2-specific memory B and T cell responses developed with time and were persistent in all of the patients followed up for 6-8 months.

Conclusions: Our data suggest that protective adaptive immunity following natural infection of SARS-CoV-2 may persist for at least 6-8 months, regardless of disease severity. Development of medium- or long-term protective immunity through vaccination may thus be possible.

Funding: This project was supported by the European Union's Horizon 2020 research and innovation programme (ATAC, no. 101003650), the Italian Ministry of Health (Ricerca Finalizzata grant no. GR-2013-02358399), the Center for Innovative Medicine, and the Swedish Research Council. J.A. was supported by the SciLifeLab/KAW national COVID-19 research program project grant 2020.

Keywords: B cell; COVID-19; IgG; SARS-CoV-2; T cell; antibody; immunity; immunological memory; longevity of immune response; neutralizing antibody.


Conflict of interest statement

S.B.-A. is a member of the advisory board of Mabtech AB. The other authors declare no competing interests.

Figures

None
Graphical abstract
Figure 1
Figure 1
Flowchart illustrating the study design.
Figure 2
Figure 2
Anti-SARS-CoV-2 antibody response in COVID-19 patients (A–C) Levels of anti-S and anti-RBD IgM, IgA, and IgG antibodies in historical controls and COVID-19 patients. (D–F) Correlation between titers of anti-S and anti-RBD IgM, IgA, and IgG. Antibodies were measured in 55 samples from COVID-19 patients collected during early phases of recovery (between 7 and 28 days after onset of disease symptoms) and 108 historical controls (before the SARS-CoV-2 pandemic). Symbols represent individual subjects; horizontal black lines indicate the median. The dashed red line indicates the cutoff value for elevated anti-S and anti-RBD antibody levels (2.5 and 8.4 AU/mL for IgM, 0.5 and 0.08 AU/mL for IgA, and 0.03 and 14.81 AU/mL for IgG, respectively) defined using receiver operating characteristic (ROC) curves, based on the antibody responses in historical controls (n = 108) and COVID-19 patients (n = 55). Percentages in (A)–(C) show the frequency of antibody-positive individuals. Mann-Whitney U test (A–C) and Spearman’s rank correlation (D–F). ∗∗∗∗p < 0.0001.
Figure 3
Figure 3
Anti-SARS-CoV-2 antibody responses in COVID-19 patients with different disease scores Levels of anti-S and anti-RBD IgM, IgA, and IgG antibodies according to disease severity (A and B) and sex (C and D). Symbols represent individual subjects; horizontal black lines indicate the median. The dashed red line indicates the cutoff value for elevated anti-S and anti-RBD antibody levels (same as in Figure 2). Mann-Whitney U test. ∗p < 0.05. No statistically significant difference (p > 0.05) was observed in the level of anti-S (A) and anti-RBD (B) between patients presenting with severe and critical disease scores compared to mild (p = 0.1444 and p = 0.2943 for anti-S IgG, respectively) or moderate disease groups (p = 0.1203 and p = 0.4672 for anti-RBD IgG, respectively).
Figure 4
Figure 4
Longevity of the anti-SARS-CoV-2 antibody response in COVID-19 patients Anti-S and anti-RBD IgM, IgA, and IgG antibody response in COVID-19 patients during the time following diagnosis and recovery (A and B). In total, 119 samples were collected from 88 patients. Samples were taken at 5 study periods: 7–14 days (n = 19), 15–28 days (n = 36), 29-90 days (n = 22), 91–180 days (n = 27), and 181–240 days (n = 15) after symptom onset. Symbols represent individual subjects; horizontal black lines indicate the median. The dashed red line indicates the cutoff value for elevated anti-S and anti-RBD antibody levels (same as in Figure 2). Significant differences between the groups were marked by bars on the top. Mann-Whitney U test. ∗p ≤ 0.05, ∗∗p ≤ 0.001, ∗∗∗p ≤ 0.001, and ∗∗∗∗p < 0.0001. See also Figure S1.
Figure 5
Figure 5
Dynamics of the anti-SARS-CoV-2 antibody levels in paired samples from COVID-19 patients Levels of anti-S (A–C) and anti-RBD (D–F) IgM, IgA, and IgG antibodies in 27 pairs of COVID-19 patients measured at time point 1 (TP1, median day 21, range 7–64) and TP2 (median day 126, range 57–234) and presented on a group (left panel) or an individual (right panel) level. Symbols represent individual subjects; horizontal black lines indicate the median. The gray area under the curve (right panels) shows the distribution of antibody decay rates estimated by 2-phase exponential association. Wilcoxon signed-rank test. ∗∗p ≤ 0.001 and ∗∗∗p ≤ 0.001.
Figure 6
Figure 6
SARS-CoV-2-specific memory B and T cell responses in COVID-19 patients (A) Number of RBD-specific memory B cells from control (n = 11) and COVID-19 patient (n = 32) samples. (B and F) Dynamics of RBD-specific memory B cell, SARS-CoV-2-specific T cell, and serum anti-RBD IgG levels in COVID-19 patient samples over time, with the corresponding log-normal fitting curve. (C–E) Number of T cells specific for the S1, S2N, and S N M O SARS-CoV-2 protein-derived peptide pools and producing IL-2 (C), IFN-γ (D), or IFN-γ and IL-2 (E) in control and COVID-19 patient samples, respectively. (G) Number of specific memory B cells and IFN-γ/IL-2-producing T cells specific for the S1, S2N, and S N M O protein-derived peptide pools in 7 patients (with mild [CP45], moderate [CP08, CP09], or severe [CP34, CP03, CP19, CP06] disease) at TP1, TP2, and TP3 (for CP06). The results were expressed as the number of spots per 300,000 seeded cells after subtracting the background spots of the negative control. The red line indicates the median value of the group. The cutoff value was set at the highest number of specific B and T cell spots for the negative controls. Mann-Whitney U test. ∗∗p ≤ 0.01, ∗∗∗p ≤ 0.001, and ∗∗∗∗p ≤ 0.0001. See also Figures S2–S4 and Tables S2 and S3.

References

    1. Naqvi A.A.T., Fatima K., Mohammad T., Fatima U., Singh I.K., Singh A., Atif S.M., Hariprasad G., Hasan G.M., Hassan M.I. Insights into SARS-CoV-2 genome, structure, evolution, pathogenesis and therapies: structural genomics approach. Biochim. Biophys. Acta Mol. Basis Dis. 2020;1866:165878. - PMC - PubMed
    1. Grifoni A., Weiskopf D., Ramirez S.I., Mateus J., Dan J.M., Moderbacher C.R., Rawlings S.A., Sutherland A., Premkumar L., Jadi R.S., et al. Targets of T cell responses to SARS-CoV-2 coronavirus in humans with COVID-19 disease and unexposed individuals. Cell. 2020;181:1489–1501.e15. - PMC - PubMed
    1. Juno J.A., Tan H.-X., Lee W.S., Reynaldi A., Kelly H.G., Wragg K., Esterbauer R., Kent H.E., Batten C.J., Mordant F.L., et al. Humoral and circulating follicular helper T cell responses in recovered patients with COVID-19. Nat. Med. 2020;26:1428–1434. - PubMed
    1. Robbiani D.F., Gaebler C., Muecksch F., Lorenzi J.C.C., Wang Z., Cho A., Agudelo M., Barnes C.O., Gazumyan A., Finkin S., et al. Convergent antibody responses to SARS-CoV-2 in convalescent individuals. Nature. 2020;584:437–442. - PMC - PubMed
    1. Hassan A.O., Case J.B., Winkler E.S., Thackray L.B., Kafai N.M., Bailey A.L., McCune B.T., Fox J.M., Chen R.E., Alsoussi W.B., et al. A SARS-CoV-2 infection model in mice demonstrates protection by neutralizing antibodies. Cell. 2020;182:744–753.e4. - PMC - PubMed

Publication types