

Hawk-Seq™ differentiates between various mutations in Salmonella typhimurium TA100 strain caused by exposure to Ames test-positive mutagens
- PMID: 33590004
- PMCID: PMC8262380
- DOI: 10.1093/mutage/geab006
Hawk-Seq™ differentiates between various mutations in Salmonella typhimurium TA100 strain caused by exposure to Ames test-positive mutagens
Abstract
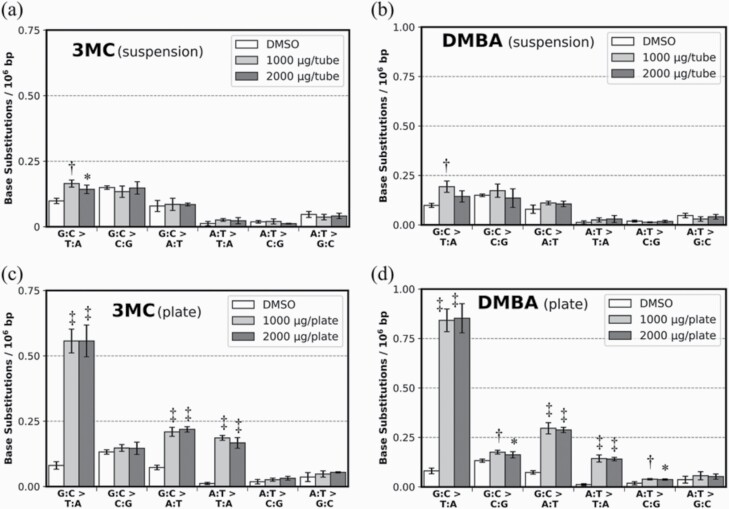
A precise understanding of differences in genomic mutations according to the mutagenic mechanisms detected in mutagenicity data is required to evaluate the carcinogenicity of environmental mutagens. Recently, we developed a highly accurate genome sequencing method, 'Hawk-Seq™', that enables the detection of mutagen-induced genome-wide mutations. However, its applicability to detect various mutagens and identify differences in mutational profiles is not well understood. Thus, we evaluated DNA samples from Salmonella typhimurium TA100 exposed to 11 mutagens, including alkylating agents, aldehydes, an aromatic nitro compound, epoxides, aromatic amines and polycyclic aromatic hydrocarbons (PAHs). We extensively analysed mutagen-induced mutational profiles and studied their association with the mechanisms of mutagens. Hawk-Seq™ sensitively detected mutations induced by all 11 mutagens, including one that increased the number of revertants by approximately 2-fold in the Ames test. Although the sensitivity for less water-soluble mutagens was relatively low, we increased the sensitivity to obtain high-resolution spectra by modifying the exposure protocol. Moreover, two epoxides indicated similar 6- or 96-dimensional mutational patterns; likewise, three SN1-type alkylating agents indicated similar mutational patterns, suggesting that the mutational patterns are compound category specific. Meanwhile, an SN2 type alkylating agent exhibited unique mutational patterns compared to those of the SN1 type alkylating agents. Although the mutational patterns induced by aldehydes, the aromatic nitro compound, aromatic amines and PAHs did not differ substantially from each other, the maximum total base substitution frequencies (MTSFs) were similar among mutagens in the same structural groups. Furthermore, the MTSF was found to be associated with the carcinogenic potency of some direct-acting mutagens. These results indicate that our method can generate high-resolution mutational profiles to identify characteristic features of each mutagen. The detailed mutational data obtained by Hawk-Seq™ can provide useful information regarding mutagenic mechanisms and help identify its association with the carcinogenicity of mutagens without requiring carcinogenicity data.
© The Author(s) 2021. Published by Oxford University Press on behalf of the UK Environmental Mutagen Society.
Figures


References
-
- Pfeifer, G. P., Denissenko, M. F., Olivier, M., Tretyakova, N., Hecht, S. S. and Hainaut, P. (2002) Tobacco smoke carcinogens, DNA damage and p53 mutations in smoking-associated cancers. Oncogene, 21, 7435–7451. - PubMed
-
- Yang, M. (2011) A current global view of environmental and occupational cancers. J. Environ. Sci. Health. C. Environ. Carcinog. Ecotoxicol. Rev., 29, 223–249. - PubMed
-
- Ng, A. W. T., Poon, S. L., Huang, M. N., et al. (2017) Aristolochic acids and their derivatives are widely implicated in liver cancers in Taiwan and throughout Asia. Sci. Transl. Med., 9, eaan6446. - PubMed
-
- Mortelmans, K. and Zeiger, E. (2000) The Ames Salmonella/microsome mutagenicity assay. Mutat. Res., 455, 29–60. - PubMed
Publication types
MeSH terms
Substances
LinkOut - more resources
Full Text Sources
Other Literature Sources
