Bacteria have numerous distinctive groups of phage-plasmids with conserved phage and variable plasmid gene repertoires
- PMID: 33590101
- PMCID: PMC7969092
- DOI: 10.1093/nar/gkab064
Bacteria have numerous distinctive groups of phage-plasmids with conserved phage and variable plasmid gene repertoires
Abstract
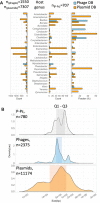
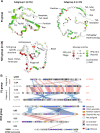
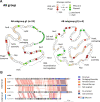
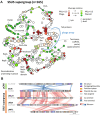
Plasmids and temperate phages are key contributors to bacterial evolution. They are usually regarded as very distinct. However, some elements, termed phage-plasmids, are known to be both plasmids and phages, e.g. P1, N15 or SSU5. The number, distribution, relatedness and characteristics of these phage-plasmids are poorly known. Here, we screened for these elements among ca. 2500 phages and 12000 plasmids and identified 780 phage-plasmids across very diverse bacterial phyla. We grouped 92% of them by similarity of gene repertoires to eight defined groups and 18 other broader communities of elements. The existence of these large groups suggests that phage-plasmids are ancient. Their gene repertoires are large, the average element is larger than an average phage or plasmid, and they include slightly more homologs to phages than to plasmids. We analyzed the pangenomes and the genetic organization of each group of phage-plasmids and found the key phage genes to be conserved and co-localized within distinct groups, whereas genes with homologs in plasmids are much more variable and include most accessory genes. Phage-plasmids are a sizeable fraction of the sequenced plasmids (∼7%) and phages (∼5%), and could have key roles in bridging the genetic divide between phages and other mobile genetic elements.
© The Author(s) 2021. Published by Oxford University Press on behalf of Nucleic Acids Research.
Figures



Similar articles
-
Phage-plasmids promote recombination and emergence of phages and plasmids.Nat Commun. 2024 Feb 20;15(1):1545. doi: 10.1038/s41467-024-45757-3. Nat Commun. 2024. PMID: 38378896 Free PMC article.
-
Plasmid-Mediated Stabilization of Prophages.mSphere. 2022 Apr 27;7(2):e0093021. doi: 10.1128/msphere.00930-21. Epub 2022 Mar 21. mSphere. 2022. PMID: 35311569 Free PMC article.
-
Phage-Plasmids Spread Antibiotic Resistance Genes through Infection and Lysogenic Conversion.mBio. 2022 Oct 26;13(5):e0185122. doi: 10.1128/mbio.01851-22. Epub 2022 Sep 26. mBio. 2022. PMID: 36154183 Free PMC article.
-
Dynamics of antibiotic resistance genes in plasmids and bacteriophages.Crit Rev Microbiol. 2025 Mar;51(2):219-228. doi: 10.1080/1040841X.2024.2339262. Epub 2024 Apr 23. Crit Rev Microbiol. 2025. PMID: 38651513 Review.
-
N15: the linear phage-plasmid.Plasmid. 2011 Mar;65(2):102-9. doi: 10.1016/j.plasmid.2010.12.004. Epub 2010 Dec 23. Plasmid. 2011. PMID: 21185326 Review.
Cited by
-
BACPHLIP: predicting bacteriophage lifestyle from conserved protein domains.PeerJ. 2021 May 6;9:e11396. doi: 10.7717/peerj.11396. eCollection 2021. PeerJ. 2021. PMID: 33996289 Free PMC article.
-
Disarm The Bacteria: What Temperate Phages Can Do.Curr Issues Mol Biol. 2023 Feb 1;45(2):1149-1167. doi: 10.3390/cimb45020076. Curr Issues Mol Biol. 2023. PMID: 36826021 Free PMC article. Review.
-
Streptococcus pneumoniae: a Plethora of Temperate Bacteriophages With a Role in Host Genome Rearrangement.Front Cell Infect Microbiol. 2021 Nov 18;11:775402. doi: 10.3389/fcimb.2021.775402. eCollection 2021. Front Cell Infect Microbiol. 2021. PMID: 34869076 Free PMC article.
-
Transposable elements promote the evolution of genome streamlining.Philos Trans R Soc Lond B Biol Sci. 2022 Jan 17;377(1842):20200477. doi: 10.1098/rstb.2020.0477. Epub 2021 Nov 29. Philos Trans R Soc Lond B Biol Sci. 2022. PMID: 34839699 Free PMC article.
-
Exploring virus-host-environment interactions in a chemotrophic-based underground estuary.Environ Microbiome. 2024 Jan 30;19(1):9. doi: 10.1186/s40793-024-00549-6. Environ Microbiome. 2024. PMID: 38291480 Free PMC article.
References
-
- Frost L.S., Leplae R., Summers A.O., Toussaint A.. Mobile genetic elements: the agents of open source evolution. Nat. Rev. Microbiol. 2005; 3:722–732. - PubMed
-
- Touchon M., Moura de Sousa J.A., Rocha E.P.. Embracing the enemy: the diversification of microbial gene repertoires by phage-mediated horizontal gene transfer. Curr. Opin. Microbiol. 2017; 38:66–73. - PubMed
-
- Gandon S. Why be temperate: lessons from bacteriophage λ. Trends Microbiol. 2016; 24:356–365. - PubMed
Publication types
MeSH terms
Substances
LinkOut - more resources
Full Text Sources
Other Literature Sources

