. 2021 Jun;37(6):1825-1837.
doi: 10.1007/s10554-021-02162-x. Epub 2021 Feb 15.

A deep learning methodology for the automated detection of end-diastolic frames in intravascular ultrasound images

Affiliations

A deep learning methodology for the automated detection of end-diastolic frames in intravascular ultrasound images

Retesh Bajaj et al. Int J Cardiovasc Imaging. 2021 Jun.

Abstract

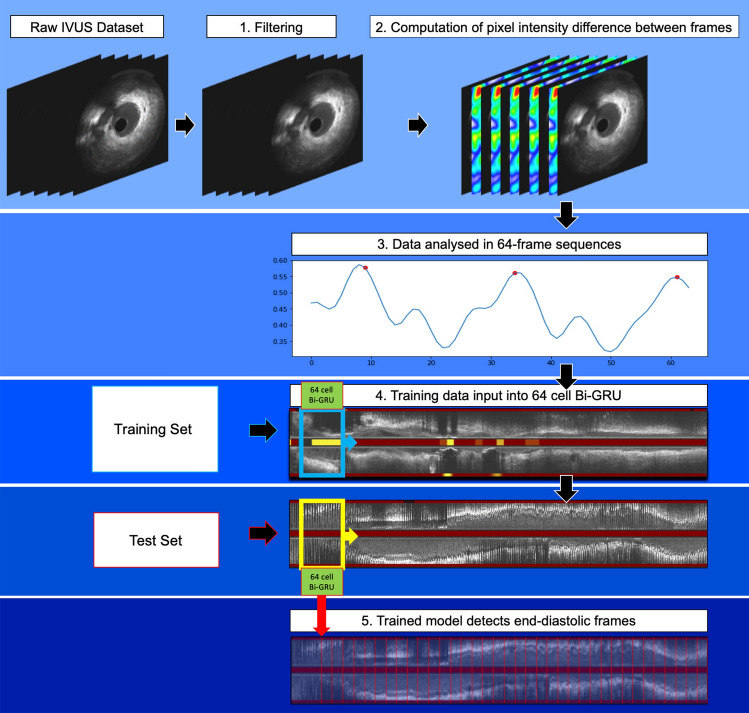
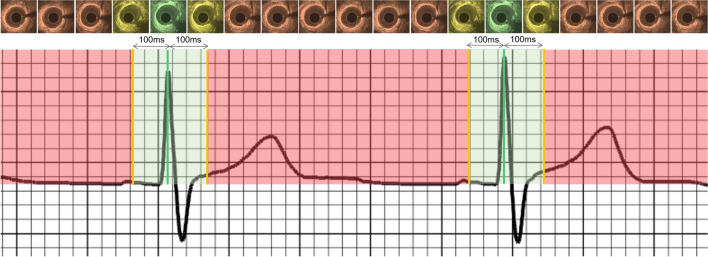
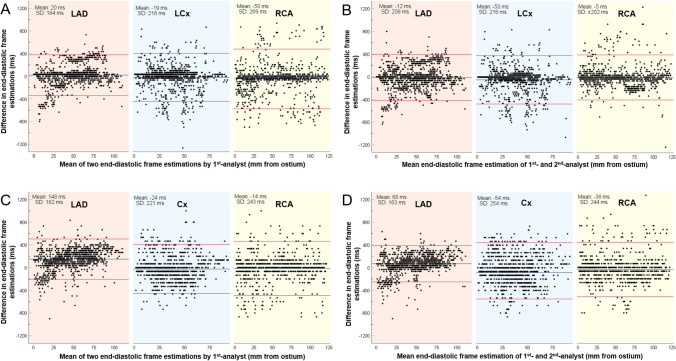
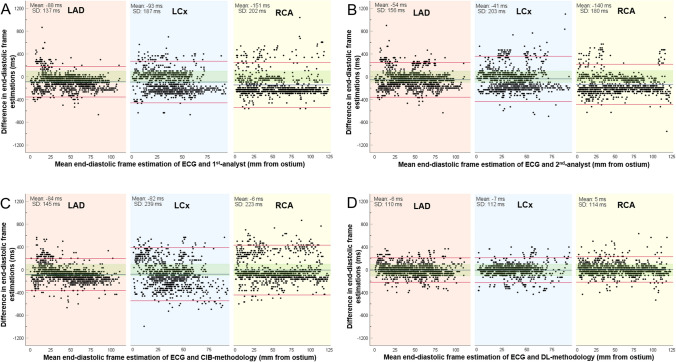
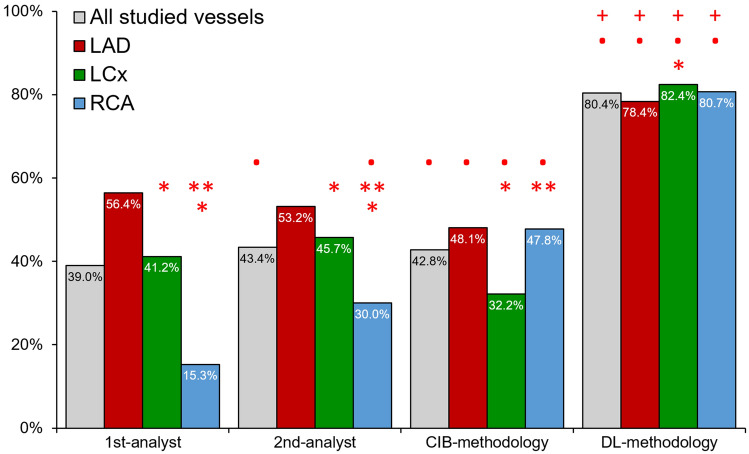
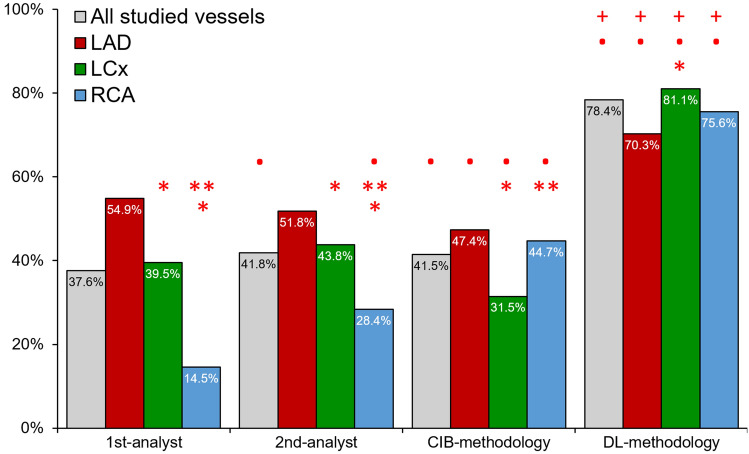
Coronary luminal dimensions change during the cardiac cycle. However, contemporary volumetric intravascular ultrasound (IVUS) analysis is performed in non-gated images as existing methods to acquire gated or to retrospectively gate IVUS images have failed to dominate in research. We developed a novel deep learning (DL)-methodology for end-diastolic frame detection in IVUS and compared its efficacy against expert analysts and a previously established methodology using electrocardiographic (ECG)-estimations as reference standard. Near-infrared spectroscopy-IVUS (NIRS-IVUS) data were prospectively acquired from 20 coronary arteries and co-registered with the concurrent ECG-signal to identify end-diastolic frames. A DL-methodology which takes advantage of changes in intensity of corresponding pixels in consecutive NIRS-IVUS frames and consists of a network model designed in a bidirectional gated-recurrent-unit (Bi-GRU) structure was trained to detect end-diastolic frames. The efficacy of the DL-methodology in identifying end-diastolic frames was compared with two expert analysts and a conventional image-based (CIB)-methodology that relies on detecting vessel movement to estimate phases of the cardiac cycle. A window of ± 100 ms from the ECG estimations was used to define accurate end-diastolic frames detection. The ECG-signal identified 3,167 end-diastolic frames. The mean difference between DL and ECG estimations was 3 ± 112 ms while the mean differences between the 1st-analyst and ECG, 2nd-analyst and ECG and CIB-methodology and ECG were 86 ± 192 ms, 78 ± 183 ms and 59 ± 207 ms, respectively. The DL-methodology was able to accurately detect 80.4%, while the two analysts and the CIB-methodology detected 39.0%, 43.4% and 42.8% of end-diastolic frames, respectively (P < 0.05). The DL-methodology can identify NIRS-IVUS end-diastolic frames accurately and should be preferred over expert analysts and CIB-methodologies, which have limited efficacy.

Keywords: Intravascular ultrasound; Machine learning; Near-infrared spectroscopy.


Conflict of interest statement

All authors have no conflicts of interests to declare.

Figures

Fig. 1
Fig. 1
Schematic representation of the DL-methodology introduced for accurate detection of end-diastolic frames: (1) implementation of a Median filter to reduce noise in NIRS-IVUS images, (2) estimation of the absolute difference of grayscale-intensity of corresponding pixels identified in sequential frames, (3) schematic representation of the sum of the pixel differences that indicates the relative movement of the lumen with regards to the NIRS-IVUS probe; a segment of 64 frames is created that incorporates at least one cardiac cycle and sweeps the NIRS-IVUS sequence, (4) these data are used as a training set and entered into a 64-cell Bi-GRU (bidirectional-gated recurrent unit) neural network, (5) the trained network is used to process 64-frame segments generated in the test set and identify in this set the end-diastolic frames
Fig. 2
Fig. 2
ECG recording with the corresponding NIRS-IVUS frames acquired at different phases of the cardiac cycle. The IVUS frame corresponding to the peak of the R-wave was defined by the ECG as the end-diastolic frame (green line). The green shaded area represents a period within ± 100 ms of the peak of R-wave. Frames detected by the analysts or the CIB- or DL-methodologies that fell in the green shaded area were classified as correctly detected end-diastolic frames. It is apparent in the NIRS-IVUS frames above the ECG that there is no motion of the lumen with regards to the NIRS-IVUS probe in frames that correspond to the end-diastolic period (shown with a green or a yellow colour); conversely the relative movement of the lumen with regards to the NIRS-IVUS probe is increased in the frames that do not correspond to the end-diastolic period and are portrayed with an orange colour
Fig. 3
Fig. 3
Bland–Altman analyses between the first and second set of estimations of the 1st-analyst at the NIRS-IVUS sequences acquired at 30fps (a) and 15fps (b) and between the estimations of the 1st- and 2nd-analyst in the same data set (c at 30fps; d at 15fps). Results are shown for the left anterior descending (LAD), left circumflex (LCx), and right coronary artery (RCA). The blue line represents the mean difference and the red lines correspond to the limits of agreement i.e., ± 1.96 standard deviation (SD)
Fig. 4
Fig. 4
Bland–Altman analyses in the NIRS-IVUS sequences acquired at 30fps for the estimations of the ECG and the 1st-analyst (a), of the ECG and the 2nd-analyst (b), of the ECG and the CIB-methodology (c) and of the ECG and the DL-methodology (d). Results are shown for the left anterior descending (LAD), left circumflex (LCx), and right coronary artery (RCA). The blue line represents the mean difference and the red lines correspond to the limits of agreement, i.e. ± 1.96 standard deviation (SD). The green shaded area denotes estimations falling within ± 100 ms from the ECG estimations
Fig. 5
Fig. 5
Accuracy of expert analysts, the CIB- and DL-methodology in the NIRS-IVUS sequences acquired at 30fps. (Red colour asterisk) Indicates statistically significant (P < 0.05) differences between the accuracy in left circumflex (LCx) or the right coronary artery (RCA) and the accuracy in the left anterior descending artery (LAD) within the same methodology. (Red colour double asterisk) Indicates statistically significant differences between the accuracy of the RCA and LCx within the same methodology. (Red colour bullet) Indicates statistically significant differences between the 1st-analyst and the 2nd-analyst, CIB- or the DL-methodology while red colour plus symbol indicates statistically significant difference between the CIB- and DL-methodology
Fig. 6
Fig. 6
Accuracy of the expert analysts, the CIB- and DL-methodology in the NIRS-IVUS sequences acquired at 30fps. In this analysis accuracy was defined as the percentage of the correct estimations versus the number of all the estimated end-diastolic frames. (Red colour asterisk) Indicates statistically significant (P < 0.05) differences between the accuracy in left circumflex (LCx) or the right coronary artery (RCA) and the accuracy in the left anterior descending artery (LAD) within the same methodology. (Red colour double asterisk) Indicates statistically significant differences between the accuracy of the RCA and LCx within the same methodology. (Red colour bullet) Indicates statistically significant differences between the 1st-analyst and the 2nd-analyst, CIB- or the DL-methodology while red colour plus symbol indicates statistically significant difference between the CIB- and DL-methodology

References

    1. Böse D, von Birgelen C, Erbel R. Intravascular ultrasound for the evaluation of therapies targeting coronary atherosclerosis. J Am Coll Cardiol. 2007;49:925–932. doi: 10.1016/j.jacc.2006.08.067. - DOI - PubMed
    1. Mintz G, Garcia-Garcia H, Nicholls S, et al. Clinical expert consensus document on standards for acquisition, measurement and reporting of intravascular ultrasound regression/progression studies. EuroIntervention. 2011;6:1123–1130. doi: 10.4244/EIJV6I9A195. - DOI - PubMed
    1. Arbab-Zadeh A, DeMaria AN, Penny WF, et al. Axial movement of the intravascular ultrasound probe during the cardiac cycle: implications for three-dimensional reconstruction and measurements of coronary dimensions. Am Heart J. 1999;138:865–872. doi: 10.1016/S0002-8703(99)70011-6. - DOI - PubMed
    1. Weissman NJ, Palacios IF, Weyman AE. Dynamic expansion of the coronary arteries: implications for intravascular ultrasound measurements. Am Heart J. 1995;130:46–51. doi: 10.1016/0002-8703(95)90234-1. - DOI - PubMed
    1. Ge J, Erbel R, Gerber T, et al. Intravascular ultrasound imaging of angiographically normal coronary arteries: a prospective study in vivo. Heart. 1994;71:572–578. doi: 10.1136/hrt.71.6.572. - DOI - PMC - PubMed