

NMR visibility of deuterium-labeled liver glycogen in vivo
- PMID: 33590529
- PMCID: PMC8005460
- DOI: 10.1002/mrm.28717
NMR visibility of deuterium-labeled liver glycogen in vivo
Abstract
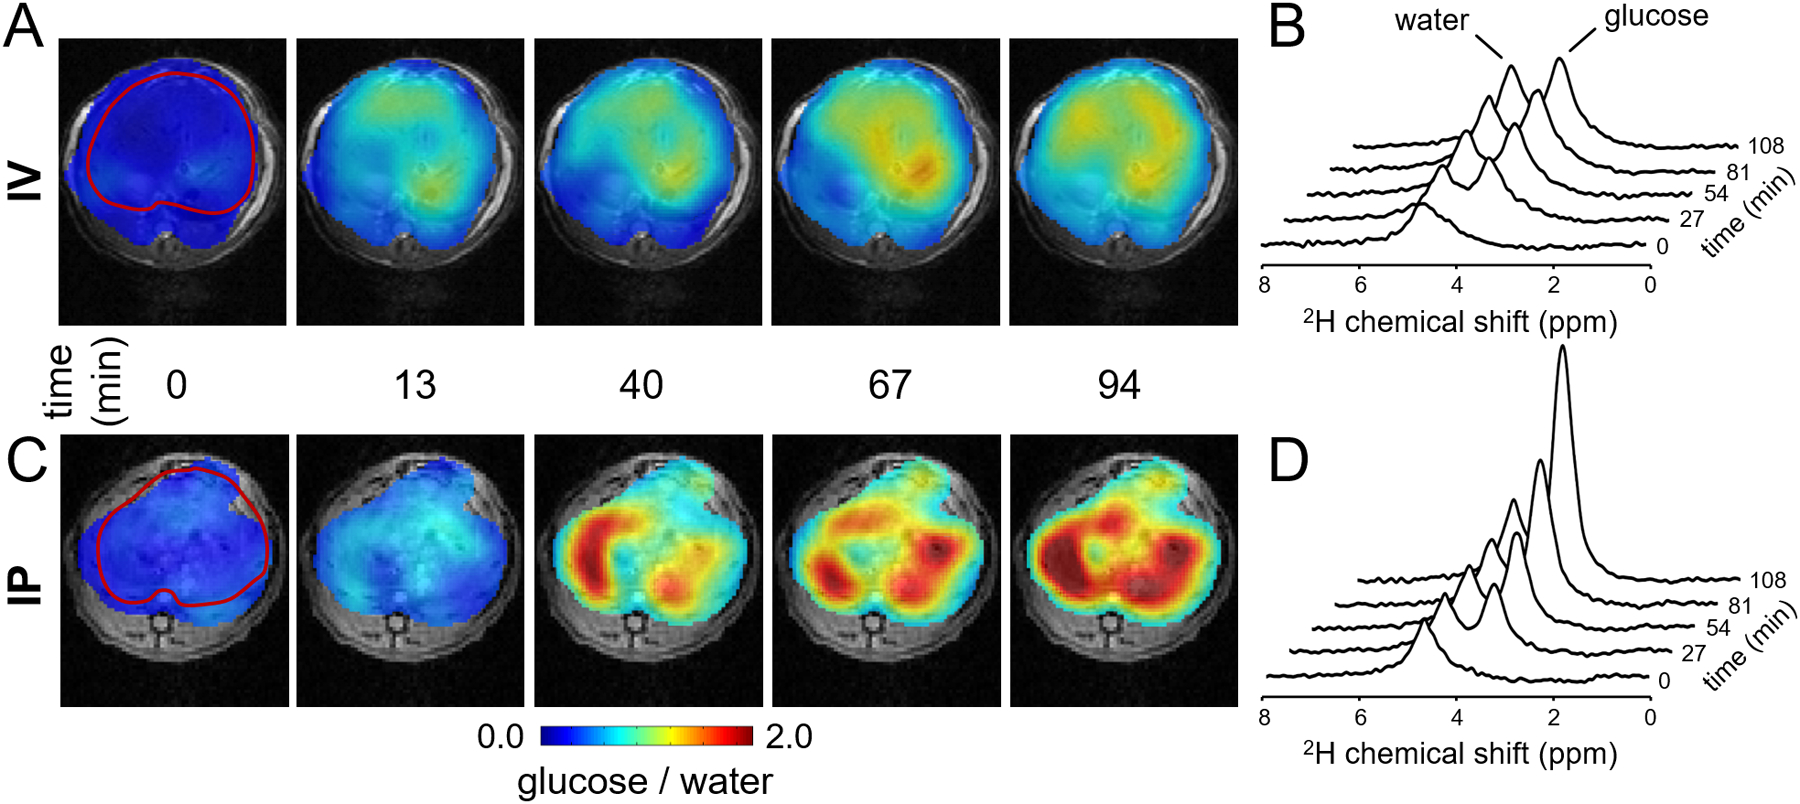
Purpose: Deuterium metabolic imaging (DMI) combined with [6,6'-2 H2 ]-glucose has the potential to detect glycogen synthesis in the liver. However, the similar chemical shifts of [6,6'-2 H2 ]-glucose and [6,6'-2 H2 ]-glycogen in the 2 H NMR spectrum make unambiguous detection and separation difficult in vivo, in contrast to comparable approaches using 13 C MRS. Here the NMR visibility of 2 H-labeled glycogen is investigated to better understand its potential contribution to the observed signal in liver following administration of [6,6'-2 H2 ]-glucose.
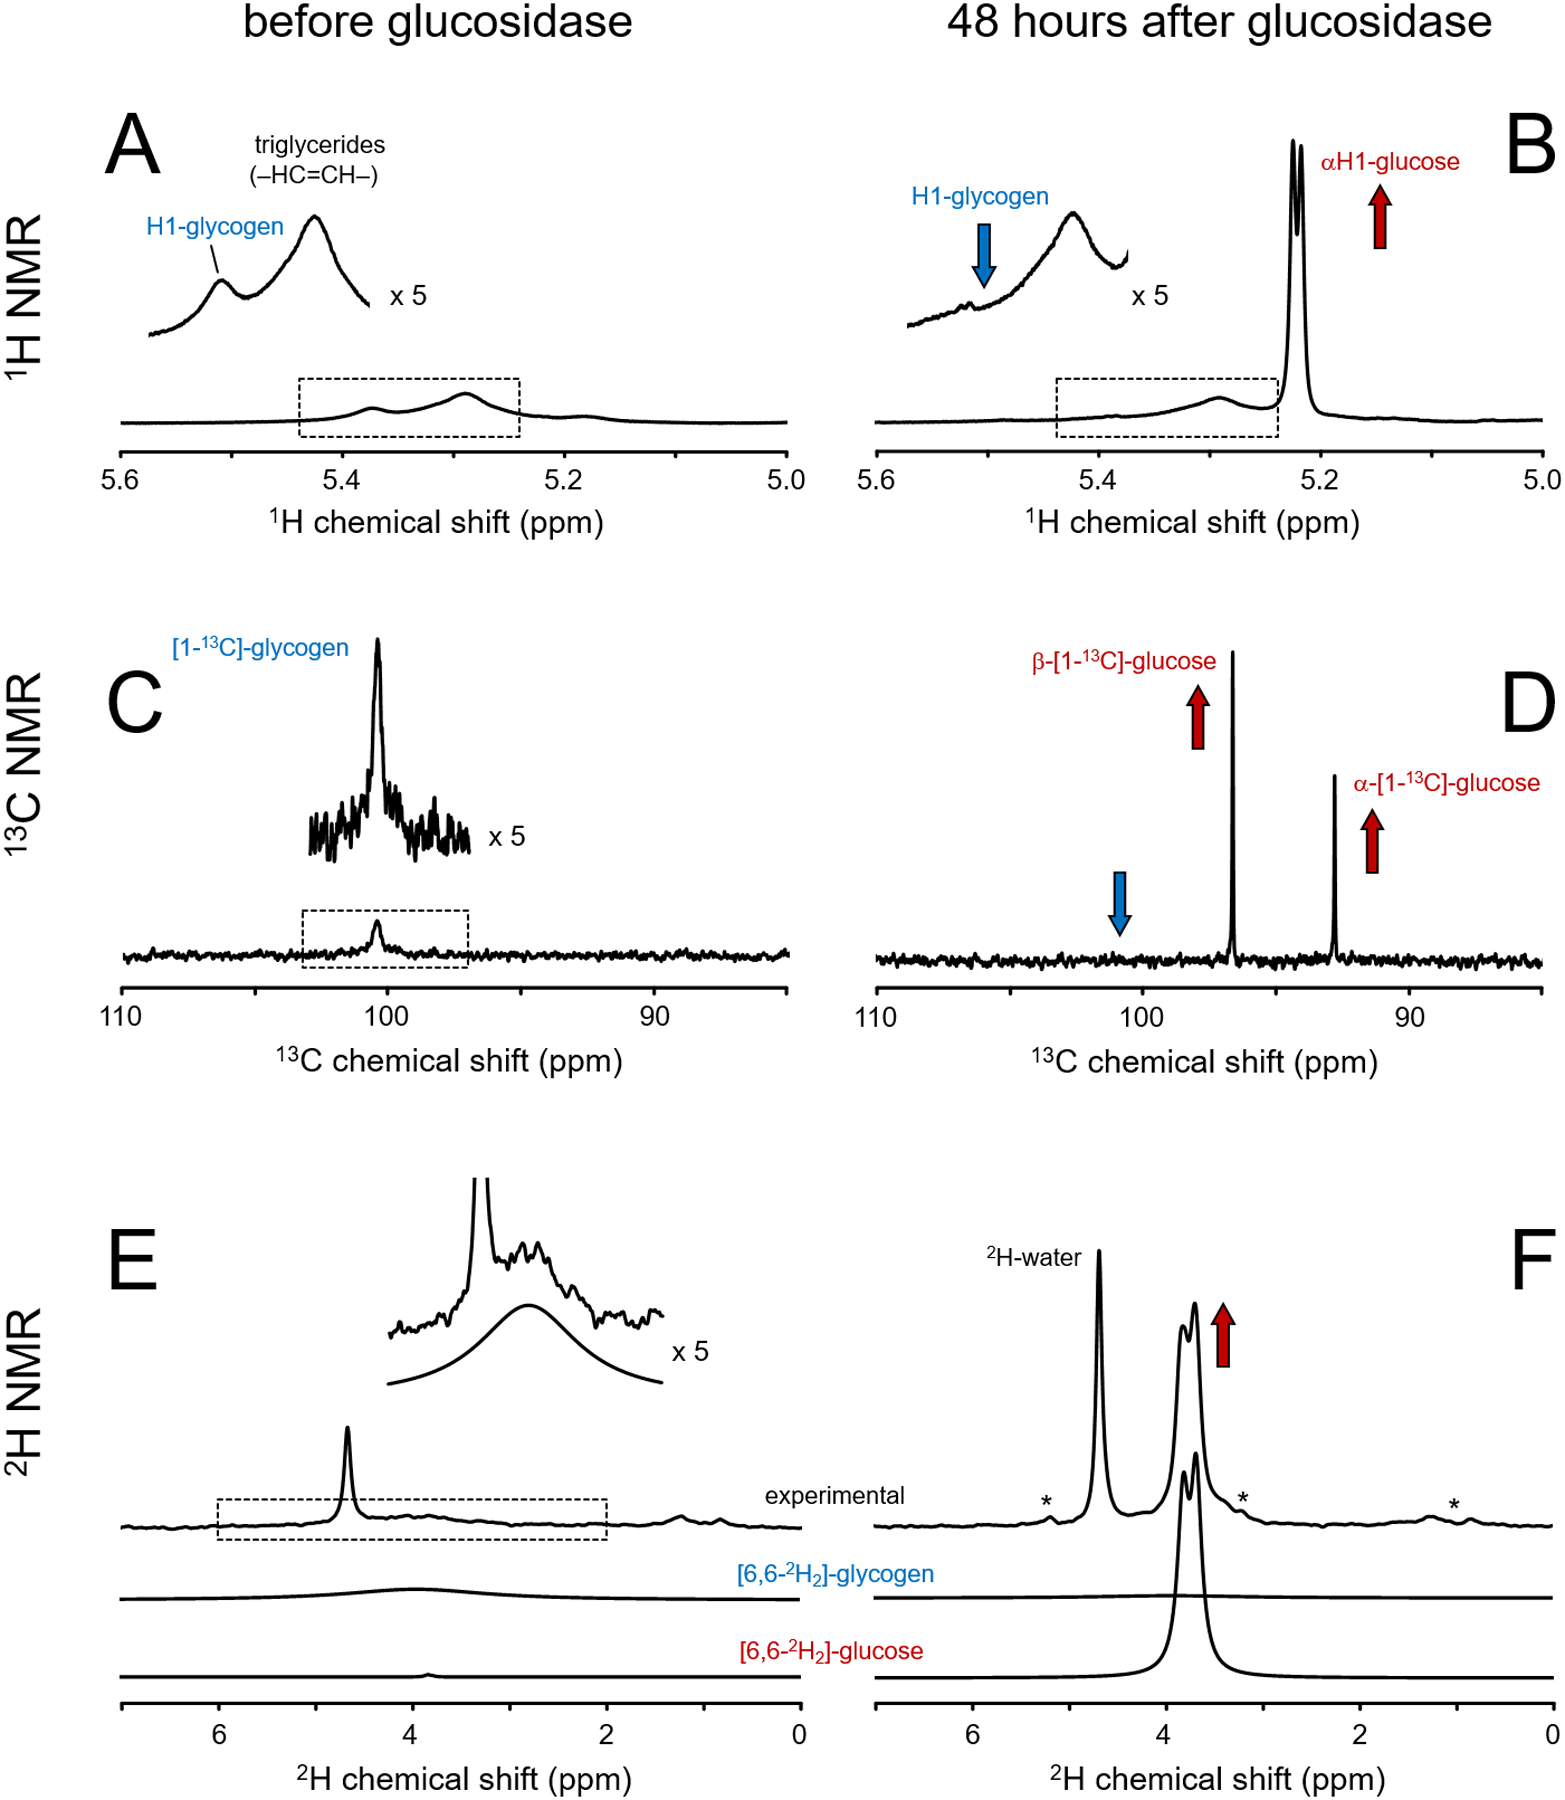
Methods: Mice were provided drinking water containing 2 H-labeled glucose. High-resolution NMR analyses was performed of isolated liver glycogen in solution, before and after the addition of the glucose-releasing enzyme amyloglucosidase.
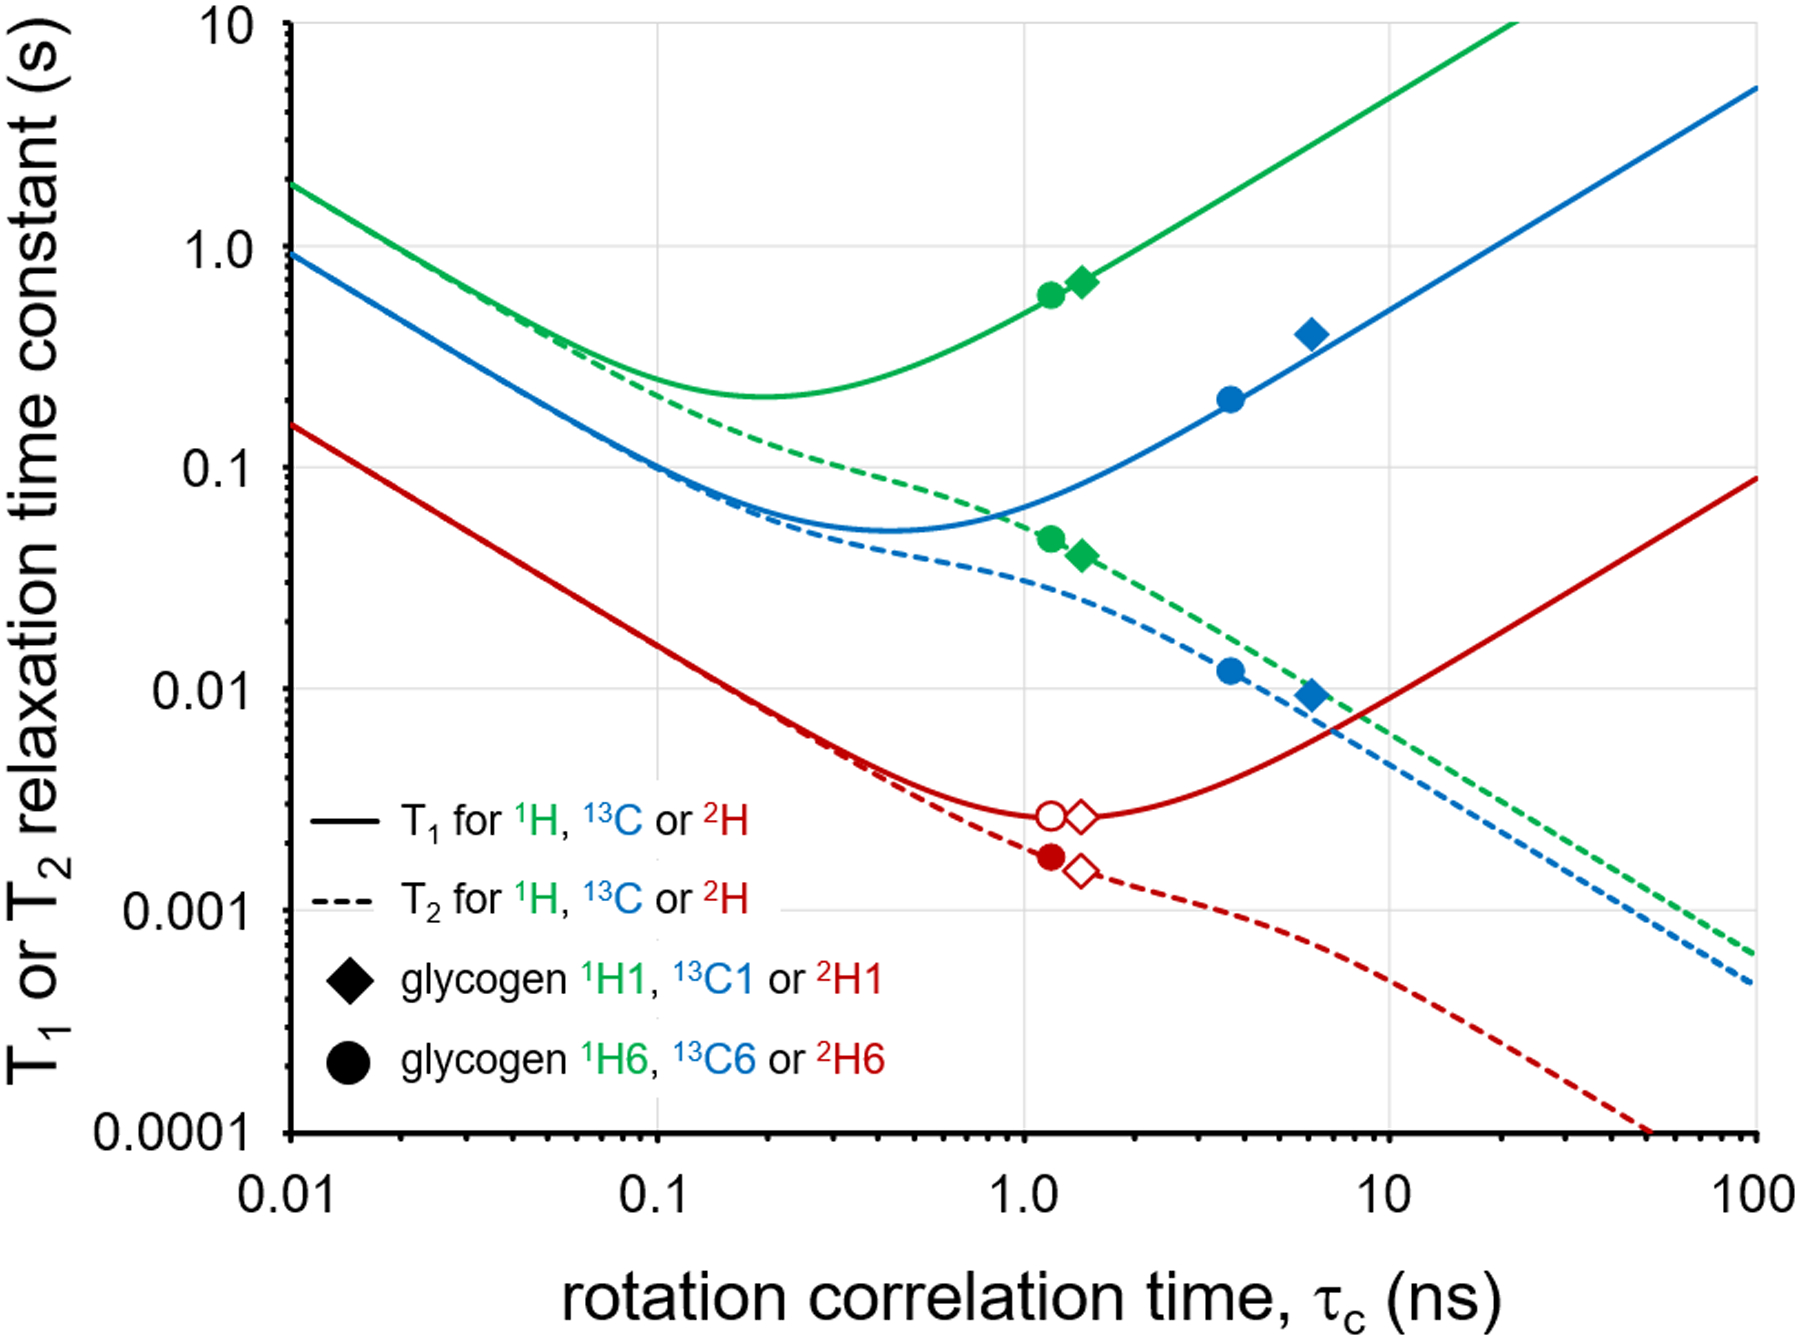
Results: 2 H-labeled glycogen was barely detectable in solution using 2 H NMR because of the very short T2 (<2 ms) of 2 H-labeled glycogen, giving a spectral line width that is more than five times as broad as that of 13 C-labeled glycogen (T2 = ~10 ms).
Conclusion: 2 H-labeled glycogen is not detectable with 2 H MRS(I) under in vivo conditions, leaving 13 C MRS as the preferred technique for in vivo detection of glycogen.
Keywords: DMI; deuterium; glycogen.
© 2021 International Society for Magnetic Resonance in Medicine.
Figures
Similar articles
-
Deuterium metabolic imaging (DMI) for MRI-based 3D mapping of metabolism in vivo.Sci Adv. 2018 Aug 22;4(8):eaat7314. doi: 10.1126/sciadv.aat7314. eCollection 2018 Aug. Sci Adv. 2018. PMID: 30140744 Free PMC article.
-
1H NMR visibility of mammalian glycogen in solution.Proc Natl Acad Sci U S A. 1990 Mar;87(5):1678-80. doi: 10.1073/pnas.87.5.1678. Proc Natl Acad Sci U S A. 1990. PMID: 2308928 Free PMC article.
-
Reproducibility of 3D MRSI for imaging human brain glucose metabolism using direct (2H) and indirect (1H) detection of deuterium labeled compounds at 7T and clinical 3T.Neuroimage. 2023 Aug 15;277:120250. doi: 10.1016/j.neuroimage.2023.120250. Epub 2023 Jul 4. Neuroimage. 2023. PMID: 37414233 Free PMC article.
-
Metabolic imaging with deuterium labeled substrates.Prog Nucl Magn Reson Spectrosc. 2023 Apr-Jun;134-135:39-51. doi: 10.1016/j.pnmrs.2023.02.002. Epub 2023 Feb 10. Prog Nucl Magn Reson Spectrosc. 2023. PMID: 37321757 Review.
-
Methods for measuring glycogen cycling.Am J Physiol Endocrinol Metab. 2001 Sep;281(3):E413-9. doi: 10.1152/ajpendo.2001.281.3.E413. Am J Physiol Endocrinol Metab. 2001. PMID: 11500295 Review.
Cited by
-
Advances and prospects in deuterium metabolic imaging (DMI): a systematic review of in vivo studies.Eur Radiol Exp. 2024 Jun 3;8(1):65. doi: 10.1186/s41747-024-00464-y. Eur Radiol Exp. 2024. PMID: 38825658 Free PMC article.
-
Imaging of metabolic dysfunction in genetic cardiomyopathies.Int J Cardiovasc Imaging. 2025 Aug 8. doi: 10.1007/s10554-025-03470-2. Online ahead of print. Int J Cardiovasc Imaging. 2025. PMID: 40779096 Review.
-
Deuterium Magnetic Resonance Imaging Using Deuterated Water-Induced 2H-Tissue Labeling Allows Monitoring Cancer Treatment at Clinical Field Strength.Clin Cancer Res. 2023 Dec 15;29(24):5173-5182. doi: 10.1158/1078-0432.CCR-23-1635. Clin Cancer Res. 2023. PMID: 37732903 Free PMC article.
-
Deuterium Metabolic Imaging-Rediscovery of a Spectroscopic Tool.Metabolites. 2021 Aug 25;11(9):570. doi: 10.3390/metabo11090570. Metabolites. 2021. PMID: 34564385 Free PMC article. Review.
-
In vivo mapping of postprandial hepatic glucose metabolism using dynamic magnetic resonance spectroscopy combined with stable isotope flux analysis in Roux-en-Y gastric bypass adults and non-operated controls: A case-control study.Diabetes Obes Metab. 2025 Jan;27(1):196-206. doi: 10.1111/dom.16001. Epub 2024 Oct 14. Diabetes Obes Metab. 2025. PMID: 39402788 Free PMC article.
References
-
- Nelson DL, Lehninger AL, Cox MM. Lehninger Principles of Biochemistry. 5th ed. Macmillan; 2008.
Publication types
MeSH terms
Substances
Grants and funding
LinkOut - more resources
Full Text Sources
Other Literature Sources
Medical
