. 2021 Nov;17(11):3671-3689.
doi: 10.1080/15548627.2021.1886839. Epub 2021 Feb 26.

Identification of novel lipid droplet factors that regulate lipophagy and cholesterol efflux in macrophage foam cells

Affiliations

Identification of novel lipid droplet factors that regulate lipophagy and cholesterol efflux in macrophage foam cells

Sabrina Robichaud et al. Autophagy. 2021 Nov.

Abstract

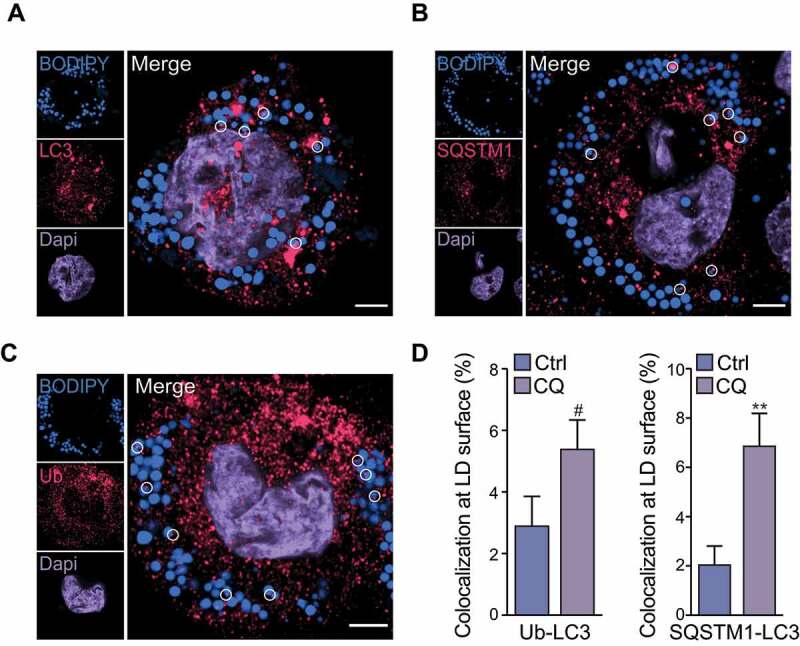
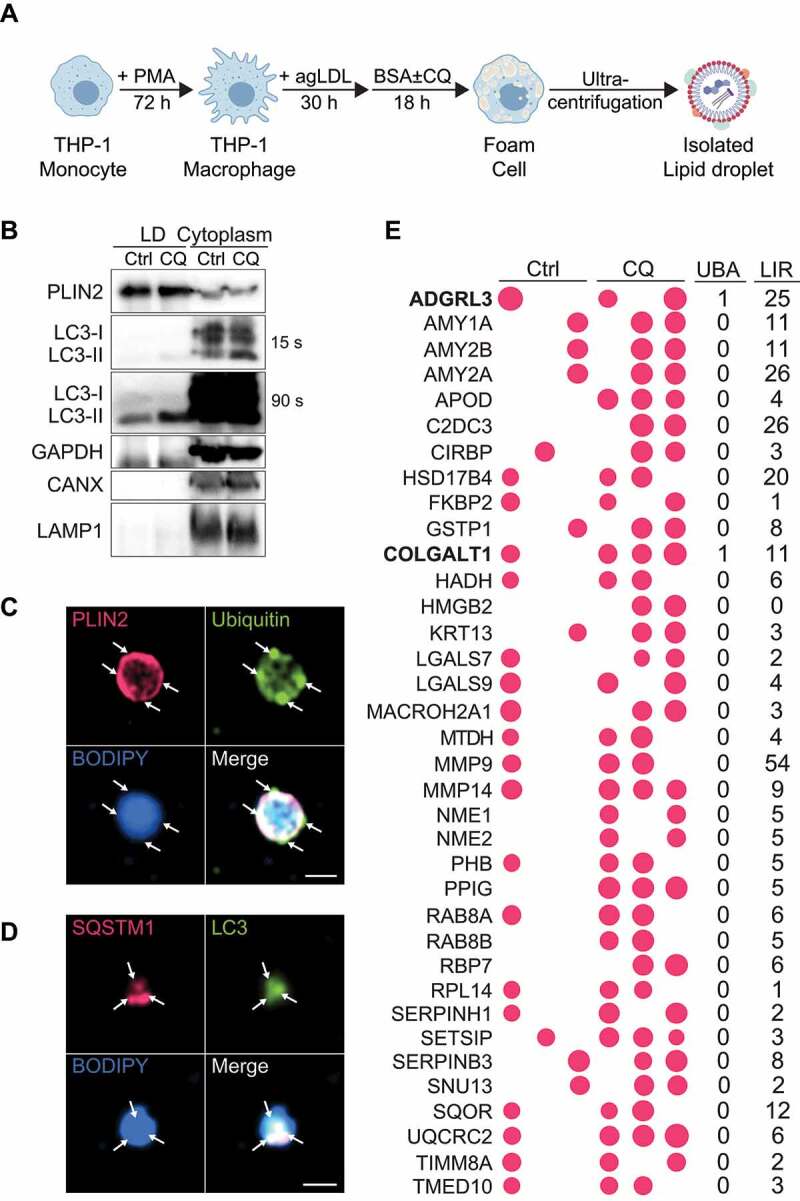
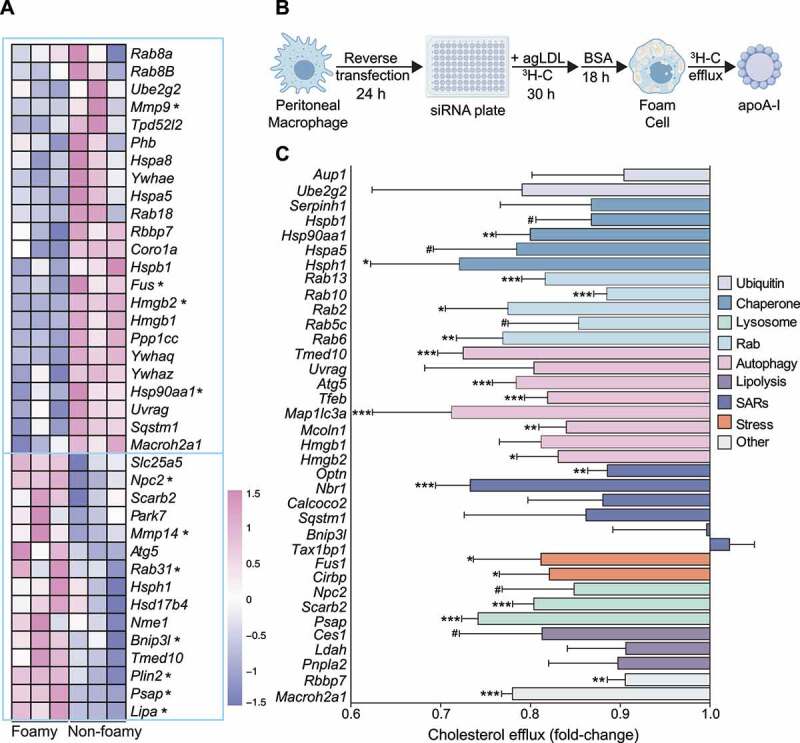
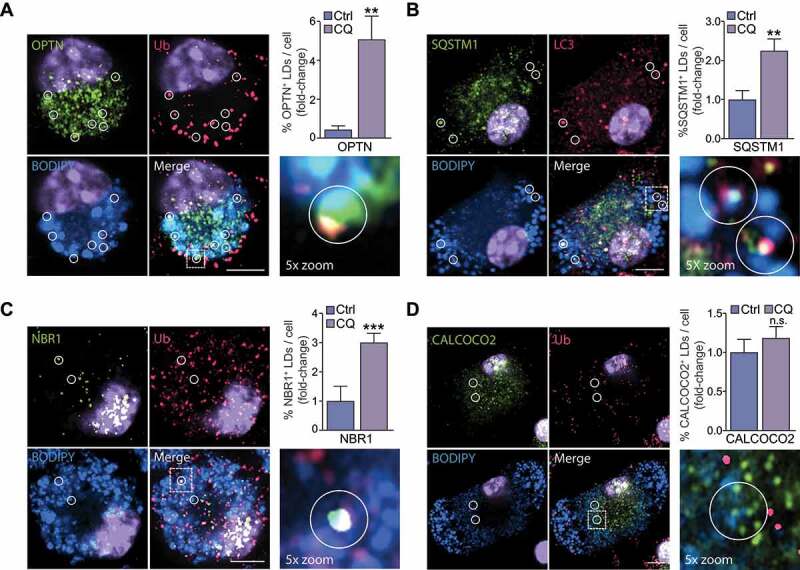
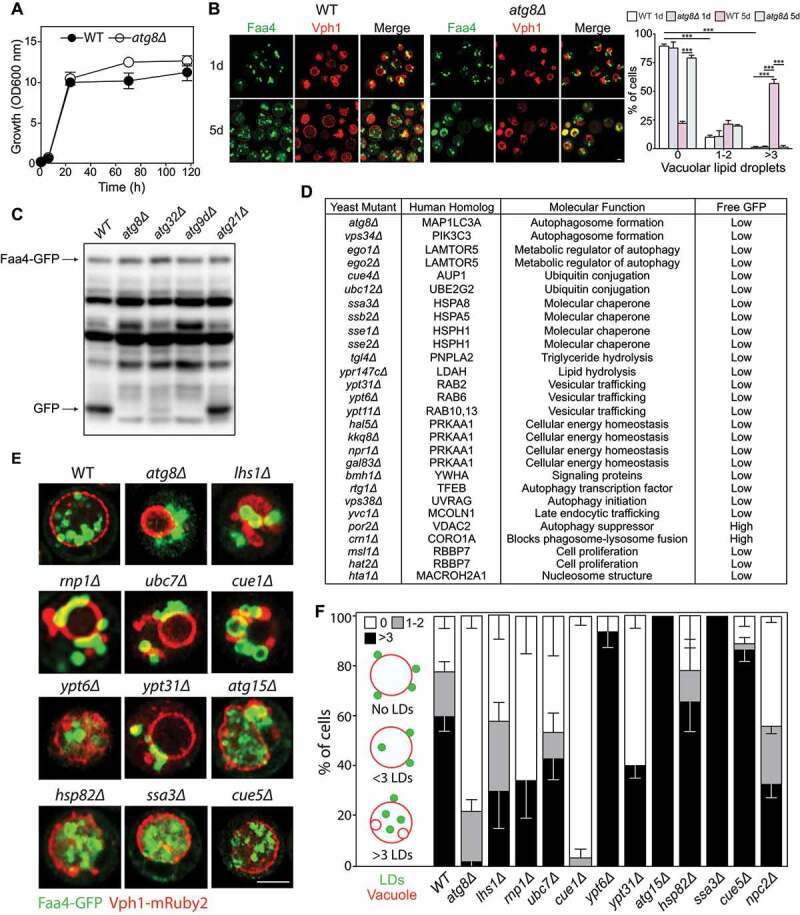
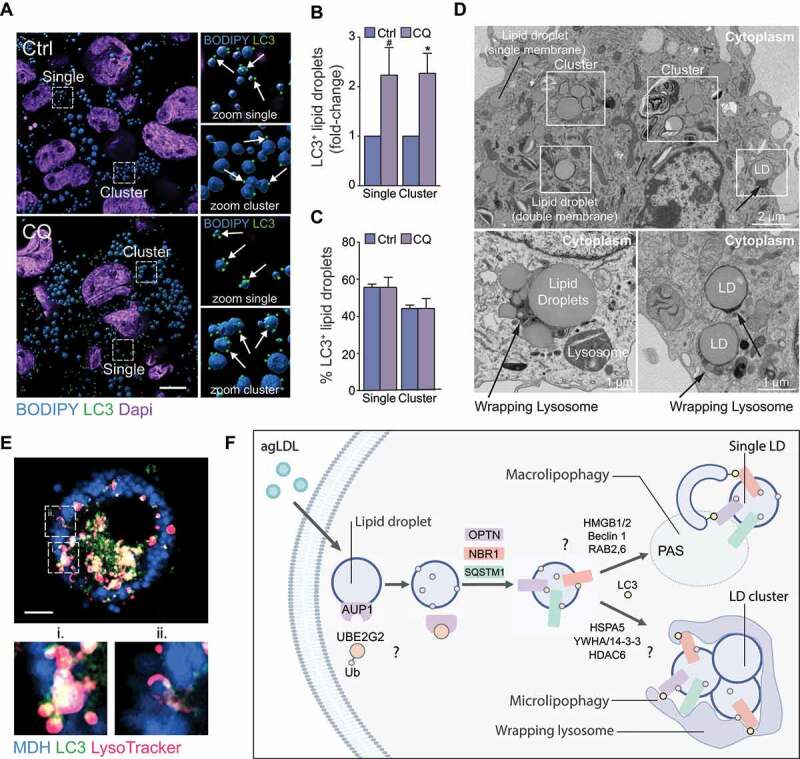
Macrophage autophagy is a highly anti-atherogenic process that promotes the catabolism of cytosolic lipid droplets (LDs) to maintain cellular lipid homeostasis. Selective autophagy relies on tags such as ubiquitin and a set of selectivity factors including selective autophagy receptors (SARs) to label specific cargo for degradation. Originally described in yeast cells, "lipophagy" refers to the degradation of LDs by autophagy. Yet, how LDs are targeted for autophagy is poorly defined. Here, we employed mass spectrometry to identify lipophagy factors within the macrophage foam cell LD proteome. In addition to structural proteins (e.g., PLIN2), metabolic enzymes (e.g., ACSL) and neutral lipases (e.g., PNPLA2), we found the association of proteins related to the ubiquitination machinery (e.g., AUP1) and autophagy (e.g., HMGB, YWHA/14-3-3 proteins). The functional role of candidate lipophagy factors (a total of 91) was tested using a custom siRNA array combined with high-content cholesterol efflux assays. We observed that knocking down several of these genes, including Hmgb1, Hmgb2, Hspa5, and Scarb2, significantly reduced cholesterol efflux, and SARs SQSTM1/p62, NBR1 and OPTN localized to LDs, suggesting a role for these in lipophagy. Using yeast lipophagy assays, we established a genetic requirement for several candidate lipophagy factors in lipophagy, including HSPA5, UBE2G2 and AUP1. Our study is the first to systematically identify several LD-associated proteins of the lipophagy machinery, a finding with important biological and therapeutic implications. Targeting these to selectively enhance lipophagy to promote cholesterol efflux in foam cells may represent a novel strategy to treat atherosclerosis.Abbreviations: ADGRL3: adhesion G protein-coupled receptor L3; agLDL: aggregated low density lipoprotein; AMPK: AMP-activated protein kinase; APOA1: apolipoprotein A1; ATG: autophagy related; AUP1: AUP1 lipid droplet regulating VLDL assembly factor; BMDM: bone-marrow derived macrophages; BNIP3L: BCL2/adenovirus E1B interacting protein 3-like; BSA: bovine serum albumin; CALCOCO2: calcium binding and coiled-coil domain 2; CIRBP: cold inducible RNA binding protein; COLGALT1: collagen beta(1-O)galactosyltransferase 1; CORO1A: coronin 1A; DMA: deletion mutant array; Faa4: long chain fatty acyl-CoA synthetase; FBS: fetal bovine serum; FUS: fused in sarcoma; HMGB1: high mobility group box 1; HMGB2: high mobility group box 2: HSP90AA1: heat shock protein 90: alpha (cytosolic): class A member 1; HSPA5: heat shock protein family A (Hsp70) member 5; HSPA8: heat shock protein 8; HSPB1: heat shock protein 1; HSPH1: heat shock 105kDa/110kDa protein 1; LDAH: lipid droplet associated hydrolase; LIPA: lysosomal acid lipase A; LIR: LC3-interacting region; MACROH2A1: macroH2A.1 histone; MAP1LC3: microtubule-associated protein 1 light chain 3; MCOLN1: mucolipin 1; NBR1: NBR1, autophagy cargo receptor; NPC2: NPC intracellular cholesterol transporter 2; OPTN: optineurin; P/S: penicillin-streptomycin; PLIN2: perilipin 2; PLIN3: perilipin 3; PNPLA2: patatin like phospholipase domain containing 2; RAB: RAB, member RAS oncogene family; RBBP7, retinoblastoma binding protein 7, chromatin remodeling factor; SAR: selective autophagy receptor; SCARB2: scavenger receptor class B, member 2; SGA: synthetic genetic array; SQSTM1: sequestosome 1; TAX1BP1: Tax1 (human T cell leukemia virus type I) binding protein 1; TFEB: transcription factor EB; TOLLIP: toll interacting protein; UBE2G2: ubiquitin conjugating enzyme E2 G2; UVRAG: UV radiation resistance associated gene; VDAC2: voltage dependent anion channel 2; VIM: vimentin.

Keywords: Autophagy; cholesterol efflux; lipid droplet; lipolysis; lipophagy; macrophage foam cell.


Conflict of interest statement

There are no conflicts of interest to report.

Figures

Figure 1.
Figure 1.
LC3, SQSTM1 and ubiquitin localize to lipid droplets in macrophage foam cells. Human THP-1 macrophages were loaded with agLDL (50 μg/mL) for 30 h and equilibrated in BSA (2 mg/mL) overnight. Cells were then fixed and stained for LC3 (A), SQSTM1 (B), ubiquitin (Ub) (C) and BODIPY 493/503 to label neutral lipids. Lipid droplets (LDs) that were colocalized with LC3, SQSTM1 or Ub are circled. At right, quantification of the percent of cellular LDs tagged with Ub and LC3 or Ub and SQSTM1 colocalized at their surface in chloroquine (CQ)-treated cells as compared to control (Ctrl) is shown. Data are expressed as fold-change for the chloroquine treatment relative to untreated from one experiment representative of 3 independent experiments with similar results (mean ± s.e.m). #P < 0.1, **P< 0.005. Representative images are from untreated cells. Scale bar: 5 μm
Figure 2.
Figure 2.
Proteins enriched on lipid droplets following lipophagy inhibition. (A) Schematic for human THP-1 macrophage lipid droplet (LD) isolation. (B) Western Blot analysis of LD and cytoplasmic fractions obtained by sucrose gradient ultracentrifugation. (C, D) Immunostaining of isolated LDs for PLIN2 and Ubiquitin (C), SQSTM1 and LC3 (D), and BODIPY 493/503 to label neutral lipids. (E) Enrichment of proteins at the surface of LDs in foam cells treated with chloroquine (CQ) relative to untreated (Ctrl), with the size of bubbles reflecting relative protein abundance. The number of putative ubiquitin-associated (UBA) and LC3-interacting (LIR) motifs identified in each protein is shown to the right. Scale bar: 1 μm
Figure 3.
Figure 3.
Lipophagy candidate genes are dysregulated in atherosclerosis and regulate foam cell cholesterol efflux. (A) Bulk RNA-seq of atherosclerotic foam cells from apoe−/− mice fed a Western diet for 28 weeks. Genes denoted by an asterisk are significantly different between macrophage populations (P < 0.05) and heatmap color values correspond to the relative expression (Z-score-transformed RPKM values) of each gene across the six samples. Data was acquired from Kim et al. [30] (B) Schematic for reverse transfection of mouse peritoneal macrophages. (C) Efflux of 3H-cholesterol (x-axis) from agLDL-loaded mouse peritoneal macrophages transfected with siRNAs against indicated target mouse genes (y-axis) grouped under shared functional annotations: ubiquitination machinery (Ubiquitin), molecular chaperones (Chaperone), lysosome function (Lysosome), Rab proteins (Rab), Autophagy regulators (Autophagy), regulators of neutral lipolysis (Lipolysis), selective autophagy receptors (SARs), response to cell stress (Stress) and other. Data are the mean ± s.e.m. of four independent experiments. #P < 0.1, *P< 0.05, **P< 0.005, ***P< 0.0005
Figure 4.
Figure 4.
Selective autophagy receptors (SARs) OPTN, NBR1 and SQSTM1 selectively localize to foam cell lipid droplets (LDs). (A-D) Immunostaining for OPTN (A), SQSTM1 (B), NBR1 (C) or CALCOCO2 (D) in agLDL-loaded mouse bone marrow-derived macrophage foam cells stained with BODIPY 493/503 to label LD neutral lipids, with areas of interest circled. At right, quantification of the percent of cellular LDs tagged with SARs in chloroquine-treated cells (CQ) as compared to control (Ctrl) is shown. Data are expressed as fold-change for the chloroquine treatment relative to untreated from one experiment representative of 3 independent experiments with similar results (mean ± s.e.m). **P< 0.005, ***P< 0.0005. Representative images are from CQ-treated cells. Scale bar: 5 μm
Figure 5.
Figure 5.
Genetic ablation of selective lipophagy factors impairs lipophagy in yeast. (A) Representative growth curves of WT and atg8Δ strains in SC medium. (B) Activation of lipophagy during stationary phase shown by confocal fluorescence microscopy of Faa4-GFP lipid droplets (LDs) within Vph1-mRuby2 vacuoles. (C) Appearance of the GFP fragment of the Faa4-GFP fusion protein, indicating uptake and degradation of Faa4-GFP in the vacuole. (D) Faa4-GFP cleavage in various yeast stains. (E) LDs internalization into the vacuole at day 5 of stationary phase. (F) Lipophagy quantification. Scale bar: 5 μm
Figure 6.
Figure 6.
Single lipid droplets (LD) and LD clusters are tagged for lipophagy. (A) 3D Rendering of LC3 (green) localization to LDs stained with BODIPY (blue) in THP-1 macrophages loaded with agLDL and subsequently treated or not with chloroquine (CQ) to inhibit autophagy. Scale bar: 10 μm. (B, C) Quantification of LC3+ LDs found as single LDs or on LDs within a LD cluster in cells shown in (A), expressed as a fold-change in CQ-treated cells relative to untreated (B) or as a percent total LC3+ LDs found as single or clusters of LDs (C). (D) Single and clusters of LDs observed by electron microscopy of murine macrophage foam cells (top panel). Lysosome arm-like extensions can be seen directly engulfing LDs (bottom panels). (E) Micrographs of an agLDL-loaded mouse bone marrow-derived macrophage expressing human GFP-LC3 (green) and labeled with monodansylpentane (MDH) to stain LDs (blue) and LysoTracker Red (magenta). i–ii. Zoom of the regions outlined in the main panel. i) Colocalization of a LD, lysosome and GFP-LC3 puncta. ii) Colocalization of a LD and lysosome. Scale bar: 5 μm. (F) Model of lipophagy mechanisms in mammalian macrophage foam cells, where single LDs or LD clusters are tagged for autophagic degradation, possibly beginning with a AUP1-UBE2G2 complex to initiate ubiquitin tagging of LDs for autophagic degradation. Single LDs may be engulfed by classical macroautophagy beginning with formation of autophagosomes at the phagophore assembly site (PAS) at the periphery or surface of LDs. In this scenario, phagophore maturation may be facilitated by RAB2 and RAB6. Alternatively, clusters of LDs exceeding the size of autophagosomes may be degraded through an aggrephagy-like mechanism mediated by SARs OPTN, NBR1 and SQSTM1 and lipophagy factors HSPA5 along with aggrephagy factors HDAC6 and YWHA/14-3-3 proteins to facilitate microlipophagy

References

    1. Sztalryd C, Brasaemle DL.. The perilipin family of lipid droplet proteins: gatekeepers of intracellular lipolysis. Biochim Biophys Acta Mol Cell Biol Lipids. 2017;1862(10 Pt B):1221–1232. - PMC - PubMed
    1. Ouimet M, Franklin V, Mak E, et al. Autophagy regulates cholesterol efflux from macrophage foam cells via lysosomal acid lipase. Cell Metab. 2011;13(6):655–667. - PMC - PubMed
    1. Singh R, Kaushik S, Wang Y, et al. Autophagy regulates lipid metabolism. Nature. 2009;458(7242):1131–1135. - PMC - PubMed
    1. De Duve C, Pressman BC, Gianetto R, et al. Tissue fractionation studies. 6. Intracellular distribution patterns of enzymes in rat-liver tissue. Biochem J. 1955;60(4):604–617. - PMC - PubMed
    1. Ohsumi Y. Historical landmarks of autophagy research. Cell Res. 2014;24(1):9–23. - PMC - PubMed

Publication types