. 2021 Apr;12(2):378-392.
doi: 10.1002/jcsm.12680. Epub 2021 Feb 16.

A novel tissue inhibitor of metalloproteinases-1/liver/cachexia score predicts prognosis of gastrointestinal cancer patients

Affiliations

A novel tissue inhibitor of metalloproteinases-1/liver/cachexia score predicts prognosis of gastrointestinal cancer patients

Olga Prokopchuk et al. J Cachexia Sarcopenia Muscle. 2021 Apr.

Abstract

Background: Cachexia, a devastating syndrome in cancer patients, critically determines survival and life quality. It is characterized by impaired homeostasis of multiple organs including the liver, involves tissue wasting, and is conventionally diagnosed and classified by weight loss (WL). However, recent studies pointed at the problem that WL is not sufficient for precise classification of cancer patients according to disease severity (i.e. prognosis). Tissue inhibitor of metalloproteinases-1 (TIMP-1) is an easily accessible cachexia-associated biomarker in the blood, known to alter liver homeostasis. Here, we investigated the value of combining blood levels of TIMP-1 with parameters of liver functionality towards establishment of a cachexia-associated clinical score, which predicts survival of cancer patients, reflects the clinical manifestation of cachexia, and is easily accessible in the clinic.

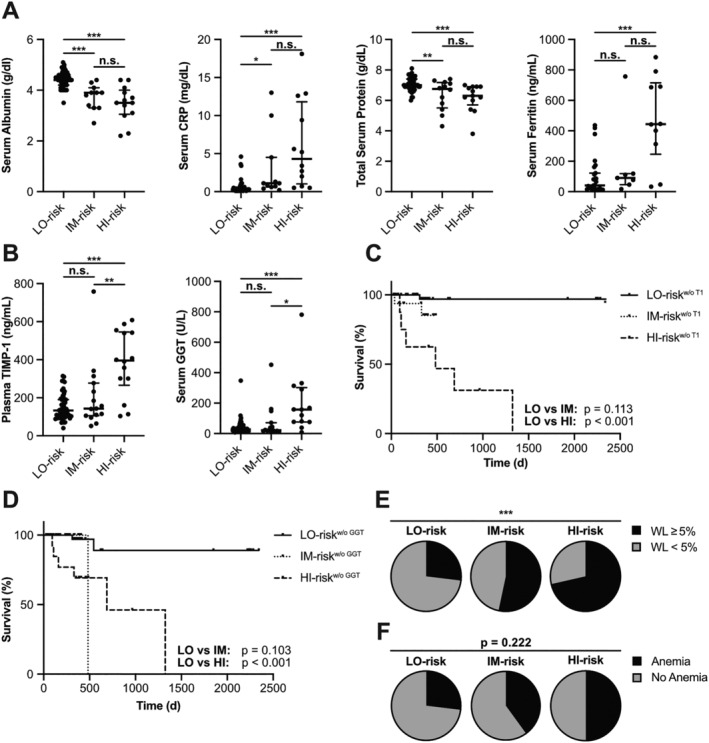
Methods: The TIMP-1/liver cachexia (TLC) score, expressed as numerical value ranging from 0 to 1, was calculated by categorizing the blood levels of TIMP-1 and parameters of liver functionality (C-reactive protein, ferritin, gamma-glutamyl transferase, albumin, and total protein) for each patient as below/above a certain risk threshold. The TLC score was tested in a cohort of colorectal cancer (CRC) patients (n = 82, 35.4% women, 64.6% men, median age: 70 years) and validated in a cohort of pancreatic cancer (PC) patients (n = 84, 54.8% women, 45.2% men, median age: 69 years).

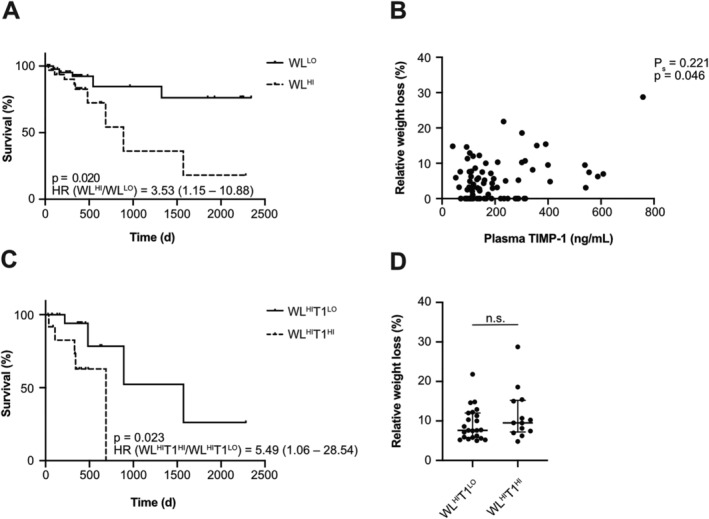
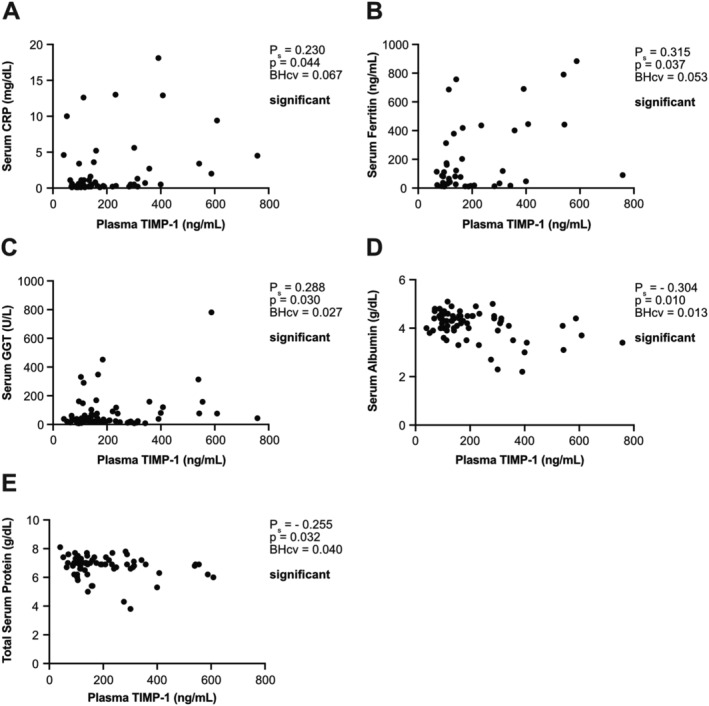
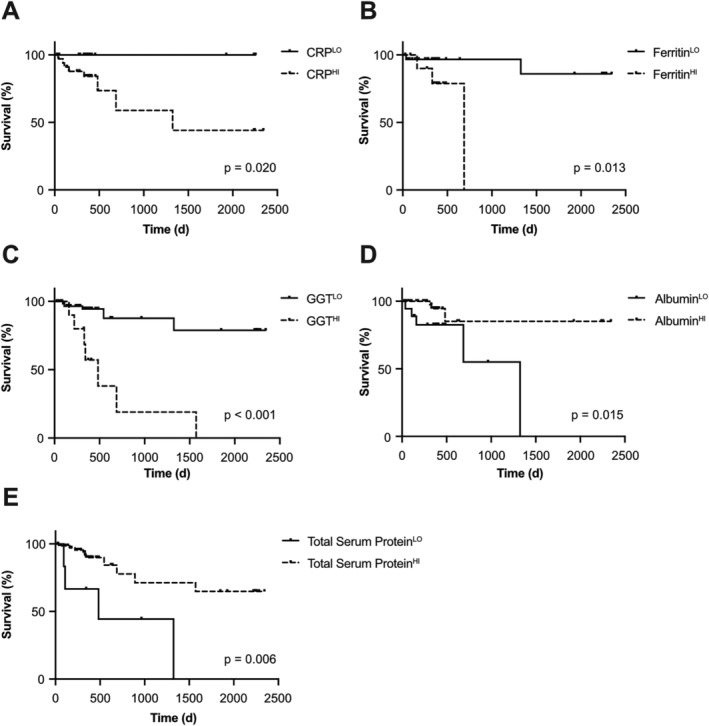
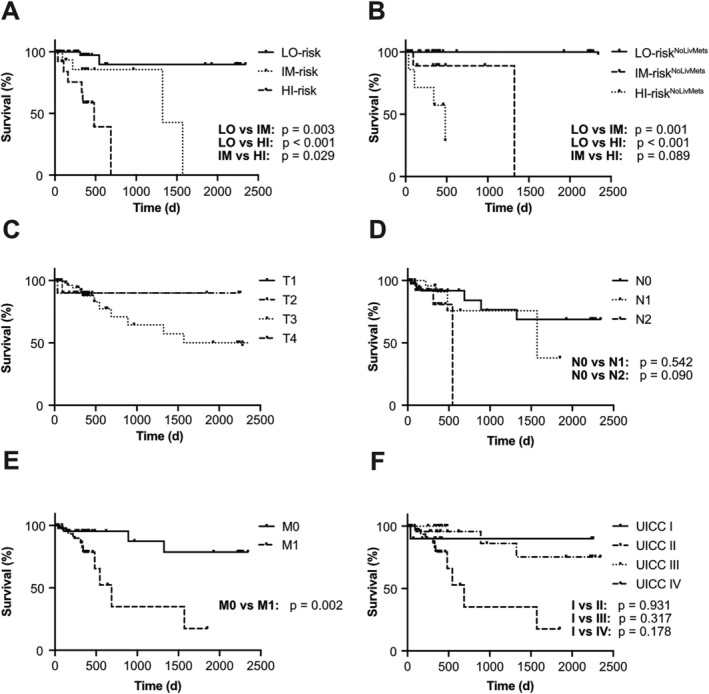
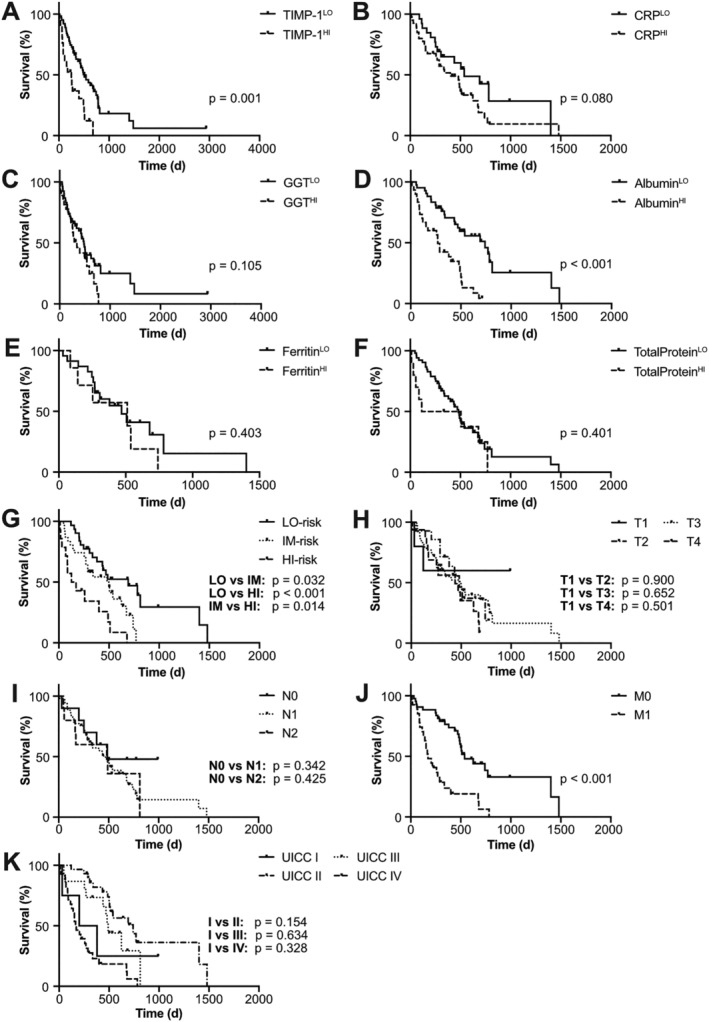
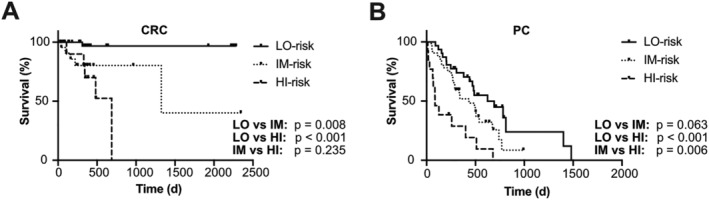
Results: In CRC patients, the TLC score positively correlated with presence of cachexia-related symptoms (WL, impaired liver function), predicted survival [P < 0.001, hazard ratio (HR): 96.91 (9.85-953.90)], and allowed classification of three prognostically distinct patient subpopulations [low (LO)-risk, intermediate (IM)-risk, and high (HI)-risk groups; LO vs. IM: P = 0.003, LO vs. HI: P < 0.001, IM vs. HI: P = 0.029]. The prognostic power of the cachexia-associated TLC score [P < 0.001, HR: 7.37 (2.80-19.49)] and its application to define risk groups (LO vs. IM: P = 0.032, LO vs. HI: P < 0.001, IM vs. HI: P = 0.014) was confirmed in a cohort of PC patients. The prognostic power of the TLC score was independent of presence of liver metastases in CRC or PC patients and was superior to clinically established staging classifications.

Conclusions: The TLC score, a result of straightforward determination of blood parameters, is an objective cachexia-associated clinical tool for precise survival prediction of gastrointestinal cancer patients.

Keywords: Cachexia; Gastrointestinal cancer; Prognostic score; TIMP-1.


Conflict of interest statement

The authors have no conflict of interest.

Figures

Figure 1
Figure 1
Plasma tissue inhibitor of metalloproteinases‐1 (TIMP‐1) levels differentiate subpopulations of weight loss (WL)‐defined cachectic colorectal cancer (CRC) patients. Survival of CRC patients (n = 80) separated by relative WL (A). Correlation of plasma TIMP‐1 levels with relative WL of CRC patients (n = 82) (B). Survival of CRC patients with increased WL (WLHI, n = 34) separated by plasma TIMP‐1 levels (C, cut‐off: 288.37 ng/mL TIMP‐1). Hazard ratios (HRs) are shown including the corresponding 95.0% confidence interval (A, C). Relative WL of WLHI CRC patients separated by plasma TIMP‐1 levels is shown as individual dots and medians with interquartile range (D).
Figure 2
Figure 2
Plasma tissue inhibitor of metalloproteinases‐1 (TIMP‐1) levels correlate with parameters of liver functionality in colorectal cancer (CRC) patients. Correlation of plasma TIMP‐1 levels with serum C‐reactive protein (CRP) (A, n = 57), ferritin (B, n = 45), gamma‐glutamyl transferase (GGT) (C, n = 77), albumin (D, n = 71), or total protein (E, n = 71) of CRC patients. Due to absence of normal distribution, Spearman correlation was employed. Positive (AC)/negative (D, E) Spearman correlation coefficients Ps indicate a positive/negative correlation. Benjamini–Hochberg critical values (BHcv) were derived from Supporting Information, Table S2.
Figure 3
Figure 3
Parameters of liver functionality predict survival of colorectal cancer (CRC) patients. Survival of CRC patients separated by serum levels of CRP [A, n = 56, cut‐off: 0.3 mg/dL C‐reactive protein (CRP)], ferritin (B, n = 43, cut‐off: 203 ng/dL ferritin), gamma‐glutamyl transferase (GGT) (C, n = 75, cut‐off: 120 U/L GGT), albumin (D, n = 70, cut‐off: 3.9 g/dL albumin), or total protein (E, n = 80, cut‐off: 5.8 g/dL total protein).
Figure 4
Figure 4
Combination of tissue inhibitor of metalloproteinases‐1 (TIMP‐1) with liver parameters predicts survival of colorectal cancer (CRC) patients. Survival of CRC patients separated by the integrative prognostic score into low‐risk (LO, n = 51), intermediate‐risk (IM, n = 15), or high‐risk (HI, n = 13) groups (A). Survival of CRC patients without liver metastases separated by the integrative prognostic score into low‐risk (LONoLivMets, n = 38), intermediate‐risk (IMNoLivMets, n = 9), or high‐risk (HINoLivMets, n = 7) groups (B). Survival of CRC patients separated by tumour (T, n = 80) status (C), lymph node (N, n = 79) status (D), metastasis (M, n = 80) status (E), or Union for International Cancer Control (UICC) classification (n = 79, F). No P value could be calculated to compare the respective tumour status groups, as there was a too low number of patients with T1 (n = 1).
Figure 5
Figure 5
Cachexia is reflected by the tissue inhibitor of metalloproteinases‐1 (TIMP‐1)/liver cachexia (TLC) score combining TIMP‐1 with liver parameters. Serum levels of albumin (A, far left), C‐reactive protein (CRP) (A, center left), total protein (A, center right), ferritin (A, far right), and gamma‐glutamyl transferase (GGT) (B, right) as well as plasma levels of TIMP‐1 (B, left) of colorectal cancer (CRC) patients grouped according to the TLC score are shown as individual dots and medians with interquartile range. Survival of CRC patients separated by the modified TLC score without considering TIMP‐1 (C, n = 71) or GGT (D, n = 71). Proportion of CRC patients with low (<5%) vs. high (≥5%) weight loss (WL) (E), or with absence vs. presence of anaemia (F), grouped according to the TLC score.
Figure 6
Figure 6
Tissue inhibitor of metalloproteinases‐1 (TIMP‐1)/liver cachexia (TLC) score predicts survival of pancreatic cancer (PC) patients. Survival of PC patients separated by plasma levels of TIMP‐1 (A, n = 84, cut‐off: 300 ng/mL TIMP‐1), or serum levels of C‐reactive protein (CRP) (B, n = 66, cut‐off: 0.3 mg/dL CRP), gamma‐glutamyl transferase (GGT) (C, n = 80, cut‐off: 120 U/L GGT), albumin (D, n = 72, cut‐off: 4.0 g/dL albumin), ferritin (E, n = 30, cut‐off: 300 ng/mL ferritin), or total protein (F, n = 62, cut‐off: 6.0 g/dL total protein). Survival of PC patients separated by the TLC score (G, n = 76), the tumour (T) status (H, n = 74), the lymph node (N) status (I, n = 73), the metastasis (M) status (J, n = 70), or the Union for International Cancer Control (UICC) classification (K, n = 76).
Figure 7
Figure 7
A standardized tissue inhibitor of metalloproteinases‐1 (TIMP‐1)/liver cachexia (sTLC) score predicts survival of colorectal cancer (CRC) and pancreatic cancer (PC) patients. Survival of CRC (A, n = 70) or PC (B, n = 76) patients separated by the sTLC score (RThTIMP‐1: 300 ng/mL, NCRGGT,female < 40 U/L, NCRGGT,male < 60 U/L, NCRCRP < 0.3 mg/dL, NCRferritin,female 15–150 ng/mL, NCRferritin,male 15–200 ng/mL, NCRalbumin 3.5–5.0 g/dL, NCRtotalprotein 6.0–8.0 g/dL).

Similar articles

Cited by

References

    1. Bray F, Ferlay J, Soerjomataram I, Siegel RL, Torre LA, Jemal A. Global cancer statistics 2018: GLOBOCAN estimates of incidence and mortality worldwide for 36 cancers in 185 countries. CA Cancer J Clin 2018;68:394–424. - PubMed
    1. Quaresma M, Coleman MP, Rachet B. 40‐year trends in an index of survival for all cancers combined and survival adjusted for age and sex for each cancer in England and Wales, 1971–2011: a population‐based study. The Lancet 2015;385:1206–1218. - PubMed
    1. Stewart GD, Skipworth RJ, Fearon KC. Cancer cachexia and fatigue. Clin Med (Lond) 2006;6:140–143. - PMC - PubMed
    1. Schmidt SF, Rohm M, Herzig S, Berriel Diaz M. Cancer cachexia: more than skeletal muscle wasting. Trends Cancer 2018;4:849–860. - PubMed
    1. Argiles JM, Stemmler B, Lopez‐Soriano FJ, Busquets S. Inter‐tissue communication in cancer cachexia. Nat Rev Endocrinol 2018;15:9–20. - PubMed

Publication types

Substances