. 2021 Feb 16:10:e61135.
doi: 10.7554/eLife.61135.

A spinoparabrachial circuit defined by Tacr1 expression drives pain

Affiliations

A spinoparabrachial circuit defined by Tacr1 expression drives pain

Arnab Barik et al. Elife. .

Abstract

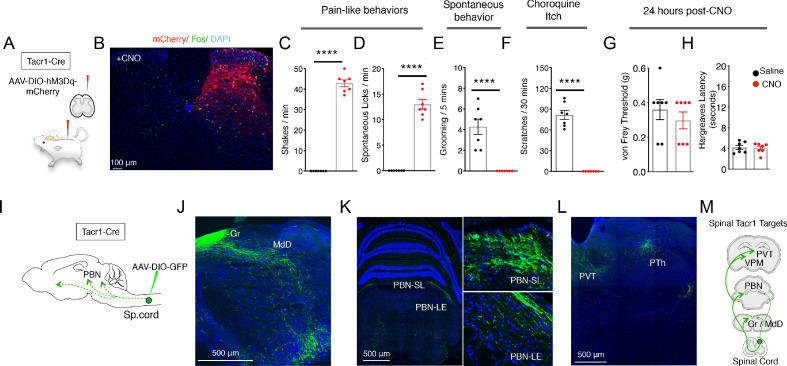
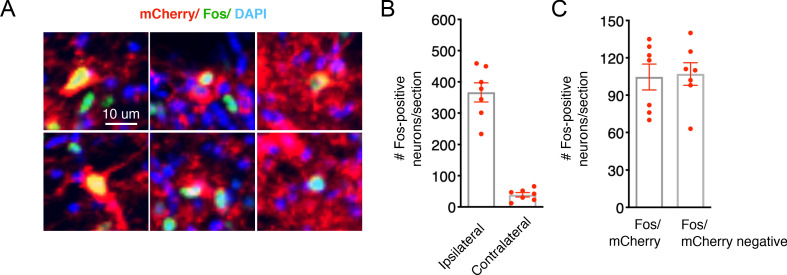
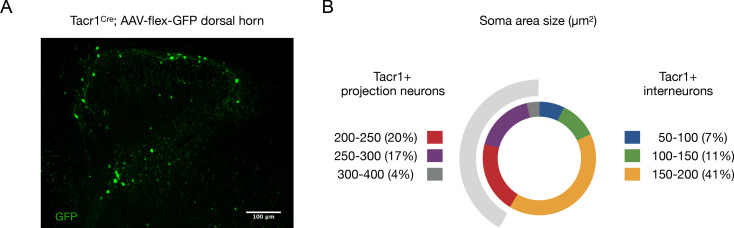
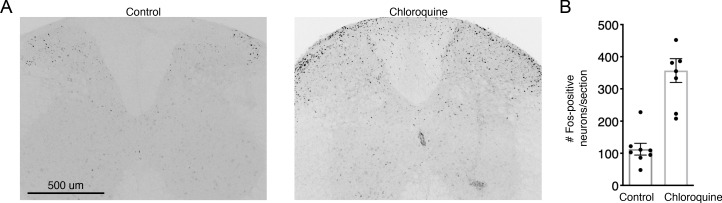
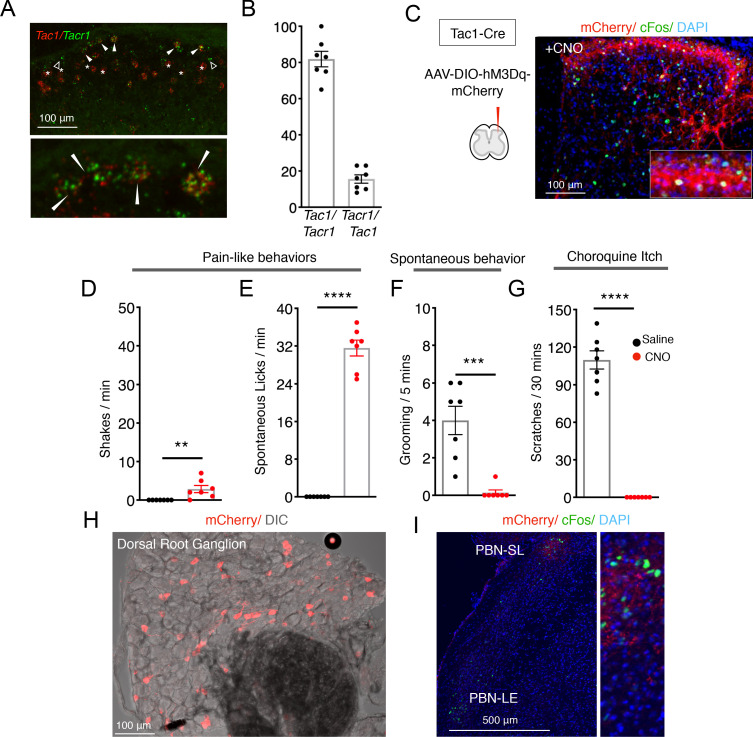
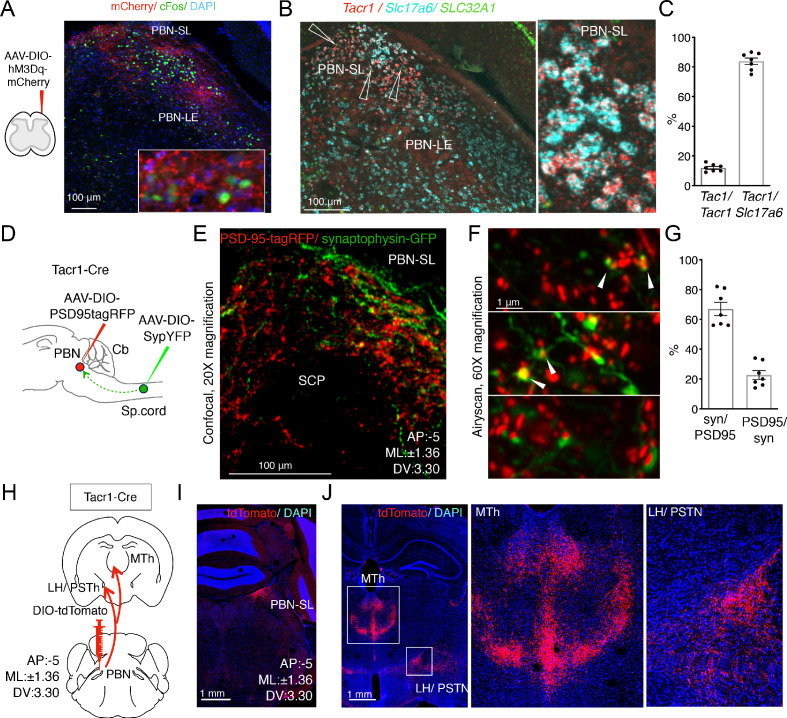
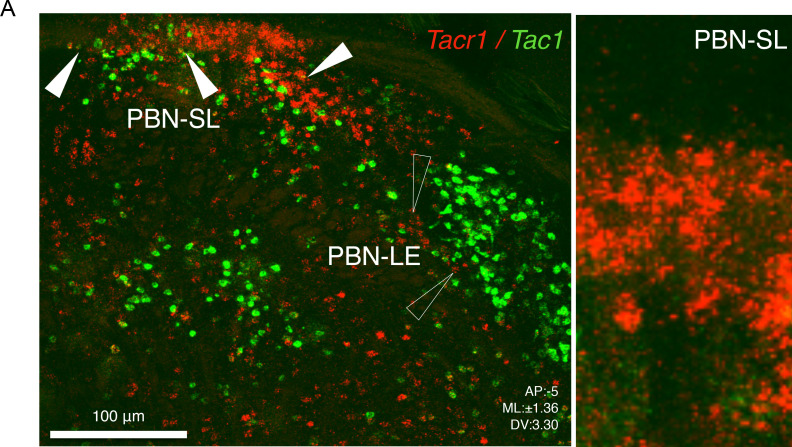
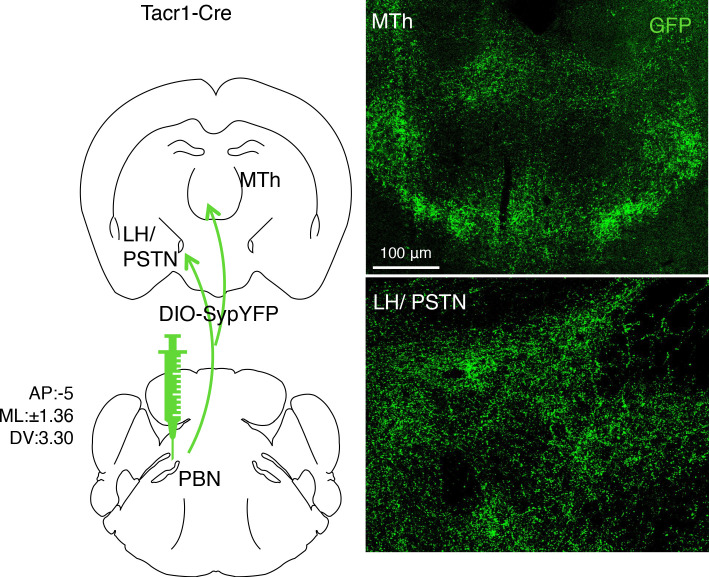
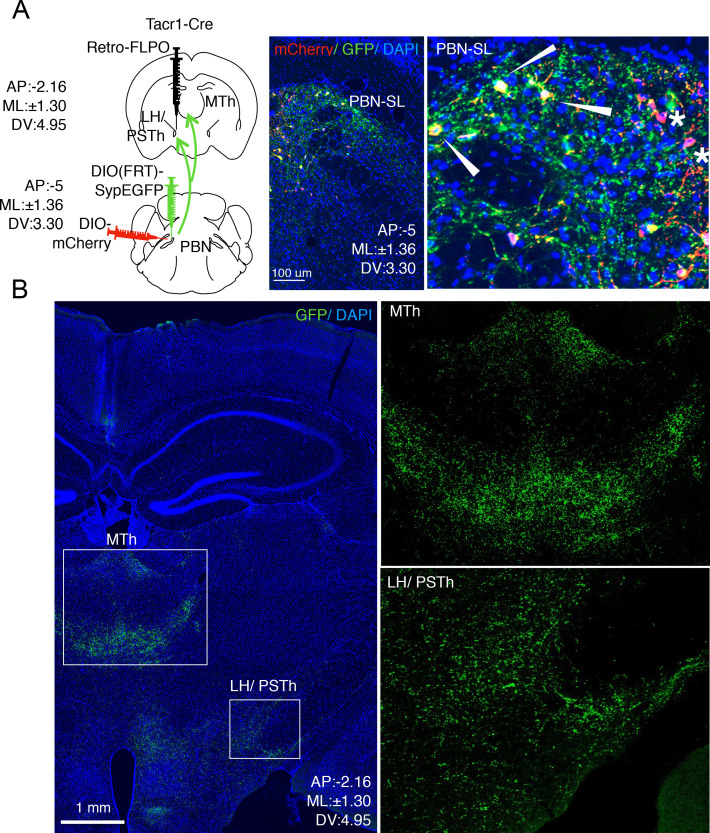
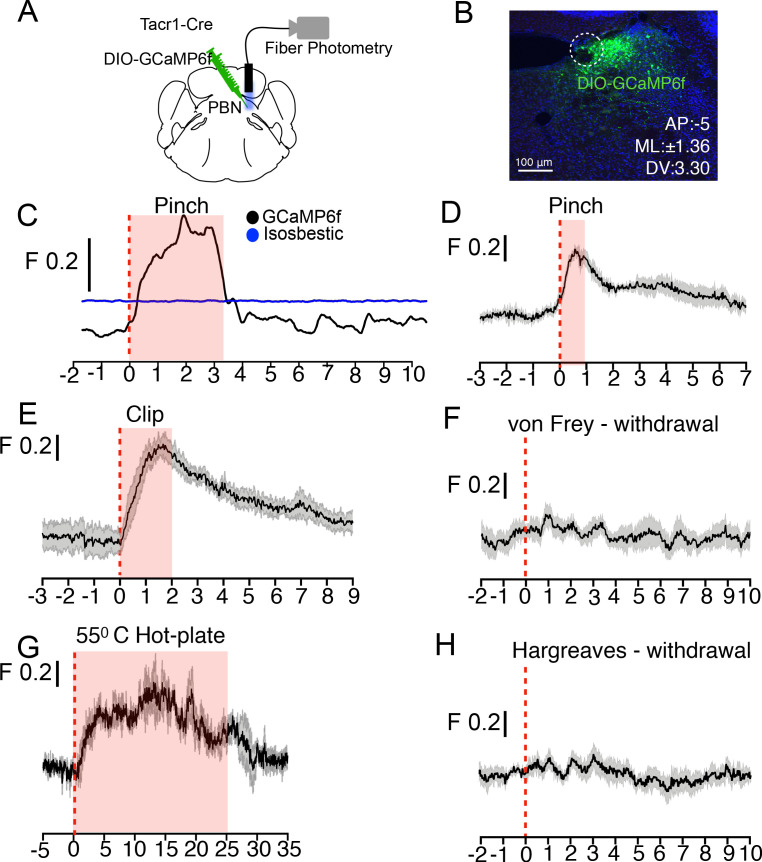
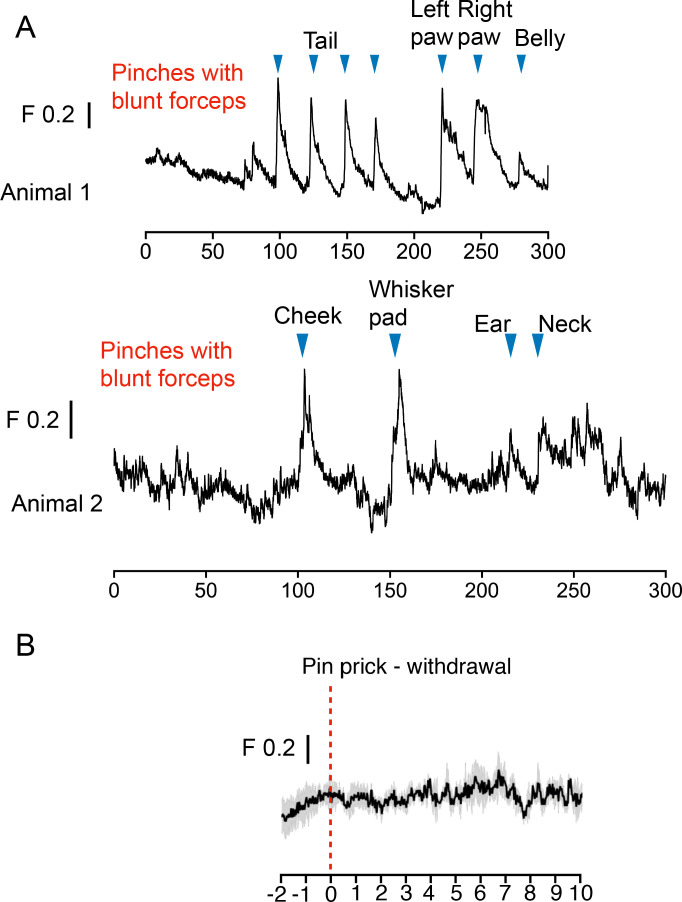
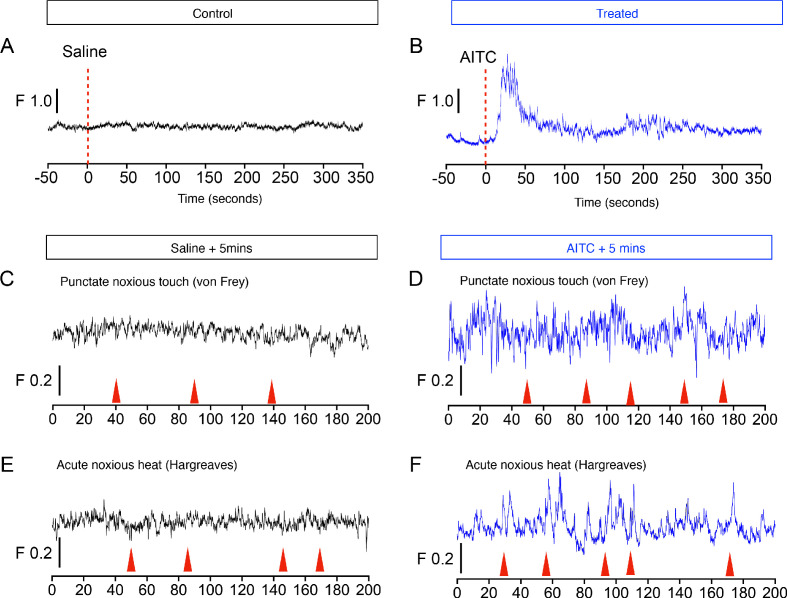
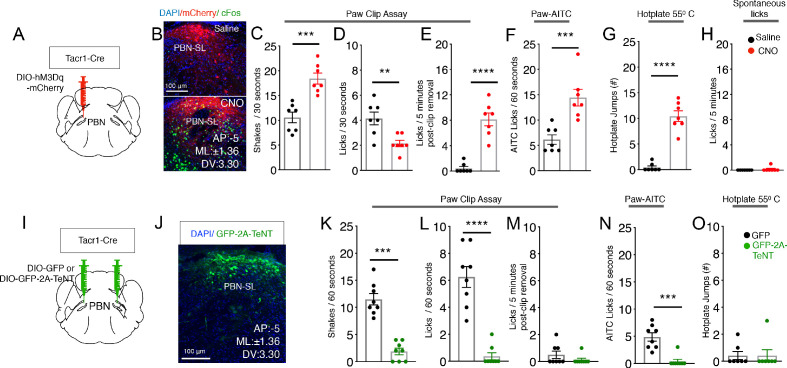
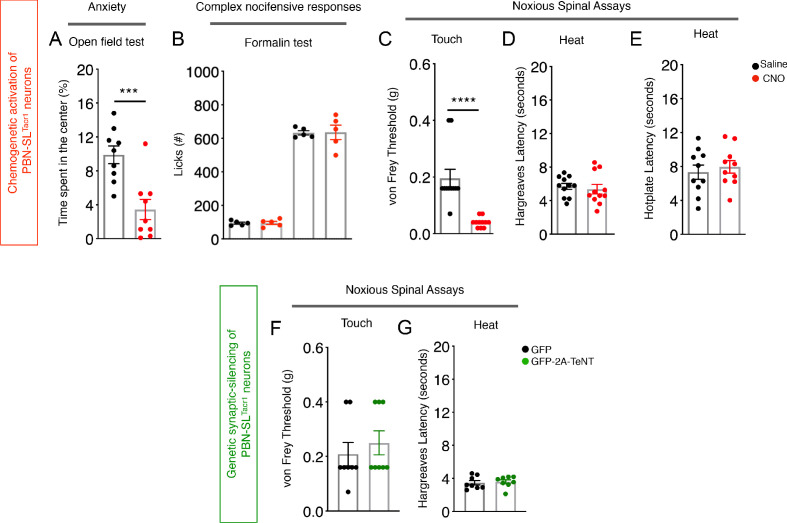
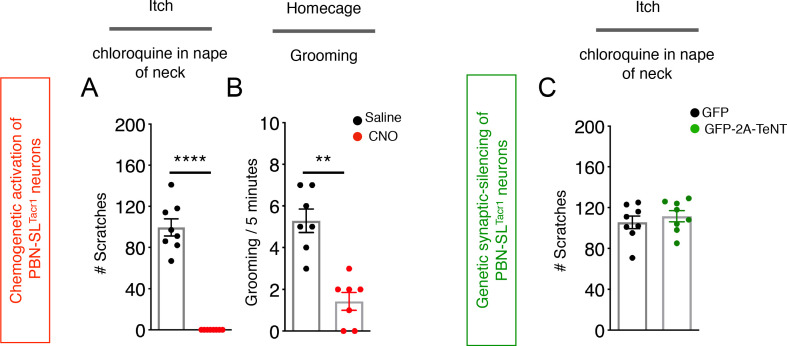
Painful stimuli evoke a mixture of sensations, negative emotions and behaviors. These myriad effects are thought to be produced by parallel ascending circuits working in combination. Here, we describe a pathway from spinal cord to brain for ongoing pain. Activation of a subset of spinal neurons expressing Tacr1 evokes a full repertoire of somatotopically directed pain-related behaviors in the absence of noxious input. Tacr1 projection neurons (expressing NKR1) target a tiny cluster of neurons in the superior lateral parabrachial nucleus (PBN-SL). We show that these neurons, which also express Tacr1 (PBN-SLTacr1), are responsive to sustained but not acute noxious stimuli. Activation of PBN-SLTacr1 neurons alone did not trigger pain responses but instead served to dramatically heighten nocifensive behaviors and suppress itch. Remarkably, mice with silenced PBN-SLTacr1 neurons ignored long-lasting noxious stimuli. Together, these data reveal new details about this spinoparabrachial pathway and its key role in the sensation of ongoing pain.

Keywords: brainstem; mouse; neuroscience; pain; parabrachial nucleus; somatosensation; spinal cord.


Conflict of interest statement

AB, AS, JT, MS, AL, AC No competing interests declared

Figures

Figure 1.
Figure 1.. Activation of Tacr1+ projection neurons causes fictive pain.
(A) A cartoon depicting the strategy to stimulate Tacr1-positive spinal neurons. An AAV viral vector encoding a Cre-dependent stimulating DREADD receptor (AAV-DIO-hM3Dq-mCherry) was injected into the lumbar spinal cord of Tacr1-Cre mice to transduce a localized subset of Tacr1-neurons. (B) A confocal image of a coronal section of lumbar spinal cord from an injected Tacr1-Cre mouse shows that the hM3Dq expression (red) is limited to neurons in the ipsilateral superficial and deep dorsal horn. CNO administration results in induction of the activity-dependent gene Fos (green). Scale = 100 μm (C–H) Bar graphs showing quantified CNO-induced behavioral responses; saline control, black; CNO, red; n = 7 mice/group; ****p≤0.0001, unpaired two-tailed t test. CNO-induced typical pain responses: ipsilateral hindpaw shaking (C; p<0.0001) and licking (D; p=<0.0001), suppressed normal grooming (E; p=<0.0001) and itch responses to chloroquine injection in a different somatotopic site (F; p=<0.0001). As expected, behavioral changes were fully reversible after 24 hr (G–H): shown are threshold responses to punctate touch (von Frey in grams; G; p=0.4245) and latencies to respond to radiant heat (Hargreaves test; H; p=0.7640). (I) A cartoon depicting the strategy to label the ascending projections of a small, circumscribed group of Tacr1+ projection neurons. An AAV viral vector encoding a Cre-dependent GFP marker (AAV-DIO-GFP) was injected into the L4 region of the lumbar spinal cord of Tacr1-Cre mice. (J–L) Coronal sections showing major targets of SpinalTacr1 neurons. In the brainstem, dense GFP-labeled projections were detected in (J) the gracile nucleus (Gr), reticular formation (MdD) and (K) two regions of the parabrachial nucleus (PBN-EL and PBN-SL). GFP-positive SpinalTacr1 projections are also observed in midline brain regions: the paraventricular thalamus (PVT) and posterior thalamus (PTh). (M) A cartoon summarizing the ascending pathway of spinal Tacr1-expressing projection neurons. Green = GFP; Blue = DAPI. Scales = 500 μm.
Figure 1—figure supplement 1.
Figure 1—figure supplement 1.. Validation of chemogenetic strategy to stimulate SpinalTacr1 neurons.
(A) A higher magnification view of the confocal image shown in Figure 1B highlighting cells expressing hM3Dq-mCherry (red) that have nuclear localized Fos protein (green) after CNO application. (B) Quantification of the total number of Fos positive cells in the dorsal horn after CNO application on the side ipsilateral to the AAV injection as compared to the contralateral side. Individual points are total number of positive cells per section. (C) In these sections, Fos is detected in a mixture of mCherry positive and negative cells. Note there are less cells in this quantification than in (B) because Fos positive cells with unclear mCherry labelling were not included in this quantification (n = 7 section; n = 3 mice).
Figure 1—figure supplement 2.
Figure 1—figure supplement 2.. Tacr1Cre labels both projection neurons and interneurons.
(A) A representative confocal image of a spinal cord section from a Tacr1Cre mouse with an AAV-flex-GFP injected into the dorsal horn showing numerous GFP-labeled neurons (green). (B) Quantification of the diameters of GFP+ neurons show 41% of labeled cells are presumptive projection neurons based on their soma area size (≥200 µm2; grey shaded region; Al Ghamdi et al., 2009). n = 9 sections; n = 2 mice.
Figure 1—figure supplement 3.
Figure 1—figure supplement 3.. Fos induction by Chloroquine injection into the midline nape of the neck is not suppressed by chemogenetic activation of SpinalTacr1 neurons in lumbar region.
(A) Representative confocal images of Fos staining and (B) quantification from the cervical spinal cord in control (left) and chloroquine injected (right). Note that in both cases, spinalTacr1 neurons expressing hM3Dq were stimulated with CNO showing that type of stimulation does not repress Fos induction to this puritogen even though it does suppress scratching behavior (see Figure 1F). n = 7 sections; n = 3 mice.
Figure 1—figure supplement 4.
Figure 1—figure supplement 4.. Tac1 and Tacr1 are co-expressed in nociceptive spinal projection neurons.
(A) A confocal image of a coronal spinal cord section showing the detection of mRNA for Tac1 (red) and Tacr1 (green) using two-color fluorescent in situ hybridization. Filled arrowheads indicate cells co-expressing both genes, open arrowheads are Tacr1-only cells. Note that there are many red cells that are not green (stars) below the superficial part of the dorsal horn (Lamina I) consistent with Tac1 also being expressed in excitatory interneurons. Lower panel is a higher magnification of the superficial dorsal horn region highlighting doubly positive cells (arrowheads). Scale = 100 μm. (B) Quantification of the number of Tacr1+ cells expressing Tac1 (left) and Tac1+ cells expressing Tacr1 (right). n = 5 sections; n = 2 mice. (C) An AAV viral strategy analogous to the one used (Figure 1) to activate SpinalTacr1 neurons was used to express the excitatory DREADD (hM3Dq-mCherry) in lumbar SpinalTac1 neurons. Confocal images of coronal spinal cord sections from infected mice after CNO administration and stained with DAPI (blue) revealed mCherry-positive neurons (red) and widespread induction of Fos (green). Inset shows a higher magnification view. Scale = 100 μm. (C–G) Stimulation of SpinalTac1 neurons results in ‘fictive pain’ behaviors. Bar plots show the behaviors of mice (n = 7) treated with saline (black) and CNO (red) show that hM3Dq-mediated activation of SpinalTac1 neurons results in shaking (C; p=0.0086) and licking (D; p=<0.0001) of the ipsilateral hindlimb, suppression of normal grooming behaviors (E; p=0.0003), and inhibition of responses to the pruritogen chloroquine applied to the nape of the neck (F; p=<0.0001). Unpaired two-tailed t test; ****p≤0.0001. (H) Spinal injection of AAV-DIO-hM3Dq-mCherry in Tac1Cre mice retrogradely labeled nociceptors in the dorsal root ganglia (red). Scale = 100 μm. (I) SpinalTac1 neurons labeled with hM3Dq-mCherry project to the PBN-SL (red). CNO activation of these cells results in Fos induction (green) in this brain region. Scale = 500 μm.
Figure 2.
Figure 2.. Anatomical organization of a Tacr1-defined spinoparabrachial circuit.
(A) SpinalTacr1 neurons were transduced to express hM3Dq-mCherry (cartoon, left); typical confocal image of a coronal section of the PBN showing mCherry-positive SpinalTacr1 projections (right panel, red) in two regions of the PBN (PBN-EL and PBN-SL). Application of CNO resulted in Fos induction throughout the PBN (green). The nuclear stain DAPI (blue) highlights the overall anatomy of the region. Scale = 100 μm. (B) Multichannel in situ hybridization shows Tacr1 transcript (red) is localized to the PBN-SL. Co-staining for the glutamate vesicular transporter Slc17a6 (Vglut2; cyan) and GABA vesicular transporter SLC32A1 (Vgat; green) reveals most Tacr1-positive PBN-SL neurons are glutamatergic and hence excitatory. (C) Quantification of the percentage of Tacr1-positive cells co-expressing Tac1 (left plot) and Vglut2 (right plot). (D) A cartoon depicting the strategy used to label spinalTacr1 presynaptic specializations and PBN-SLTacr1 postsynaptic specializations in the same animal. Cre-dependent viral vectors were injected in the lumbar spinal cord (AAV-DIO-SypYFP to label presynaptic termini) and PBN (AAV-PSD95tagRFP to label postsynaptic densities) in Tacr1Cre mice. (E) Example confocal image of a coronal section from the PBN showing a low-magnification view of the organization of SpinalTacr1 presynaptic specializations (green) and PBN-SLTacr1 postsynaptic specializations (red). Scale = 100 μm.(F) Super-resolution imaging (Airyscan) of sections from three different mice showing close apposition of SypYFP and PSD95tagRFP puncta indicative of synaptic connections. Scale = 1 μm. (G) Quantification of number of SypYFP puncta with PSD95tagRFP puncta in close apposition (left graph) and vice versa (right graph) demonstrate that the majority of spinal projection neurons target PBN-SLTacr1 neurons; n = 7 sections from n = 3 mice. (H) A cartoon depicting the viral strategy for anterograde tracing of PBN-SLTacr1 neuron projections using injection of AAV-DIO-tdTomato into the PBN of Tacr1Cre mice. (I) Confocal image of coronal section showing tdTomato labeling (red) of cell bodies of PBN-SLTacr1 neurons. (J) Dense projections were found in two major brain regions, (left image; boxed regions): the medial thalamus (MTh) and a region encompassing part of the lateral hypothalamus (LH) and the parasubthalamic nucleus (PSTN). Right images show larger magnification views of boxed regions. Scale = 1 mm.
Figure 2—figure supplement 1.
Figure 2—figure supplement 1.. Tac1 and Tacr1 are differentially expressed in the PBN.
Typical confocal image of two color in situ hybridization showing Tacr1 expression (red) is enriched in the PBN-SL and is largely non-overlapping with Tac1 (green). Right side is an enlargement of the PBN-SL showing densely clustered Tacr1 neurons. Scale = 100 μm.
Figure 2—figure supplement 2.
Figure 2—figure supplement 2.. Viral-assisted visualization of PBN-SLTacr1 projection terminals.
The presynaptic terminals of PBN-SLTacr1 neurons were labeled by transducing Tacr1cre mice with a viral vector encoding a Cre-dependent synaptophysin-GFP fusion construct (AAV-DIO-SypYFP). Confocal imaging of coronal sections of the Medial Thalamus (MTh) and Lateral Hypothalamus/Parasubthalamic nucleus (LH/PSTN) reveal densities of GFP-positive puncta in both regions indicating that PBN-SLTacr1 neurons make presynaptic terminals in both regions. Scale = 100 μm.
Figure 3.
Figure 3.. PBN-SLTacr1 neurons collateralize and project to both MTh and LH/PSTN.
(A) A complex intersectional genetic strategy was devised to label PBN-SL neurons that project to LH/PSTN and examine if they project to other brain areas (cartoon left side). The terminals of PBN neurons in the LH/PSTN were transduced with retrograde viral vector encoding Flp recombinase in a Tacr1cre mouse. In the same animal, two viral additional vectors were co-injected into the PBN. The first encoded a Flp-dependent presynaptic marker (SypGFP) and the second encoded a Cre-dependent cellular marker (mCherry). Under these conditions, the cells bodies and axons of PBN neurons that project to LH/PSTN (and were transduced by the retrograde Flp-virus) are labeled in green and PBN-SLTacr1 neurons are labeled in red. Confocal images of coronal sections of the PBN (right panels) show a high degree of overlap between red (mCherry) and green (SypGFP) confirming the PBN-SLTacr1 neurons project to LH/PSTN (arrowheads). Note that not every cell is co-labelled, as expected when examining the intersecting expression of three different AAVs injected at two distinct sites (stars). Blue = DAPI stain; Scale = 100 μm. (B) PBN-SL neurons that project to LH/PSTN have collaterals that make presynaptic terminal specializations in the MTh. Confocal image of a coronal section of a mouse where PBN neurons that project to the LH/PSTN were labeled with SypGFP. As expected, many GFP-positive puncta are seen in the LH/PSTN (boxed region, lower right). Notably, a high density of GFP-positive puncta is also found in the MTh in the same section (boxed region, center). High magnifications of each boxed area are shown on the right side. Blue = DAPI stain; Scale = 1 mm.
Figure 4.
Figure 4.. PBN-SLTacr1 neurons respond to sustained noxious stimulation.
(A) Cartoon depicting the approach for recording population activity in PBN-SLTacr1 neurons: a Cre-dependent viral vector encoding the genetically encoded calcium indicator GCaMP6f was injected into the PBN of Tacr1Cre mice and an optical fiber was placed over the injection site. Fiber photometry recording was used to monitor population calcium responses to different somatosensory stimuli. (B) After recording, posthoc staining and confocal imaging of PBN sections confirmed GCaMP6f expression (green) and fiber placement (dotted line). (C) An example photometry trace from a lightly anesthetized mouse showing a robust, time-locked calcium response to tail pinch with blunt forceps (stimulus onset at 0 s; dotted line). Note the response lasts the duration of the stimulation (shaded region) before returning to baseline. As a control for movement artifacts, 405 fluorescence (Blue trace; Isosbestic) was also monitored and showed no changes. (D–H) Average population calcium responses in awake mice to sustained (D, E, and G) and acute (F, H) noxious stimuli. Dark lines are means of responses from multiple animals aligned to the start of stimulation (time 0) with the standard error shown in light grey. X-axis shows time in seconds aligned to the start of stimulation; F indicates ΔF/F scaling (D) Pinching (hindpaw) with a blunt forcep (n = 6 mice). (E) Clip assay applied to hindpaw (n = 5 mice). (F) von Frey stimulation (0.6 g) aligned to paw withdrawal (n = 4 mice) (G) 55°C Hot plate test aligned to when mice are placed in a chamber and lasting 25 s (n = 3 mice). (H) Radiant heat test (Hargeaves) aligned to paw withdrawal (n = 7 mice). For all traces, time is in seconds, 0 is the start of the trial, change in fluorescence/total fluorescence is shown (black line; F).
Figure 4—figure supplement 1.
Figure 4—figure supplement 1.. Population calcium responses in PBN-SLTacr1 neurons to pinch are not somatotopically restricted.
(A) Example traces from two separate lightly anesthetized mice showing robust responses to a series of sustained pinches with blunt forceps (blue arrowheads) of different body parts (tail, left hindpaw, right hindpaw, belly, cheek, whisker pad, ear, and neck). (B) Noxious pinprick does not evoke a population calcium response although does cause a rapid nocifensive withdrawal behavior (red dashed line = stimulation). For all traces, time is in seconds, 0 is the start of the trail, change in fluorescence/total fluorescence is shown (black line; F).
Figure 4—figure supplement 2.
Figure 4—figure supplement 2.. The chemical irritant allyl isothiocyanate (AITC) evokes large and sustained increases in calcium signaling in PBN-SLTacr1 neurons.
Example traces from an awake mouse to topical application of saline (A; black traces) and AITC (B; blue traces) on the hindpaw. AITC evokes a very robust response followed by long-lasting increases in spontaneous calcium transients. Note that despite the increased baseline activity and behavioral hyperalgesia after application, AITC pre-treatment (>5 min) does not change the sensitivity of these neurons to acute noxious stimulation. Both acute noxious mechanical (C, D) or thermal (E, F) stimuli fail to activate PBN-SLTacr1 neurons either in control or AITC treated conditions. Red arrows indicate behavioral responses (paw withdrawals). Time is in seconds, 0 is the start of the trail, change in fluorescence/total fluorescence is shown (black line; F).
Figure 5.
Figure 5.. PBN-SLTacr1 neurons are necessary and sufficient to drive pain-related behaviors.
(A–H) Chemogenetic activation of PBN-SLTacr1 neurons results in hyperalgesia. (A) A cartoon depicting the strategy for stimulation of PBN-SLTacr1 neurons. The PBN of a Tacr1Cre mouse was injected with a Cre-dependent viral vector encoding an excitatory DREADD receptor (AAV-DIO-hM3Dq-mCherry) to allow chemogenetic activation. (B) Typical confocal images showing coronal sections of the PBN region from transduced Tacr1Cre mice treated with saline (top image) or CNO (bottom image). The expression of mCherry in both animals is restricted to select neurons in the PBN-SL (red). CNO application but not saline injection results in induction of the activity-dependent gene Fos (green) validating the approach. Scale = 100 μm. (C–G) Chemogenetic stimulation of PBN-SLTacr1 neurons heightens behavioral responses sustained by noxious mechanical (C–E), chemical (F), and thermal (G) stimulation (n = 7 mice tested with saline, black points and then with CNO, red points on different days). Mice treated with CNO spend significantly more time shaking (C; p=0.0003) and as a result exhibited less licking events (D; p=0.0044) directed to the hindpaw during the Clip assay. Notably, CNO-treated mice continued to lick the hindpaw for several minutes after the clip was removed (E; p=<0.0001). CNO treatment also increased the number of times mice licked their paws after topical AITC treatment (F; p=0.0009) and jumped to escape from a 55°C hotplate (G; p=<0.0001). CNO treatment did not increase result in licking behaviors in the absence of noxious stimulation (H; 0.3370). (I–O) Silencing of PBN-SLTacr1 neurons inhibits normal pain responses to sustained noxious stimuli. (I) A cartoon depicting the strategy for silence the output of PBN-SLTacr1 neurons. Bilateral injection of a Cre-dependent viral vector encoding Tetanus Toxin Light C GFP fusion (AAV-DIO-GFP-2A-TeNT) in Tacr1Cre mice was used to silence PBN-SLTacr1 neurons; AAV-DIO-GFP served as a control. (J) Typical confocal image of a coronal section through the PBN region showing the restricted expression of GFP-2A-TeNT in the PBN-SL (green). Scale = 100 μm. (K–O) Silencing of PBN-SLTacr1 neuronal output significantly dampened behavioral responses to sustained noxious mechanical (K–M), chemical (N) and thermal (O) stimulation (n = 8 GFP, black points; n = 7 TeNT-GFP, green points). In the Clip (sustained pinch assay, K–M), expression of GFP-2A-TeNT in PBN-SLTacr1 neurons decreases the time spent shaking (K; p=0.0003) and the number of licking events (L; p=<0.0001). Similarly, silencing PBN-SLTacr1 neurons significantly decreased the number of times mice licked their paws after topical AITC treatment (N; p=0.0001); since control animals did not make escape attempts from a 55°C hot plate (O; p=>0.9999) no effect of neuronal silencing was observed in this assay. Unpaired two-tailed t test; ns > 0.05, ***p≤0.001, ****p≤0.0001.
Figure 5—figure supplement 1.
Figure 5—figure supplement 1.. Activation of PBN-SLTacr1 neurons results in a state resembling hyper-vigilance.
(A) Chemogenetic activation of PBN-SLTacr1 neurons expressing hM3Dq with CNO (red points) decreased the amount of time mice spent in the center of an open-field arena. p=0.0009. (B) Number of licks due to intraplantar formalin injection were not altered due to CNO administration in PBN-SLTacr1 mice. (C) Mice treated with CNO also display hypersensitivity to gentle punctate touch as measured by a decreased von Frey threshold. p=<0.0001. CNO treatment did not alter the latency to first response in two thermal assays, Hargreaves (D; p=0.6422) or Hotplate (E; 0.5853). n = 10 mice. (F–G) Silencing the output from PBN-SLTacr1 neurons with GFP-2A-TeNT (green points) did not alter von Frey thresholds (E; p=0.5078) or latency to respond to heat (F; p=0.0007). n = 8 GFP; n = 7 GFP-2A-TeNT. Unpaired two-tailed t test; ns > 0.05, ***p≤0.001, ****p≤0.0001.
Figure 5—figure supplement 2.
Figure 5—figure supplement 2.. Activation of PBN-SLTacr1 neurons suppresses scratching.
(A) Injection of the puritogen chloroquine into the nape of the neck induces robust scratch responses in controls (saline injected mice, black points) that are completely suppressed by chemogenetic activation of PBN-SLTacr1 neurons expressing hM3Dq (CNO, red points). p=<0.0001 (B) Similarly, activation of these neurons also reduced grooming behavior. p=0.0078. n = 10 mice (C) Silencing PBN-SLTacr1 neuronal output with GFP-2A-TeNT had no effect on scratching responses. n = 8 GFP; n = 7 GFP-2A-TeNT. p=0.4800. Unpaired two-tailed t test; ns > 0.05, **p≤0.01, ****p≤0.0001.

References

    1. Abdus-Saboor I, Fried NT, Lay M, Burdge J, Swanson K, Fischer R, Jones J, Dong P, Cai W, Guo X, Tao YX, Bethea J, Ma M, Dong X, Ding L, Luo W. Development of a mouse pain scale using Sub-second behavioral mapping and statistical modeling. Cell Reports. 2019;28:1623–1634. doi: 10.1016/j.celrep.2019.07.017. - DOI - PMC - PubMed
    1. Al Ghamdi KS, Polgár E, Todd AJ. Soma size distinguishes projection neurons from neurokinin 1 receptor-expressing interneurons in Lamina I of the rat lumbar spinal dorsal horn. Neuroscience. 2009;164:1794–1804. doi: 10.1016/j.neuroscience.2009.09.071. - DOI - PMC - PubMed
    1. Albin KC, Carstens MI, Carstens E. Modulation of oral heat and cold pain by irritant chemicals. Chemical Senses. 2008;33:3–15. doi: 10.1093/chemse/bjm056. - DOI - PubMed
    1. Barik A, Thompson JH, Seltzer M, Ghitani N, Chesler AT. A Brainstem-Spinal circuit controlling nocifensive behavior. Neuron. 2018;100:1491–1503. doi: 10.1016/j.neuron.2018.10.037. - DOI - PubMed
    1. Basbaum AI, Bautista DM, Scherrer G, Julius D. Cellular and molecular mechanisms of pain. Cell. 2009;139:267–284. doi: 10.1016/j.cell.2009.09.028. - DOI - PMC - PubMed

Publication types