. 2021 Mar;10(5):1848-1859.
doi: 10.1002/cam4.3748. Epub 2021 Feb 16.

An autophagic gene-based signature to predict the survival of patients with low-grade gliomas

Affiliations

An autophagic gene-based signature to predict the survival of patients with low-grade gliomas

Jian Chen et al. Cancer Med. 2021 Mar.

Abstract

Background: Since autophagy remains an important topic of investigation, the RNA-sequence profiles of autophagy-related genes (ARGs) can provide insights into predicting low-grade gliomas (LGG) prognosis.

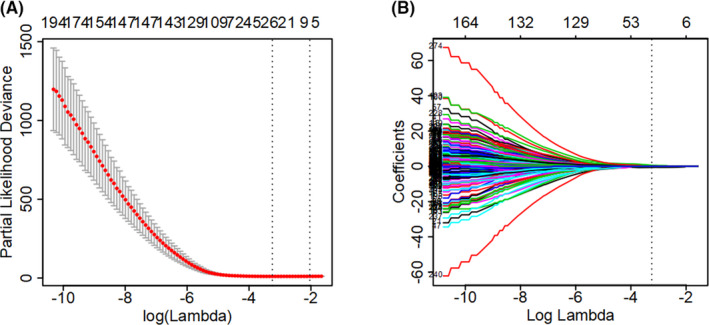
Methods: The RNA-seq profiles of autophagic genes and prognosis data of LGG were integrated from the Cancer Genome Atlas (TCGA) and Chinese Glioma Genome Atlas (CGGA). Univariate Cox analysis and the least absolute shrinkage and selection operator (LASSO) regression model were carried out to identify the differentially expressed prognostic autophagy-related genes. Then, the autophagic-gene signature was formed and verified in TCGA test set and external CGGA cohorts. Time-dependent receiver operating characteristic (ROC) was examined to test the accuracy of this signature feature. A nomogram was conducted to meet the needs of clinicians. Sankey diagrams were performed to visualize the relationship between the multigene signatures and clinic-pathological features.

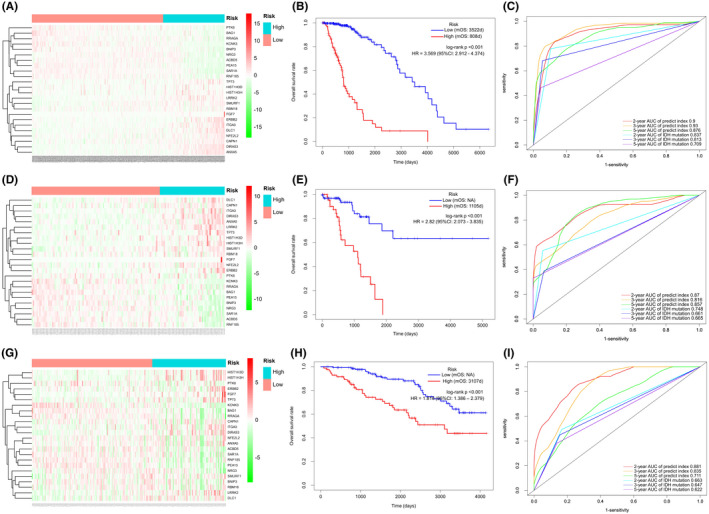
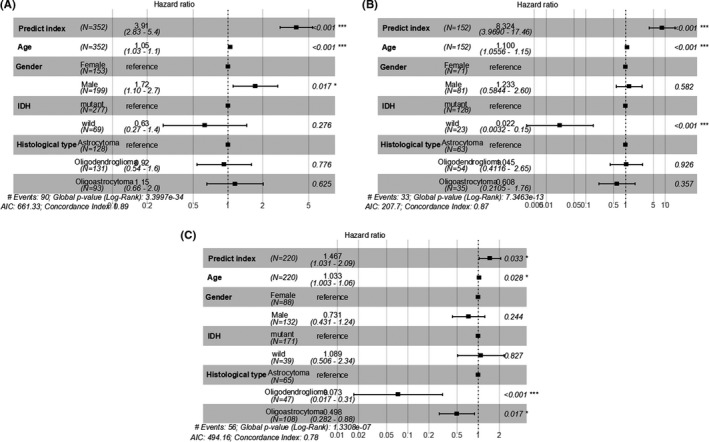
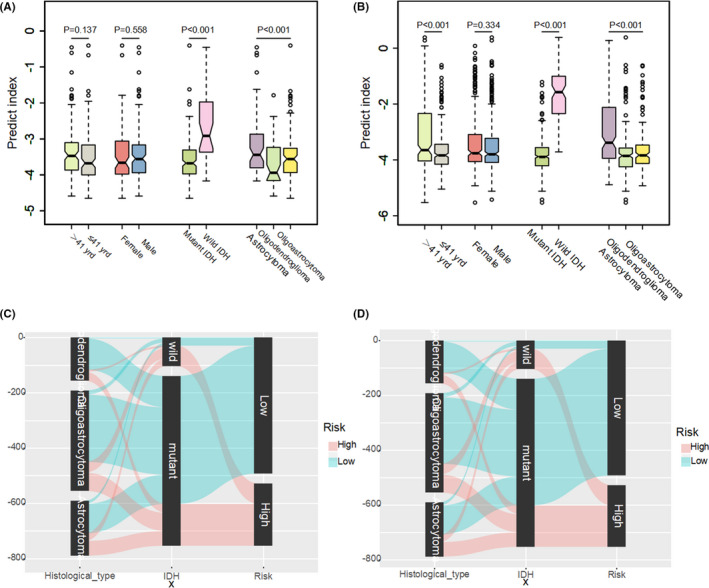
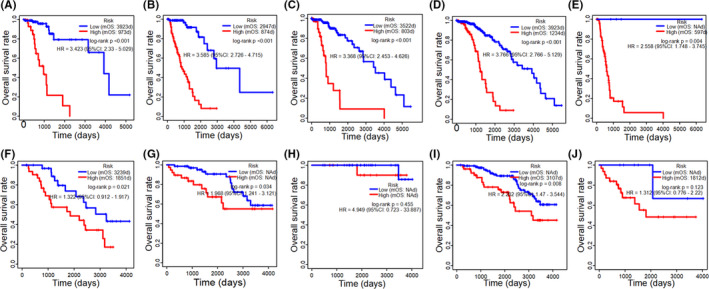
Results: Twenty-four ARGs were finally identified most relevant to LGG prognosis. According to the specific prediction index formula, the patients were classified into low-risk or high-risk groups. Prognostic accuracy was proved by time-dependent ROC analysis, with AUC 0.9, 0.93, and 0.876 at the survival time of 2-, 3-, and 5-year, respectively, which was superior to the AUC of the isocitrate dehydrogenase (IDH) mutation. The result was confirmed while validated in the TCGA test set and external validation CGGA cohort. A nomogram was constructed to meet individual needs. With a visualization approach, Sankey diagrams show the relationship of the histological type, IDH status, and predict index. In TCGA and CGGA cohorts, both low-risk groups displayed better survival rate in LGG while histological type and IDH status did not show consistency results.

Conclusions: 24-ARGs may play crucial roles in the progression of LGG, and LGG patients were effectively divided into low-risk and high-risk groups according to prognostic prediction. Overall, our study will provide novel strategies for clinical applications.

Keywords: autophagy; low-grade gliomas; nomogram; prognosis.


Conflict of interest statement

The authors declare that the research was conducted without any potential conflict of interest.

Figures

FIGURE 1
FIGURE 1
Analysis of autophagy‐related gene signatures in the TCGA cohort. (A) Tuning parameter (lambda) selection by the partial likelihood deviance, the lower partial likelihood deviance the better number of features in the LASSO regression model. (B) The penalty coefficient of 276 ARGs was optimized through 10‐fold cross‐validation in the training set
FIGURE 2
FIGURE 2
FIGUREDetermination and verification of 24‐autophagy‐related signatures in the TCGA and CGGA independent cohorts. The heatmap showed 24 differentially expressed autophagy genes in LGG between low and high groups of predict index in training set (A), test set (D) and validation set (G). Kaplan–Meier survival curves of overall survival rate between two clusters via Log‐rank in training set (B), test set (E), and validation set (H). Time dependent ROC curves between predict index and IDH mutation at 2, 3, and 5 years in training set (C), test set (F), and validation set (I). mOS: median overall survival
FIGURE 3
FIGURE 3
Multivariate Cox regression analysis of predict index and clinical parameters in TCGA and CGGA sets. Forest plot of HR in training set (A), test set (B), and validation set (C). HR: hazard ratio
FIGURE 4
FIGURE 4
The construction and verification of Nomogram for predicting OS of patients of LGG patients using the predict index and four clinicopathological characteristics to convey the results of prognostic models. (A) Each parameter got the point at the top scale, and the total points can be converted to predict 2‐, 3‐, and 5‐year probability of OS in the lowest scale. The x‐axis is nomogram‐predicted survival and y‐axis is fraction survival. The reference line is 45◦ and indicates perfect calibration, in training set (B), test set (C), and validation set (D)
FIGURE 5
FIGURE 5
Network of the 24‐ARGs associated biological pathways. The size and redness of the circle represents the degree of connection. (A) Biological process. (B) Molecular function. (C) Cellular components. (D) KEGG
FIGURE 6
FIGURE 6
The correlation between predict index and clinicopathological parameters in LGG. Predict index across different clinicopathological parameters via independent samples nonparametric tests in TCGA cohort (A) and CGGA cohort (B). Data are presented as box plots where the box indicates percentiles 25th and 75th. Box line represents sample median and diamonds sample mean, notches mark the half‐width. Sankey diagrams in TCGA cohort (C) and CGGA cohort (D). Left column of Sankey diagrams: histological type (red: predict index high, green: predict index low). Middle column: IDH status. Right column of Sankey diagrams: predict index
FIGURE 7
FIGURE 7
Kaplan–Meier survival curves of overall survival rate between two clusters (high‐risk and low‐risk) in different clinicopathological parameters. Kaplan–Meier plots summarize results from analysis of overall survival rate between high risk and low risk in oligoastrocytoma in the TCGA cohort (A), high‐risk and low‐risk in astrocytoma in TCGA cohort (B), high‐risk and low‐risk in oligodendroglioma in TCGA cohort (C), high‐risk and low‐risk in IDH mutation in TCGA cohort (D), high‐risk and low‐risk in IDH wild in TCGA cohort (E), high‐risk and low‐risk in oligoastrocytoma in CCGA cohort (F), high‐risk and low‐risk in astrocytoma in CCGA cohort (G), high‐risk and low‐risk in oligodendroglioma in CCGA cohort (H), high‐risk and low‐risk in IDH mutation in CCGA cohort (I), high‐risk and low‐risk in IDH wild in CCGA cohort (J). NA: not available. mOS: median overall survival

References

    1. Binello E, Germano IM. Targeting glioma stem cells: a novel framework for brain tumors. Cancer Sci. 2011;102:1958–1966. - PMC - PubMed
    1. Buckner JC, Shaw EG, Pugh SL, et al. Radiation plus procarbazine, CCNU, and vincristine in low‐grade glioma. N Engl J Med. 2016;374:1344–1355. - PMC - PubMed
    1. Shan X, Fan X, Liu X, Zhao Z, Wang Y, Jiang T. Clinical characteristics associated with postoperative seizure control in adult low‐grade gliomas: a systematic review and meta‐analysis. Neuro Oncol. 2018;20:324–331. - PMC - PubMed
    1. Darlix A, Goze C, Rigau V, Bauchet L, Taillandier L, Duffau H. The etiopathogenesis of diffuse low‐grade gliomas. Crit Rev Oncol Hematol. 2017;109:51–62. - PubMed
    1. Karpel‐Massler G, Nguyen TTT, Shang E, Siegelin MD. Novel IDH1‐targeted glioma therapies. CNS Drugs. 2019;33:1155–1166. - PMC - PubMed

Publication types

MeSH terms

Substances

LinkOut - more resources