Influence of Microgel Fabrication Technique on Granular Hydrogel Properties
- PMID: 33591726
- PMCID: PMC8966052
- DOI: 10.1021/acsbiomaterials.0c01612
Influence of Microgel Fabrication Technique on Granular Hydrogel Properties
Abstract
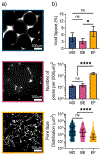
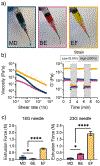
Bulk hydrogels traditionally used for tissue engineering and drug delivery have numerous limitations, such as restricted injectability and a nanoscale porosity that reduces cell invasion and mass transport. An evolving approach to address these limitations is the fabrication of hydrogel microparticles (i.e., "microgels") that can be assembled into granular hydrogels. There are numerous methods to fabricate microgels; however, the influence of the fabrication technique on granular hydrogel properties is unexplored. Herein, we investigated the influence of three microgel fabrication techniques (microfluidic devices (MD), batch emulsions (BE), and mechanical fragmentation by extrusion (EF)) on the resulting granular hydrogel properties (e.g., mechanics, porosity, and injectability). Hyaluronic acid (HA) modified with various reactive groups (i.e., norbornenes (NorHA), pentenoates (HA-PA), and methacrylates (MeHA)) were used to form microgels with an average diameter of ∼100 μm. The MD method resulted in homogeneous spherical microgels, the BE method resulted in heterogeneous spherical microgels, and the EF method resulted in heterogeneous polygonal microgels. Across the various reactive groups, microgels fabricated with the MD and BE methods had lower functional group consumption when compared to microgels fabricated with the EF method. When microgels were jammed into granular hydrogels, the storage modulus (G') of EF granular hydrogels (∼1000-3000 Pa) was consistently an order of magnitude higher than G' for MD and BE granular hydrogels (∼50-200 Pa). Void space was comparable across all groups, although EF granular hydrogels exhibited an increased number of pores and decreased average pore size when compared to MD and BE granular hydrogels. Furthermore, granular hydrogel properties were tuned by varying the amount of cross-linker used during microgel fabrication. Lastly, granular hydrogels were injectable across formulations due to their general shear-thinning and self-healing properties. Taken together, this work thoroughly characterizes the influence of the microgel fabrication technique on granular hydrogel properties to inform the design of future systems for biomedical applications.
Keywords: granular hydrogels; hyaluronic acid; hydrogels; injectable; microfluidics; microgels.
Figures


Similar articles
-
Fragmenting Bulk Hydrogels and Processing into Granular Hydrogels for Biomedical Applications.J Vis Exp. 2022 May 17;(183):10.3791/63867. doi: 10.3791/63867. J Vis Exp. 2022. PMID: 35662235 Free PMC article.
-
Measurement and Comparison of Hyaluronic Acid Hydrogel Mechanics Across Length Scales.J Biomed Mater Res A. 2025 Mar;113(3):e37889. doi: 10.1002/jbm.a.37889. J Biomed Mater Res A. 2025. PMID: 40033794 Free PMC article.
-
Injectable hyaluronic acid and platelet lysate-derived granular hydrogels for biomedical applications.Acta Biomater. 2021 Jan 1;119:101-113. doi: 10.1016/j.actbio.2020.10.040. Epub 2020 Oct 29. Acta Biomater. 2021. PMID: 33130309
-
Advances in the Development of Granular Microporous Injectable Hydrogels with Non-spherical Microgels and Their Applications in Tissue Regeneration.Adv Healthc Mater. 2024 Oct;13(25):e2301597. doi: 10.1002/adhm.202301597. Epub 2023 Aug 4. Adv Healthc Mater. 2024. PMID: 37499268 Review.
-
Injectable microgel and micro-granular hydrogels for bone tissue engineering.Biofabrication. 2025 Apr 22;17(3). doi: 10.1088/1758-5090/adcc58. Biofabrication. 2025. PMID: 40228520 Review.
Cited by
-
Injectable Granular Hydrogels Enable Avidity-Controlled Biotherapeutic Delivery.ACS Biomater Sci Eng. 2024 Mar 11;10(3):1577-1588. doi: 10.1021/acsbiomaterials.3c01906. Epub 2024 Feb 15. ACS Biomater Sci Eng. 2024. PMID: 38357739 Free PMC article.
-
Growing Pains: The Need for Engineered Platforms to Study Growth Plate Biology.Adv Healthc Mater. 2022 Oct;11(19):e2200471. doi: 10.1002/adhm.202200471. Epub 2022 Aug 15. Adv Healthc Mater. 2022. PMID: 35905390 Free PMC article. Review.
-
Silk-based hydrogel incorporated with metal-organic framework nanozymes for enhanced osteochondral regeneration.Bioact Mater. 2022 May 31;20:221-242. doi: 10.1016/j.bioactmat.2022.05.025. eCollection 2023 Feb. Bioact Mater. 2022. PMID: 35702612 Free PMC article.
-
Particle fraction is a bioactive cue in granular scaffolds.Acta Biomater. 2022 Sep 15;150:111-127. doi: 10.1016/j.actbio.2022.07.051. Epub 2022 Jul 31. Acta Biomater. 2022. PMID: 35917913 Free PMC article.
-
Photo-responsive decellularized small intestine submucosa hydrogels.Adv Funct Mater. 2024 Sep 4;34(36):2401952. doi: 10.1002/adfm.202401952. Epub 2024 Apr 18. Adv Funct Mater. 2024. PMID: 39525288
References
-
- Van Vlierberghe S; Dubruel P; Schacht E Biopolymer-Based Hydrogels as Scaffolds for Tissue Engineering Applications: A Review. Biomacromolecules 2011, 12 (5), 1387–1408. - PubMed
-
- Li C; Ouyang L; Armstrong JPK; Stevens MM Advances in the Fabrication of Biomaterials for Gradient Tissue Engineering. Trends Biotechnol. 2020, 1–14. - PubMed
Publication types
MeSH terms
Substances
Grants and funding
LinkOut - more resources
Full Text Sources
Other Literature Sources
